AI Code Review
Why Tracking Technical Debt Metrics Matters

Sonali Sood

Founding GTM, CodeAnt AI
Technical debt quietly drains engineering productivity and slows innovation. Most teams don’t realize how much time and budget they lose until delivery starts slipping and systems become fragile.
In reality:
Engineering organizations spend 20-40% of development effort maintaining or working around technical debt.
Teams without visibility into debt:
Chase recurring bugs
Build short-term workarounds
Delay new feature delivery
Companies that actively reduce technical debt can free up nearly 50% more developer time.
The problem isn’t just the debt, it’s the lack of clear, actionable visibility. Without metrics, technical debt stays:
Hidden
Under-prioritized
Treated reactively instead of strategically
This is where technical debt metrics matter. The right metrics give leaders visibility across:
Code-level health (complexity, duplication, hotspots)
Architectural risk (tight coupling, fragile dependencies)
Engineering flow (PR cycle times, review latency)
Team health (rework rates, cognitive load)
In this guide, we’ll break down the most important technical debt metrics.
Code-Level Quality Metrics: Detecting Debt in the Codebase
Technical debt starts at the code layer. The earliest warning signs usually show up as code-quality regressions, long before delivery slows or architecture breaks down.
The most reliable leading indicators of technical debt include:
Cyclomatic complexity
Cognitive complexity
Test coverage gaps
When these metrics drift, teams pay the price later in:
Slower changes
Higher defect rates
Fragile releases
Why this matters:
High cyclomatic or cognitive complexity makes code harder to understand, test, and modify
Complex functions are statistically more defect-prone and expensive to maintain
Duplicated code often points to missed abstractions and design shortcuts
Platforms like CodeAnt.ai automatically surface these risks and help reduce technical debt by identifying duplication and maintainability issues early.
Key Code-Level Metrics Every Team Should Track
1. Complexity Metrics (Cyclomatic, Cognitive, Nesting Depth)
Track:
Per-function complexity
File-level risk concentration
Why it matters:
High complexity directly correlates with higher bug density
Complex code slows onboarding and increases change risk
These are high-confidence candidates for refactoring.
2. Code Duplication & Dead Code
Look for:
Copied logic across files
Unused functions, abandoned branches, unreachable code
Why it matters:
Increases maintenance cost
Expands the blast radius of bugs
Hides structural design problems
Static analysis tools and platforms like CodeAnt AI can automatically flag:
Cloned blocks
Orphaned code
Duplicate logic at PR time
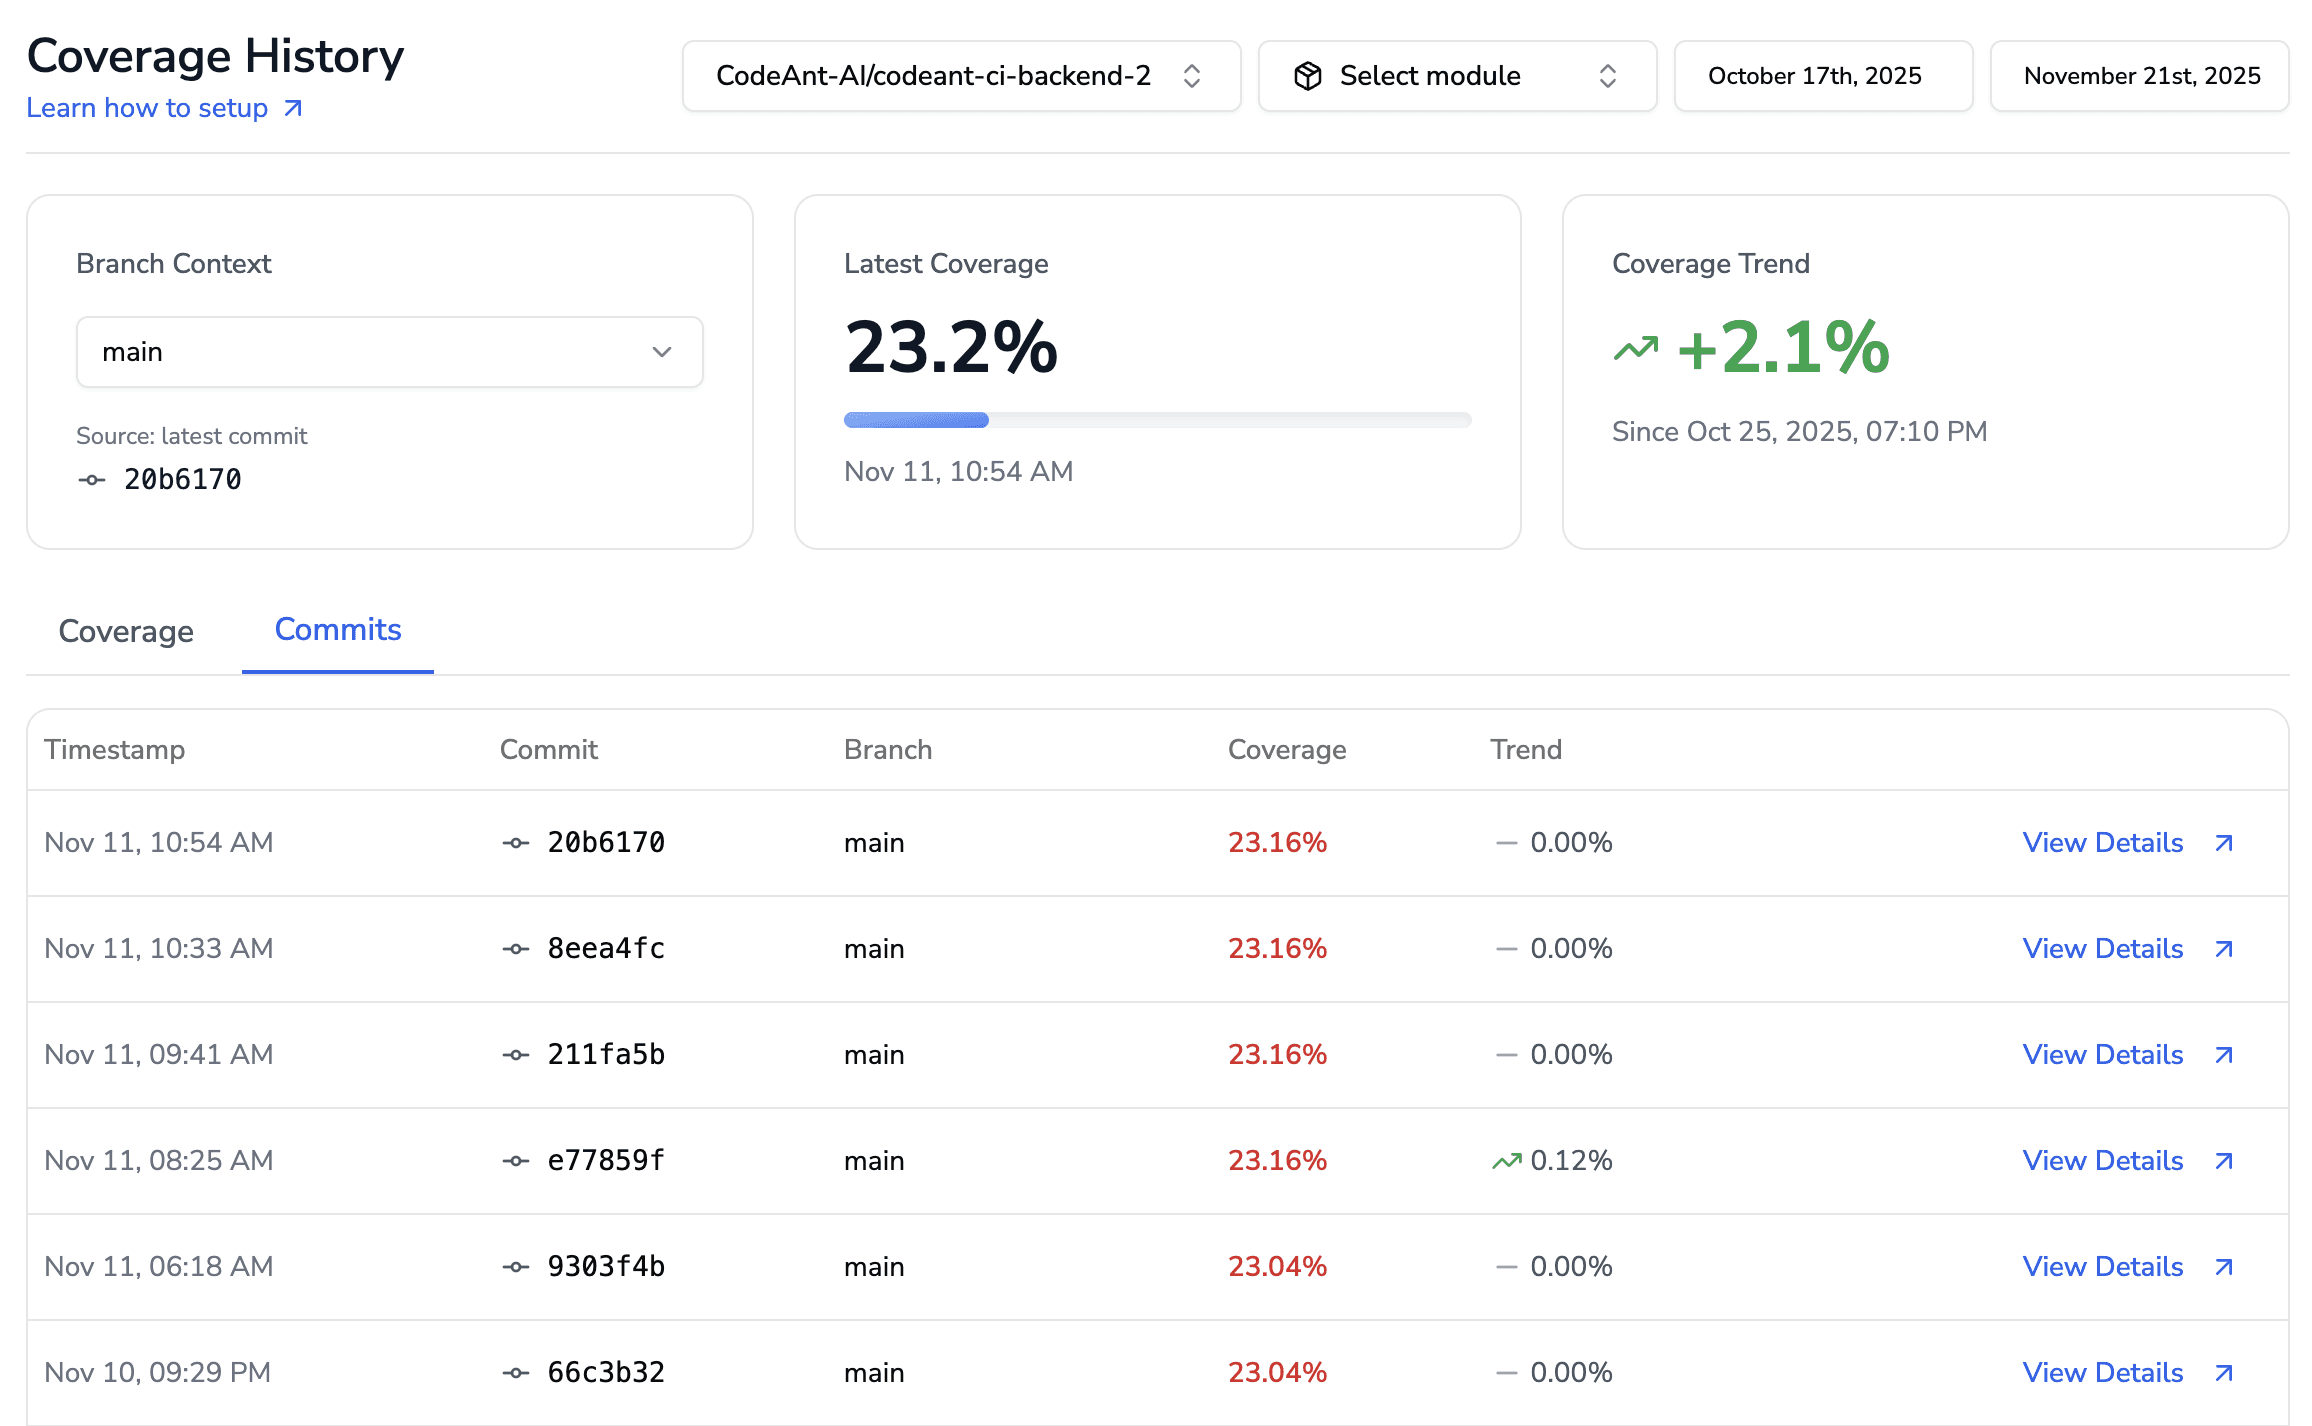
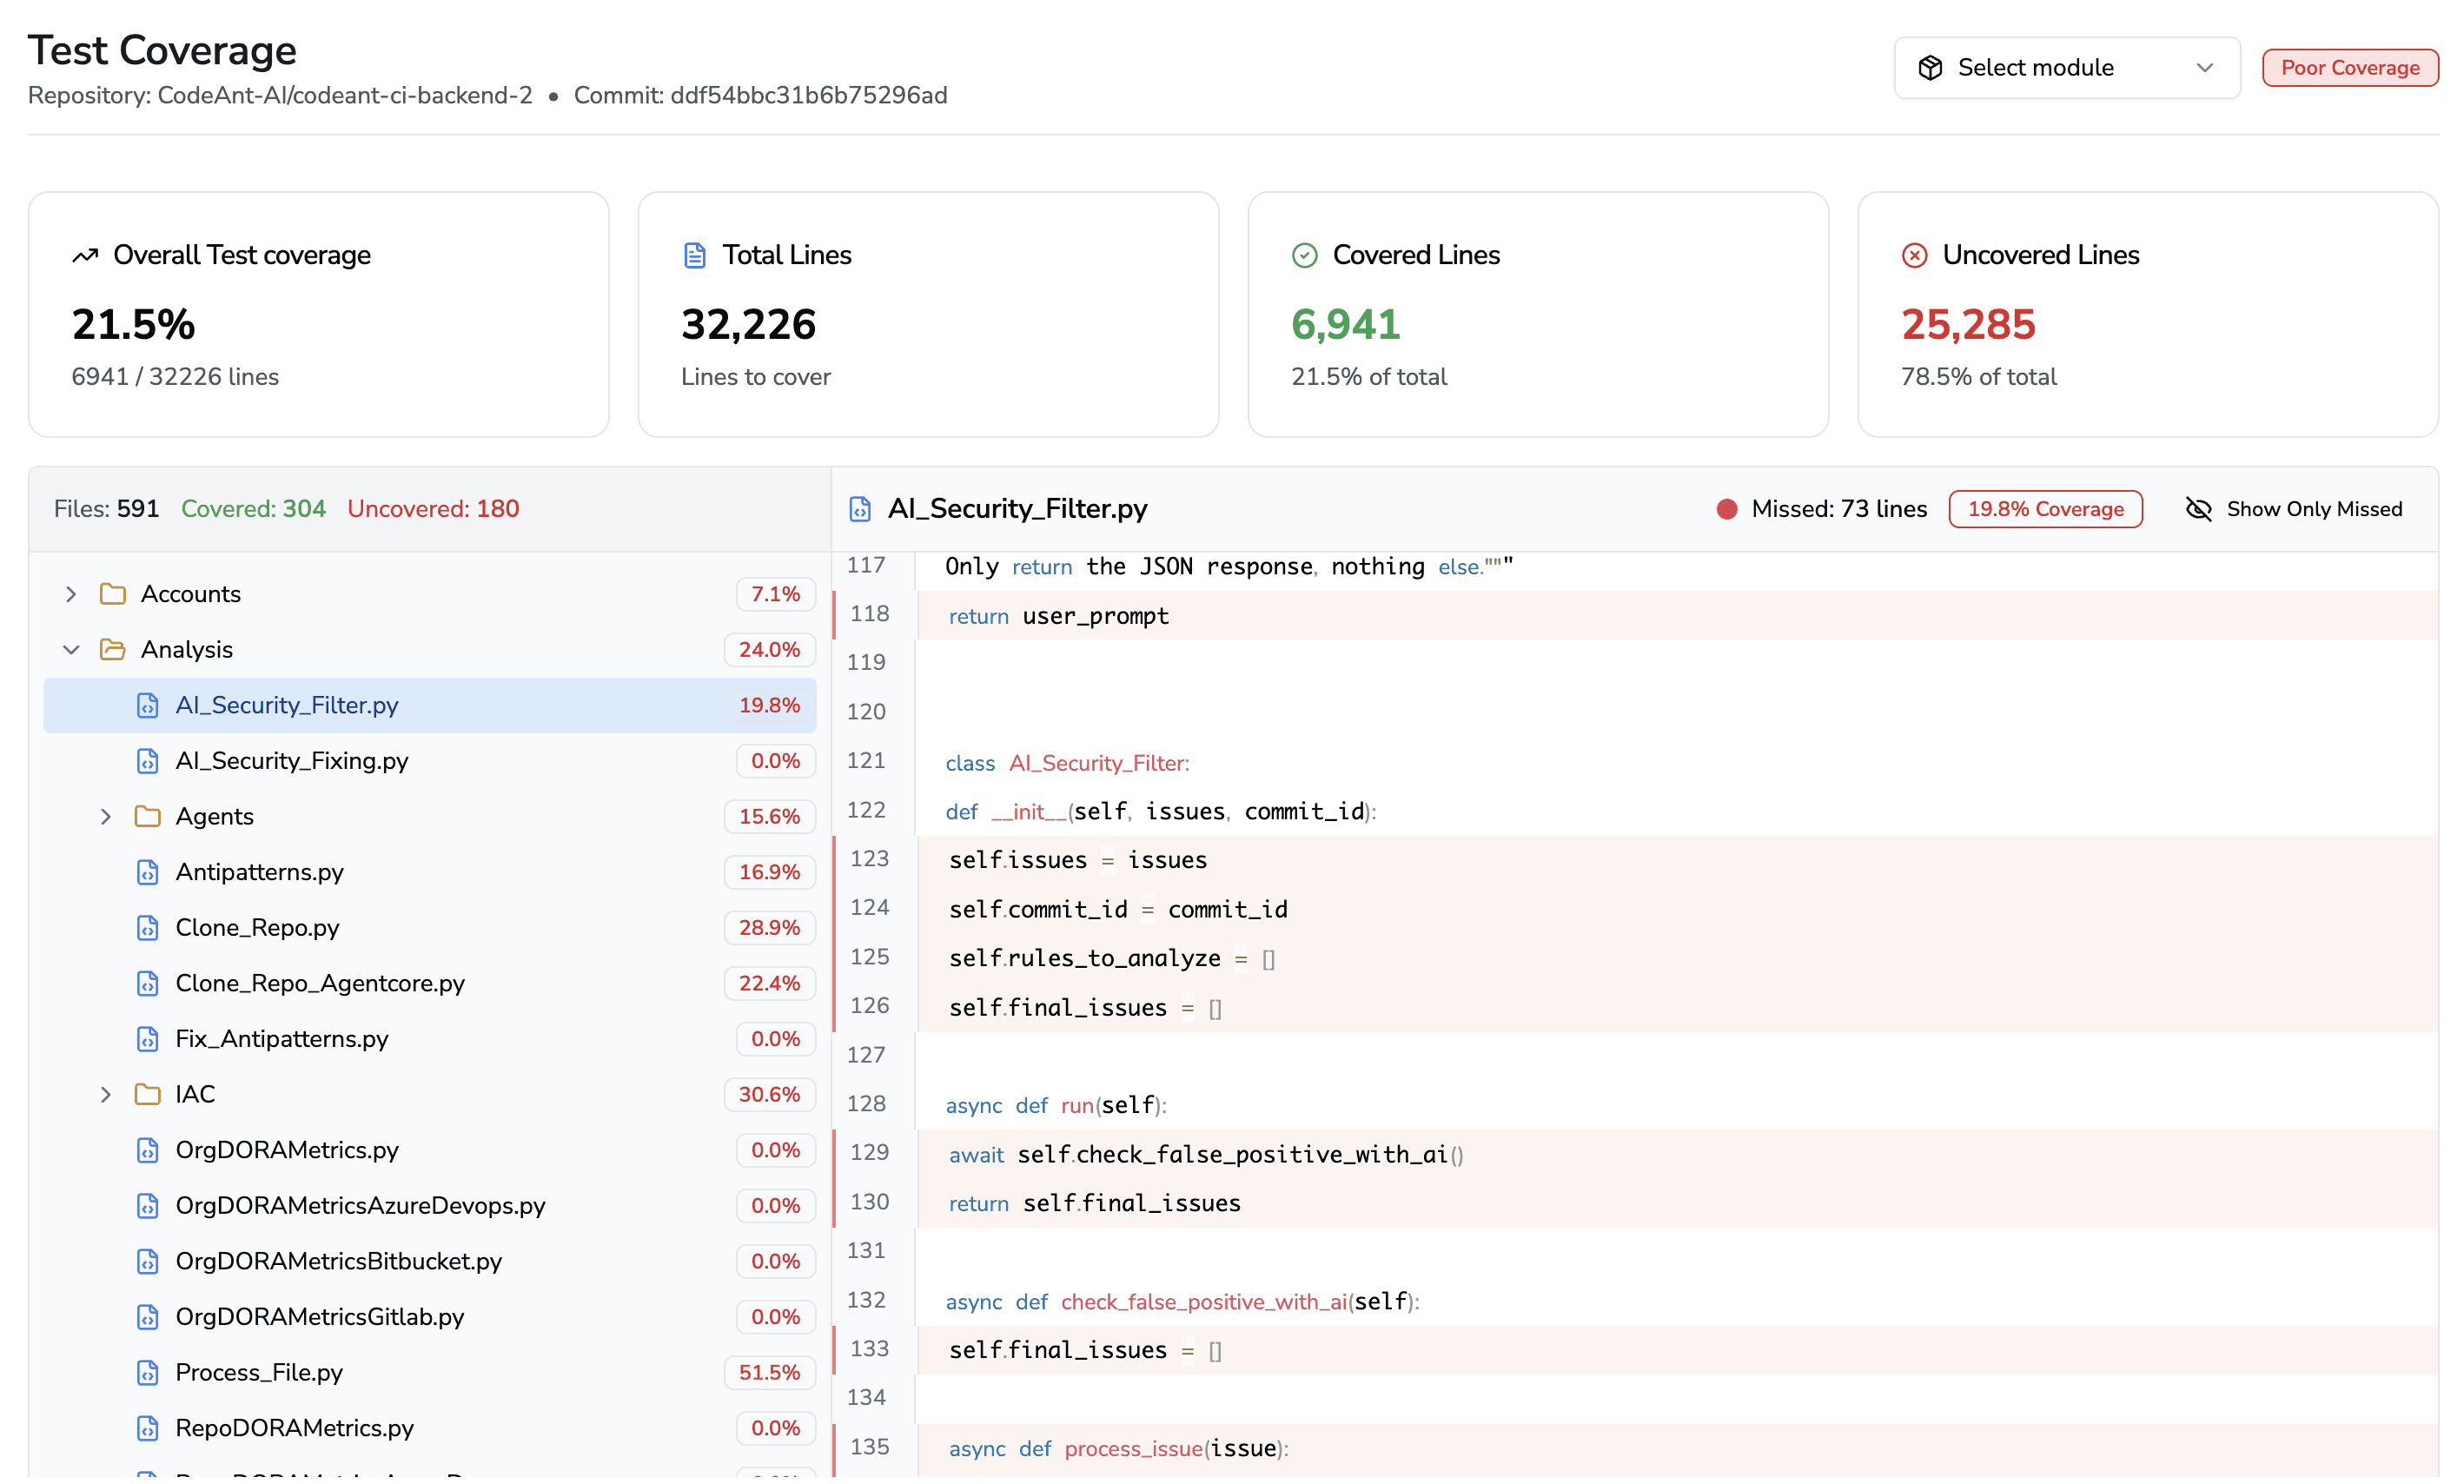
3. Test Coverage & Test Quality
Track:
Line and branch coverage
Coverage trends (not just snapshots)
Why it matters:
Low or declining coverage is a direct debt signal
Untested code is expensive to change and risky to refactor
Platforms such as CodeAnt AI surface coverage regressions per commit and enforce standards directly inside pull requests.
Healthy signal:
Coverage steadily improving
High-risk files fully tested
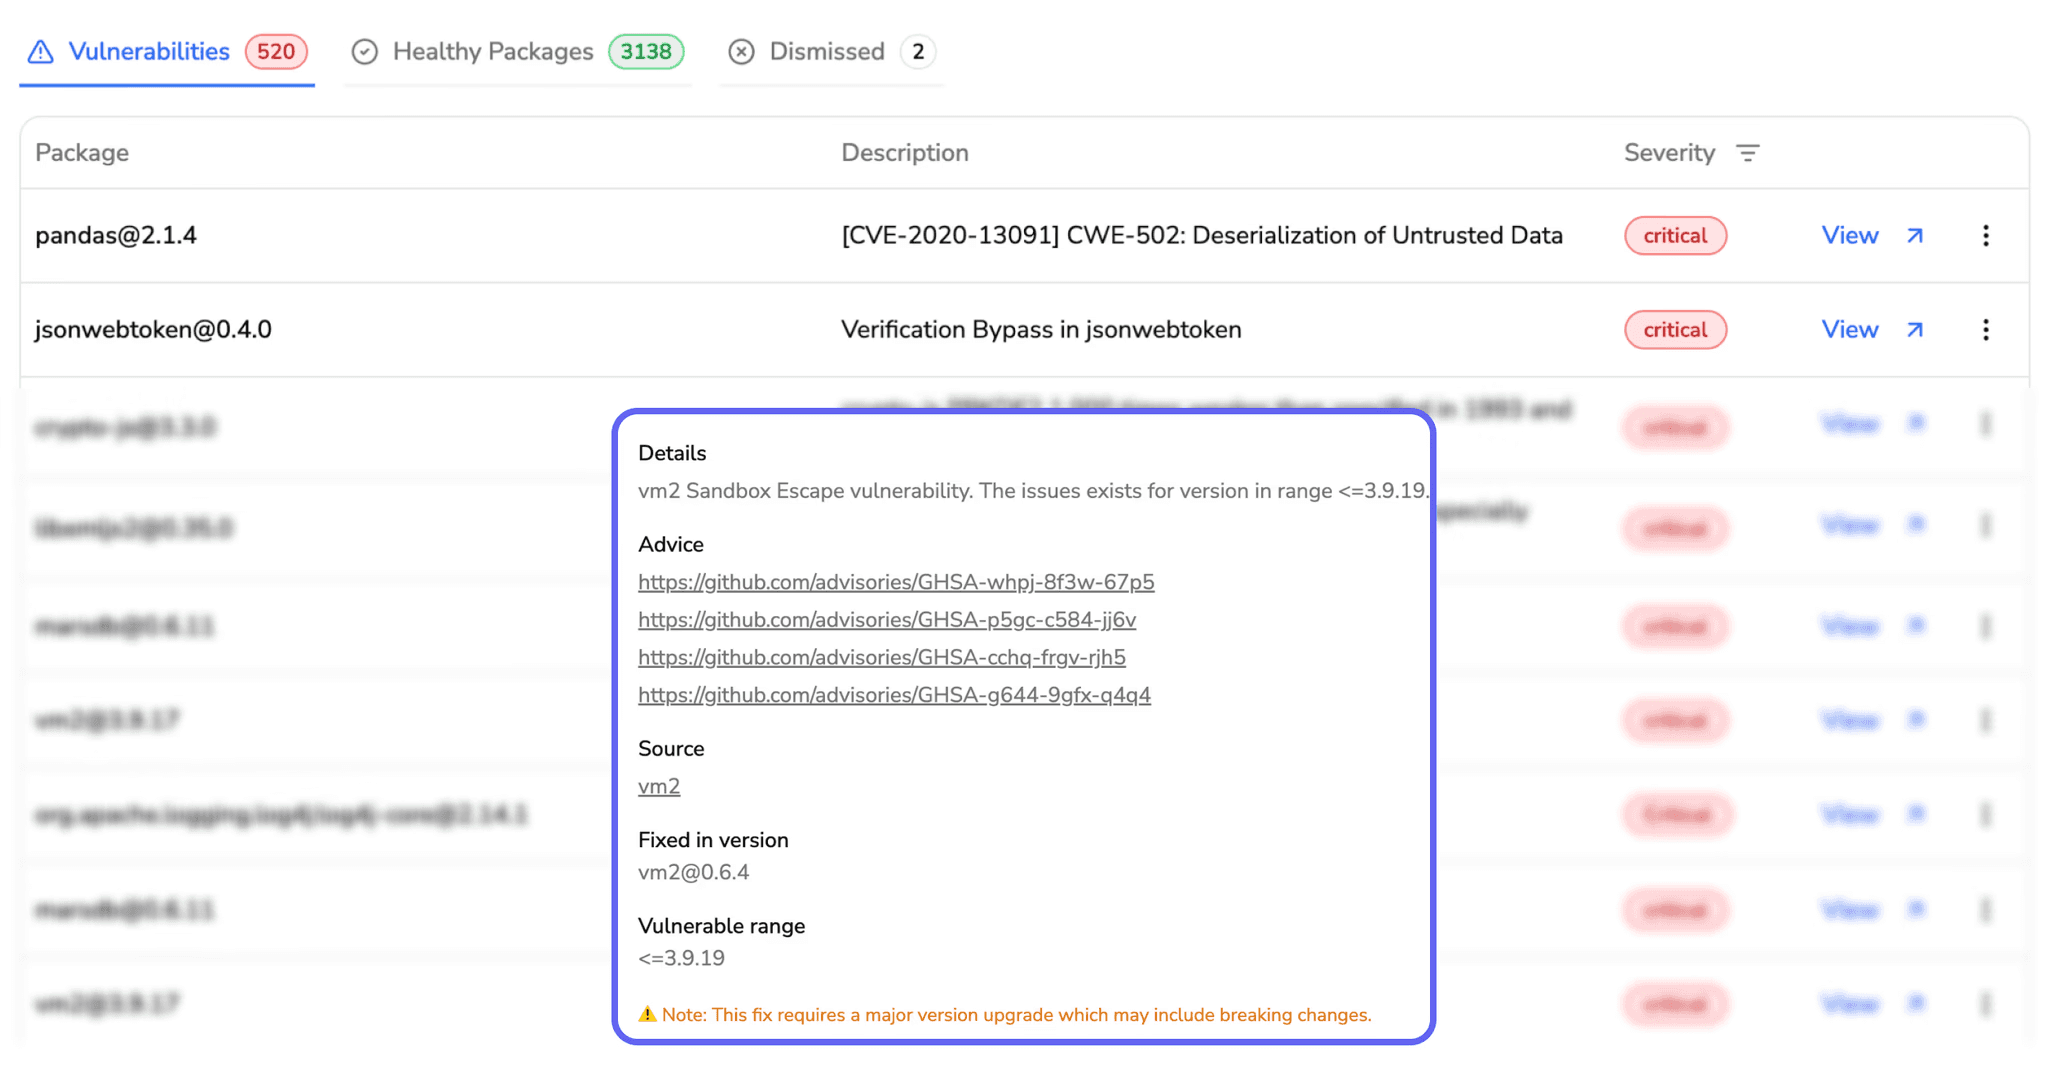
4. Bug Density & Security Exposure
Measure:
Defects per module / per KLOC
Open vs. resolved vulnerabilities
SAST, secrets scanning, dependency risks
Why it matters:
Rising bug trends usually indicate hidden structural debt
A significant percentage of technical debt originates from rushed, non-compliant code changes
Catching issues early via:
Static analysis
Dependency scanning
Secrets detection
…prevents expensive rework later in the lifecycle.
Why Leaders Should Care About These Metrics
Focusing on output metrics like:
Lines of code
Raw commits
…is actively misleading.
More code often means:
More hidden complexity
More coupled logic
More long-term maintenance overhead
High-performing teams instead optimize for:
Maintainability
Readability
Testability
As CodeAnt.ai’s internal analysis consistently shows:
Higher code quality → fewer defects
Faster onboarding
Lower technical debt accumulation
Making These Metrics Actionable
Modern static analysis platforms (CodeAnt AI, SonarQube, etc.) can:
Run automatically in CI/CD
Analyze code on every commit
Surface risk in pull requests
Track trends over time
This allows teams to:
See debt accumulating in real time
Intervene early
Prevent “fix-it-later” code from becoming permanent architecture
Architectural & Repository Metrics: The Bigger Picture
Beyond line‐by‐line code quality, technical debt also lives at the architectural and repository level. Here are critical metrics that reflect systemic debt:
Modularity & Coupling
Highly coupled modules or services make changes ripple unpredictably. Metrics like average component dependency or propagation cost can reveal architectural debt. Low cohesion within modules may even warrant major refactoring. Keeping modules cohesive and loosely coupled is key, a low cohesion or high cyclomatic complexity across large classes signals an unhealthy architecture.
Code Churn & Rework
At the repo level, track code churn (rework). Define churn as recently shipped code that is later rewritten. A high rework rate means developers spend too much time fixing recently merged code, a telltale debt sign. If every release sees significant backtracking, teams should prioritize those hotspots.
Dependency & Library Age
Outdated or polyglot dependencies increase maintenance risk. Counting the share of dependencies beyond end-of-life (e.g. old Java or Python versions) or tracking vulnerable library counts helps quantify debt. (For example, CAST Imaging reports design violations and outdated architecture as debt drivers)
Backlog & Open Issues
A large backlog of technical tasks (e.g., code review comments and unresolved bugs) often indicates ignored technical debt. Tracking the ratio of new vs. closed bugs is especially telling: spikes in open bugs usually mean developers have applied quick fixes without addressing root causes, which increases technical debt. Similarly, monitoring the age of pull request backlogs (e.g., how many PRs are stale for more than 48 or 72 hours) helps reveal review bottlenecks and signs of growing debt.
Together, these signals show whether your system is:
Compounding healthy design decisions or
Quietly decaying under accumulated debt
At scale, leading organizations build what McKinsey refers to as a “technical debt balance sheet” by profiling debt drivers directly from:
Repository data
Architecture graphs
Ticketing systems
Even lightweight versions of this practice give leaders a powerful advantage.
Process and Team Metrics: Delivery Flow and Productivity
Even when the codebase is healthy, process gaps and team dynamics can silently create technical debt. Workflow bottlenecks multiply small issues into systemic slowdowns, which is why engineering leaders must track flow and productivity metrics that connect technical debt to real delivery performance.
These metrics help answer:
Where is work getting stuck?
Where is rework happening?
Where is delivery slowing down?
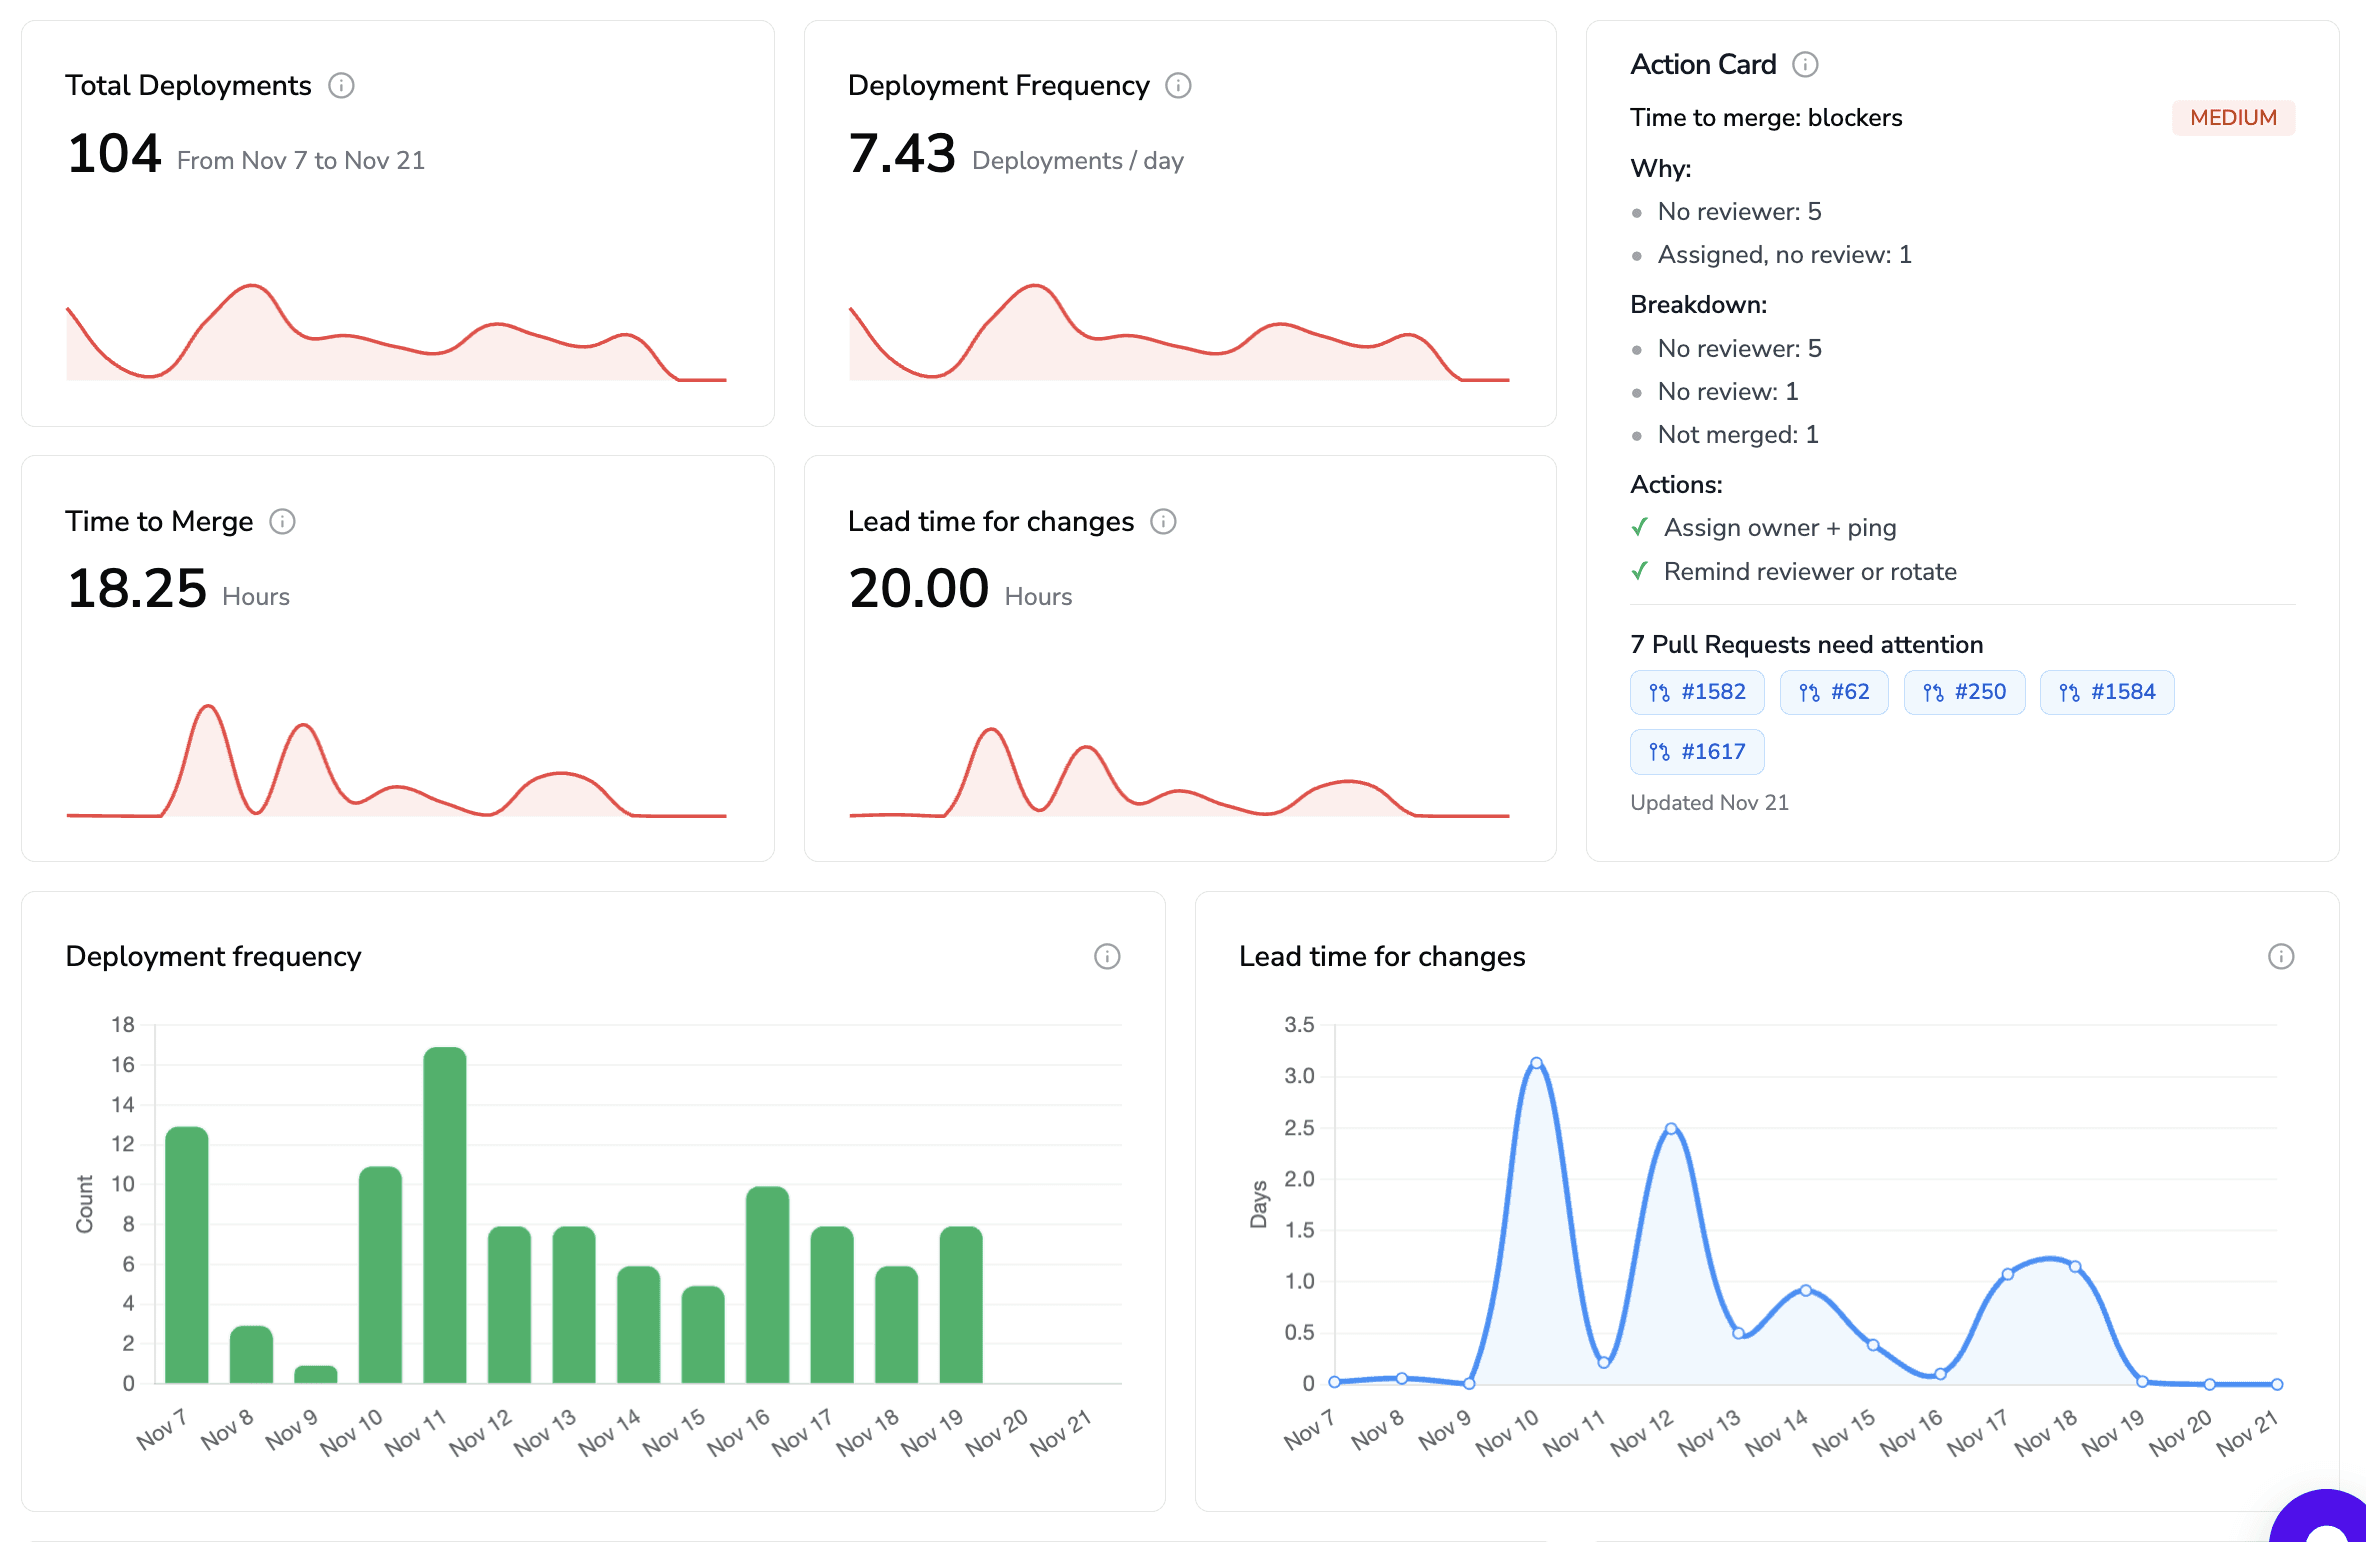
DORA Metrics
The most trusted process health indicators are the DORA metrics:
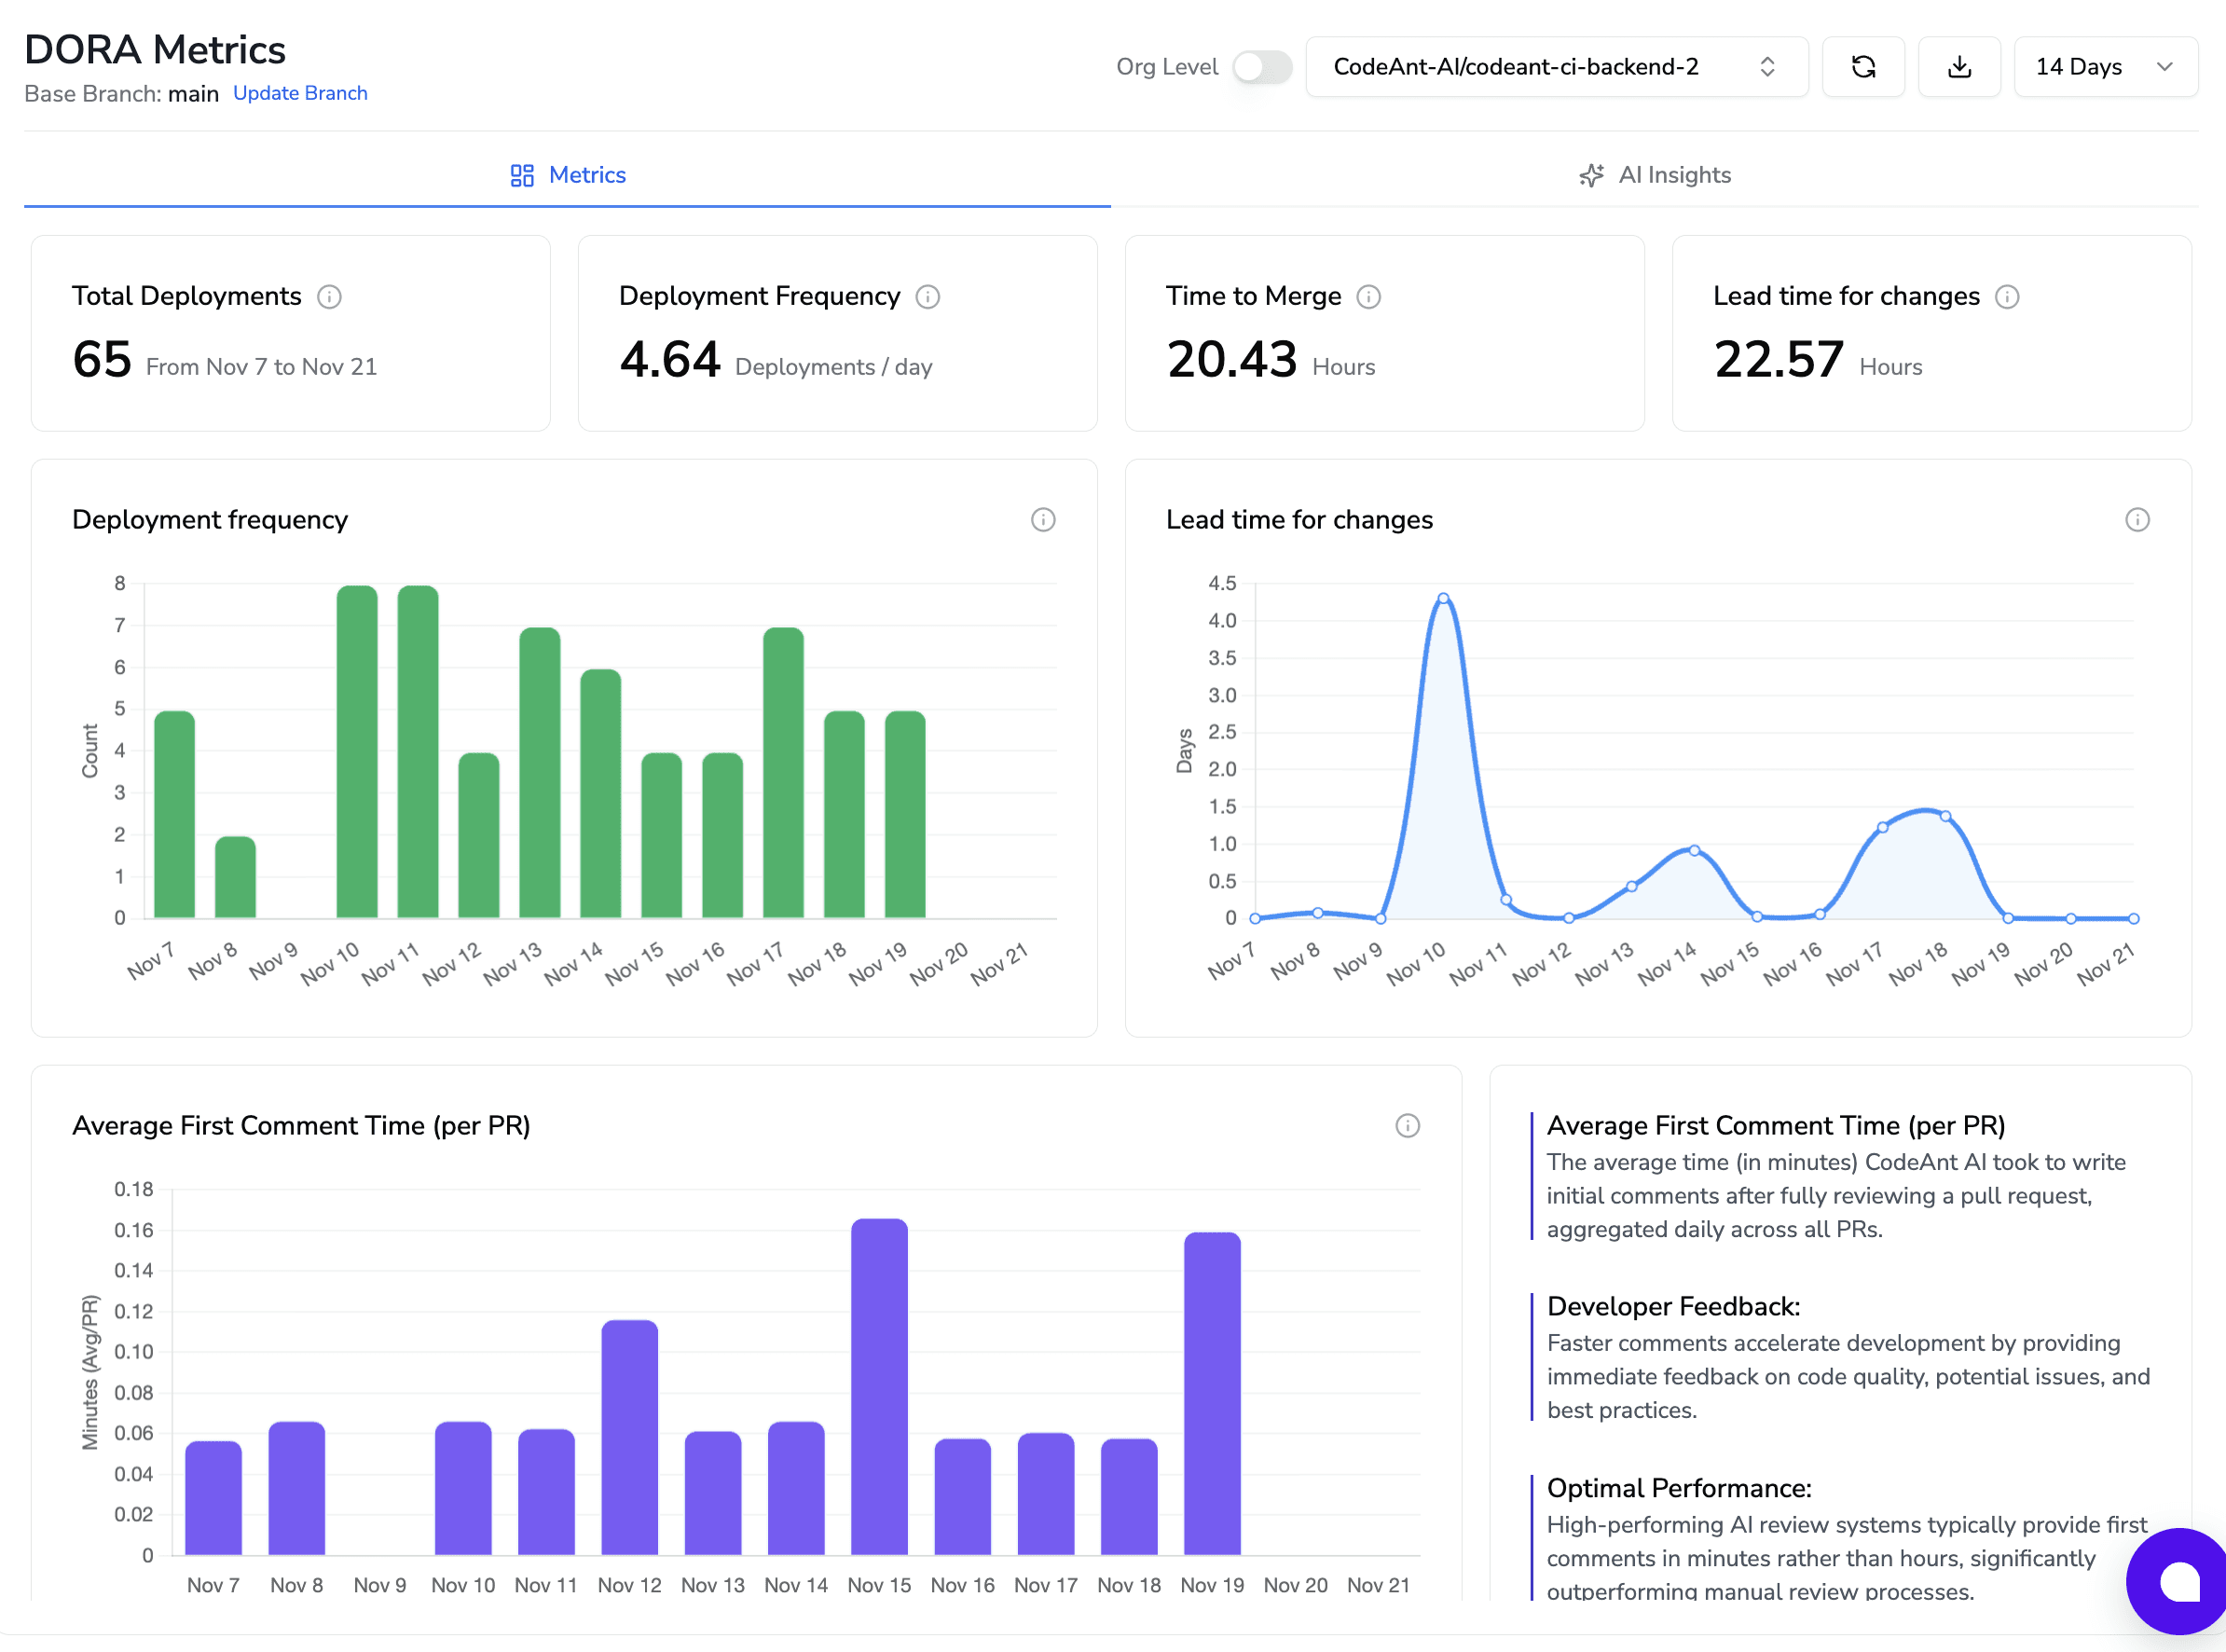
Track:
Lead time (cycle time)
Deployment frequency
Change failure rate
Mean time to recovery (MTTR)
Why they matter:
Short lead times = healthy engineering flow
High deployment frequency = efficient delivery
Low change failure rate = stable systems
Low MTTR = resilient teams
High-performing teams align code quality and review metrics with DORA outcomes to ship faster with fewer defects. Platforms like CodeAnt AI make this visible by tracking DORA metrics across repositories and linking them directly to code quality trends.
Pull Request & Review Metrics
The code review process is where technical debt either gets stopped or embedded.
Key metrics to track:
Time to First Review (TTFR)
Time to Merge (TTM)
Review cycle count
PR backlog size
Merge velocity
What these signals reveal:
Long TTFR → reviewers are overloaded
Large PR backlogs → quality feedback is delayed
Slow merges → hidden process friction
Rework & Defect Rate
Technical debt often shows up after code is merged, not before.
Track:
Revert rates
Post-merge defect rates
Hotfix frequency
Change failure rate (as part of DORA)
Why these matter:
High rework = unstable code
Frequent hotfixes = rushed engineering
Failures in production = accumulated debt surfacing
Reviewer Workload & Bottlenecks
When review work is unevenly distributed, delivery slows and debt grows.
Track:
PRs reviewed per engineer
Review SLA adherence (% of PRs reviewed within target time)
Response time by reviewer
This helps leaders:
Balance reviewer workloads
Prevent queues
Reduce idle wait time
CodeAnt’s Developer 360 analytics (PR sizes, response times, velocity) help balance load and prevent reviewer queues.

Team Velocity & Throughput
Traditional velocity metrics become powerful when tied to debt signals.
Track:
PRs merged per week
Average cycle time
New work vs. maintenance work ratio
A strong signal of rising debt:
More time spent on fixes than new features
Growing maintenance-to-innovation ratio
Top-performing teams use OKRs to measure:
Time spent on new capabilities
Time spent paying down technical debt
Why These Metrics Matter
The best teams don’t measure activity, they measure outcomes.
High-quality metrics reveal:
Faster feature delivery
Higher system reliability
Better developer experience
Leaders often combine:
DORA (delivery performance)
SPACE (satisfaction, performance, activity, communication, efficiency)
Custom workflow metrics
…to build a complete picture of engineering health.
The Bottom Line
By monitoring process and people metrics, leaders can spot debt-driven slowdowns early:
Rising change failure rates often signal hidden architectural or testing gaps
Increasing cycle times usually reflect growing process friction
Stable or improving DORA scores typically correlate with healthy debt management
In short, process metrics quantify the real cost of technical debt in time, risk, and delivery speed.
From Metrics to Action: Prioritizing Technical Debt for Outcomes
Collecting metrics is only half the work. The real impact comes when data drives decisions, not when it sits in dashboards.
High-performing engineering leaders use technical debt metrics to:
Triage risk
Prioritize work
Align teams around outcomes
Turning Signals into Priorities
The most valuable insights come from combined metrics, not isolated ones.
Examples:
A spike in cyclomatic complexity + rising bug density → high-priority refactor candidate
Worsening DORA lead time → investigate PR size, review delays, and rework patterns
Growing churn in specific files → architectural hotspot
This shifts technical debt from “abstract problem” to clear, ranked work items.
Making Technical Debt Visible to Stakeholders
Quantified metrics make debt conversations credible.
Leaders can now report:
Rework hours per feature
Test coverage trends
Time lost to review bottlenecks
Throughput erosion
Best-practice teams build a lightweight version of a “technical debt balance sheet”, estimating:
Developer hours lost to debt
Modernization cost
Business value unlocked
This turns refactoring from “engineering hygiene” into a business investment.
Tie Debt Work to Business Outcomes
Executives don’t fund clean code. They fund results.
Effective framing includes:
“15% reduction in lead time” → faster time-to-market
“10% increase in coverage” → lower production risk
“50% faster review times” → higher engineering throughput
This moves debt reduction from cost center → revenue enabler.
Operationalizing Prioritization
The best teams define explicit, measurable goals, such as:
Increase test coverage by 10%
Cut PR cycle time in half
Reduce high-risk hotspots by 30%
Frameworks like the “4 Quadrants of Technical Debt” (prudent vs. reckless, deliberate vs. inadvertent) help leaders focus on:
The most expensive 20% of debt
The debt causing 80% of operational pain
Combining this with productivity signals (PR turnaround, defect trends) creates a clear, ranked backlog of technical debt work.
Making Tech Debt a Continuous Discipline
Great teams don’t treat tech debt as a one-off cleanup.
They:
Set explicit OKRs for debt reduction
Allocate sprint capacity to debt work
Review progress quarterly
Modern platforms like CodeAnt AI make this practical by:
Surfacing insecure shortcuts
Detecting architectural drift
Tracking debt trends alongside delivery metrics
The Outcome
When done well, metrics create a self-reinforcing loop:
Lower complexity
Higher test coverage
Faster reviews
Better DORA scores
…which directly translate into:
Higher throughput
Lower operational risk
Faster, safer delivery
How CodeAnt AI Helps Quantify and Reduce Tech Debt
All the above metrics are hard to track manually – this is where CodeAnt AI steps in. CodeAnt’s platform continuously analyzes every code change, build, and deployment to turn code and workflow data into meaningful debt metrics. For example:
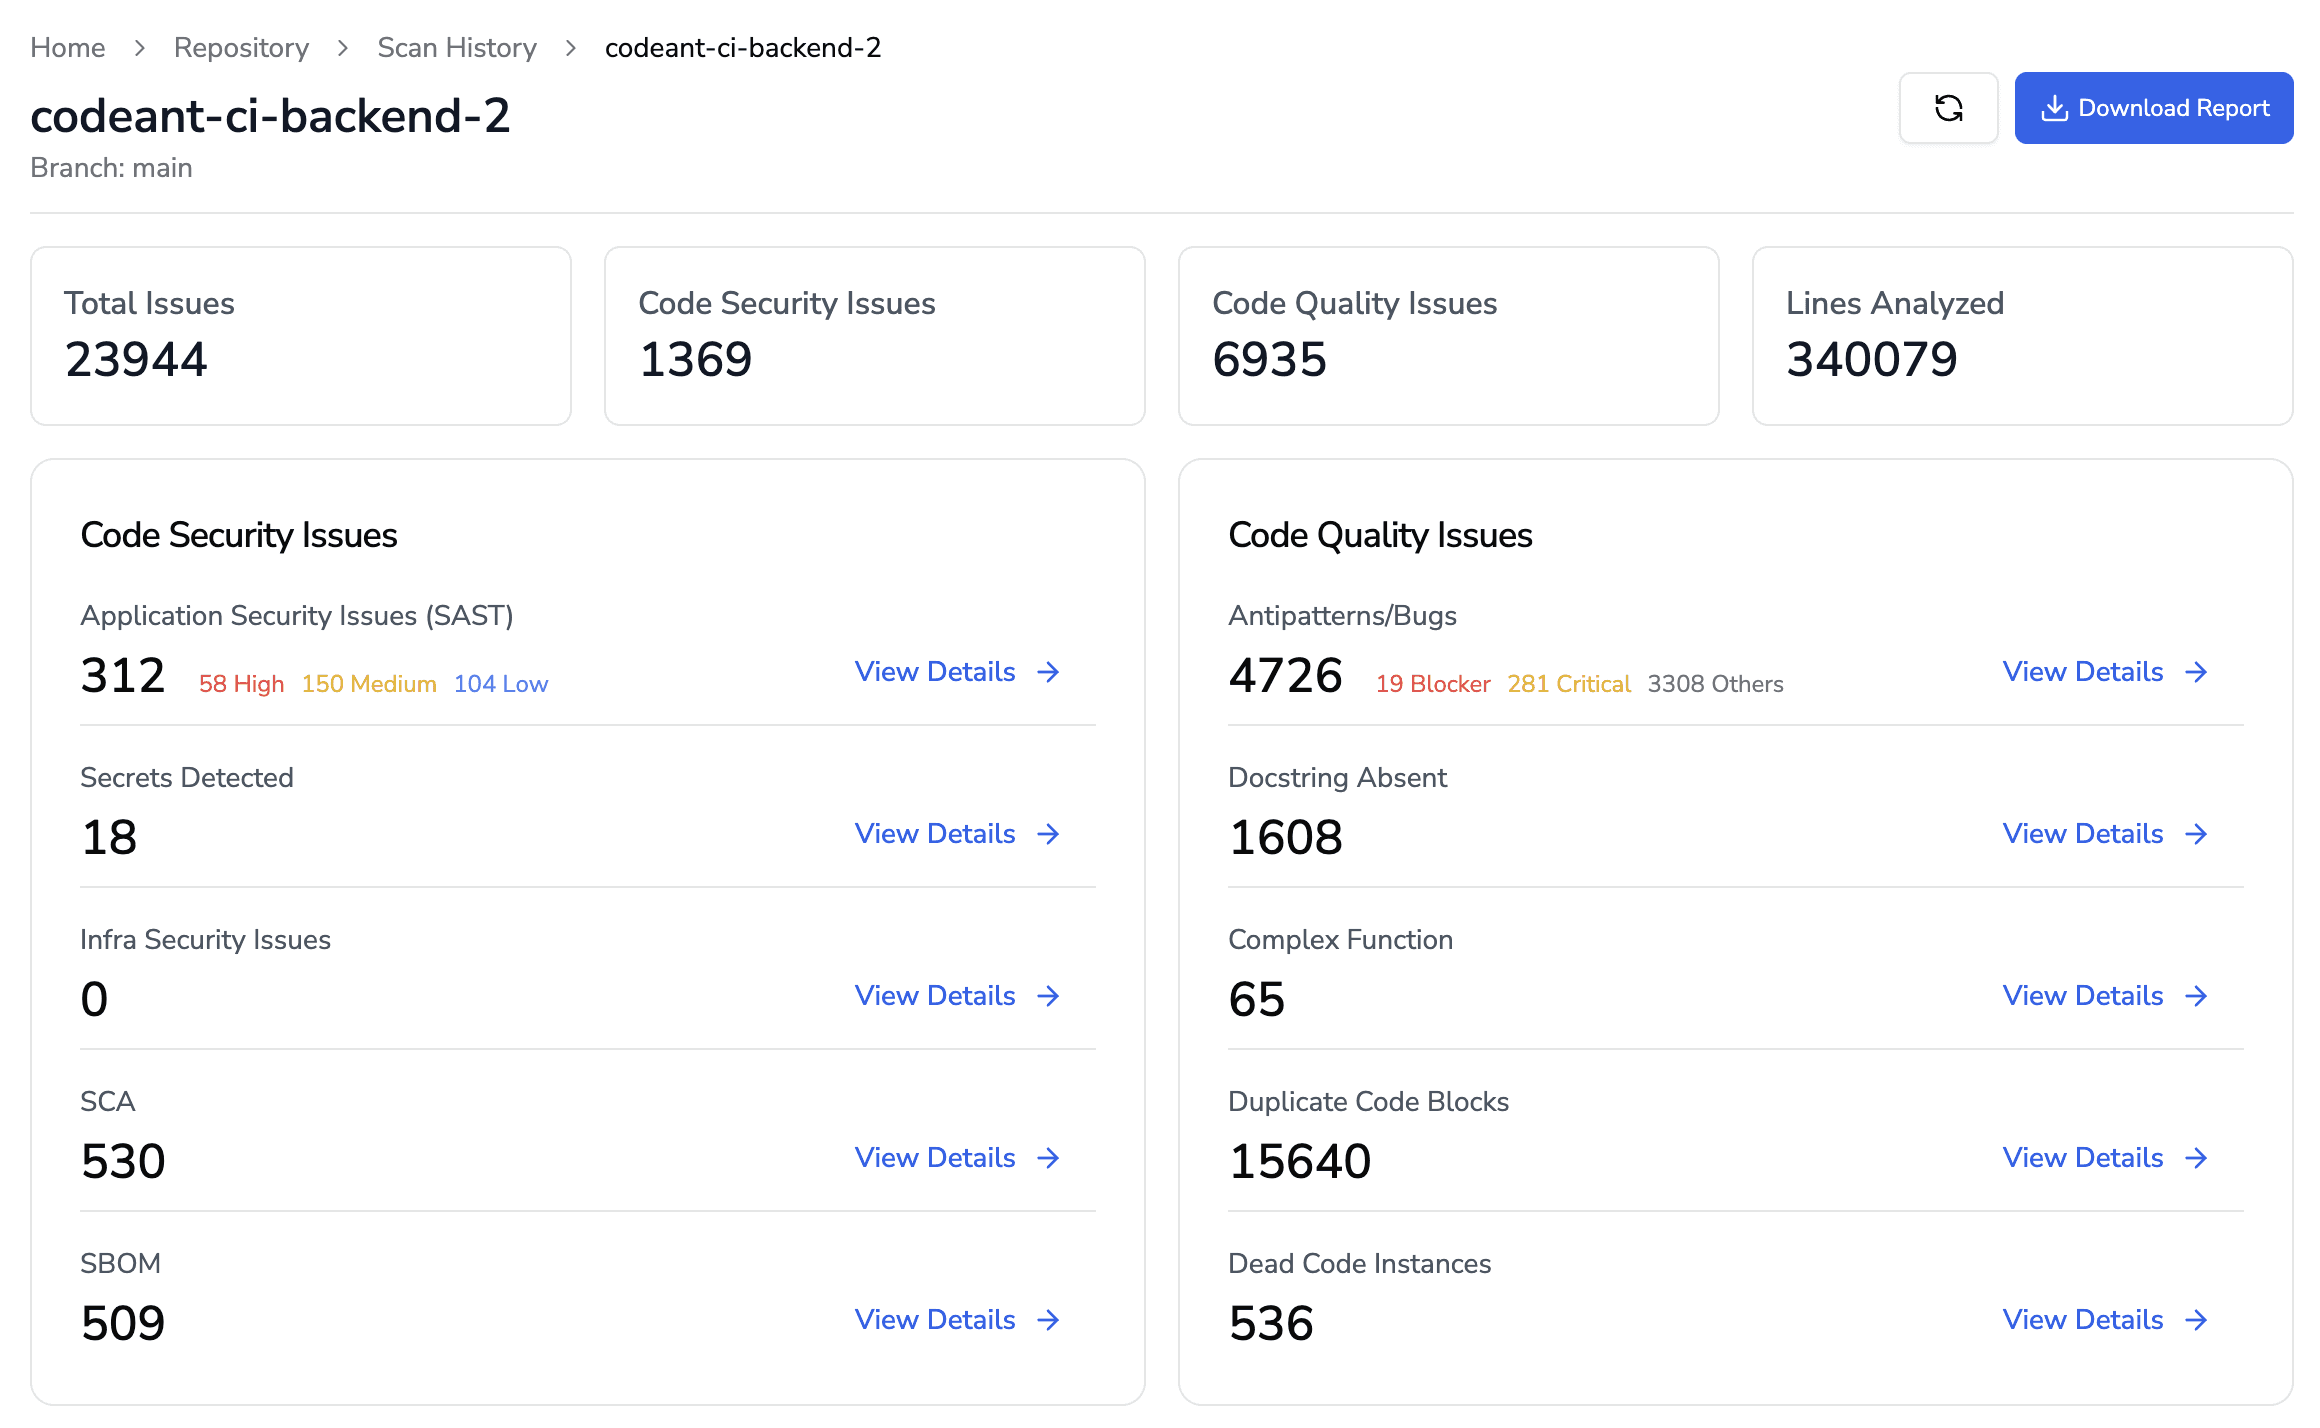
Real-time Code Scanning
CodeAnt AI automatically scans every commit and pull request to detect:
Dead or unused code
Code duplication
Anti-patterns
Security gaps
It also provides one-click, context-aware fixes, keeping metrics like complexity and duplication continuously updated without manual effort.
Check out:
9 Tools to Measure Technical Debt
Commit-level Insights
Instead of surface-level dashboards, CodeAnt AI provides granular visibility. CodeAnt AI breaks down metrics by commit, showing commit sizes, test coverage changes, and flags any coverage regressions. Engineering leads can see if a particular change made complexity spike or coverage dip.
Pull Request Analytics
In addition to static analysis, CodeAnt AI tracks PR cycle metrics. It measures Time to First Review and Time to Merge (TTFR, TTM) and the number of review cycles. If PRs are stuck or bouncing between reviewers, managers are alerted via dashboards, making it clear where process debt is building.
DORA Integration
CodeAnt AI natively computes DORA metrics across all repositories. Leaders get a unified view of deployment frequency, lead time, change fail rate, and MTTR alongside code health metrics. In practice, teams using CodeAnt AI see how, for instance, reduced complexity in a service correlates with faster deployment times.
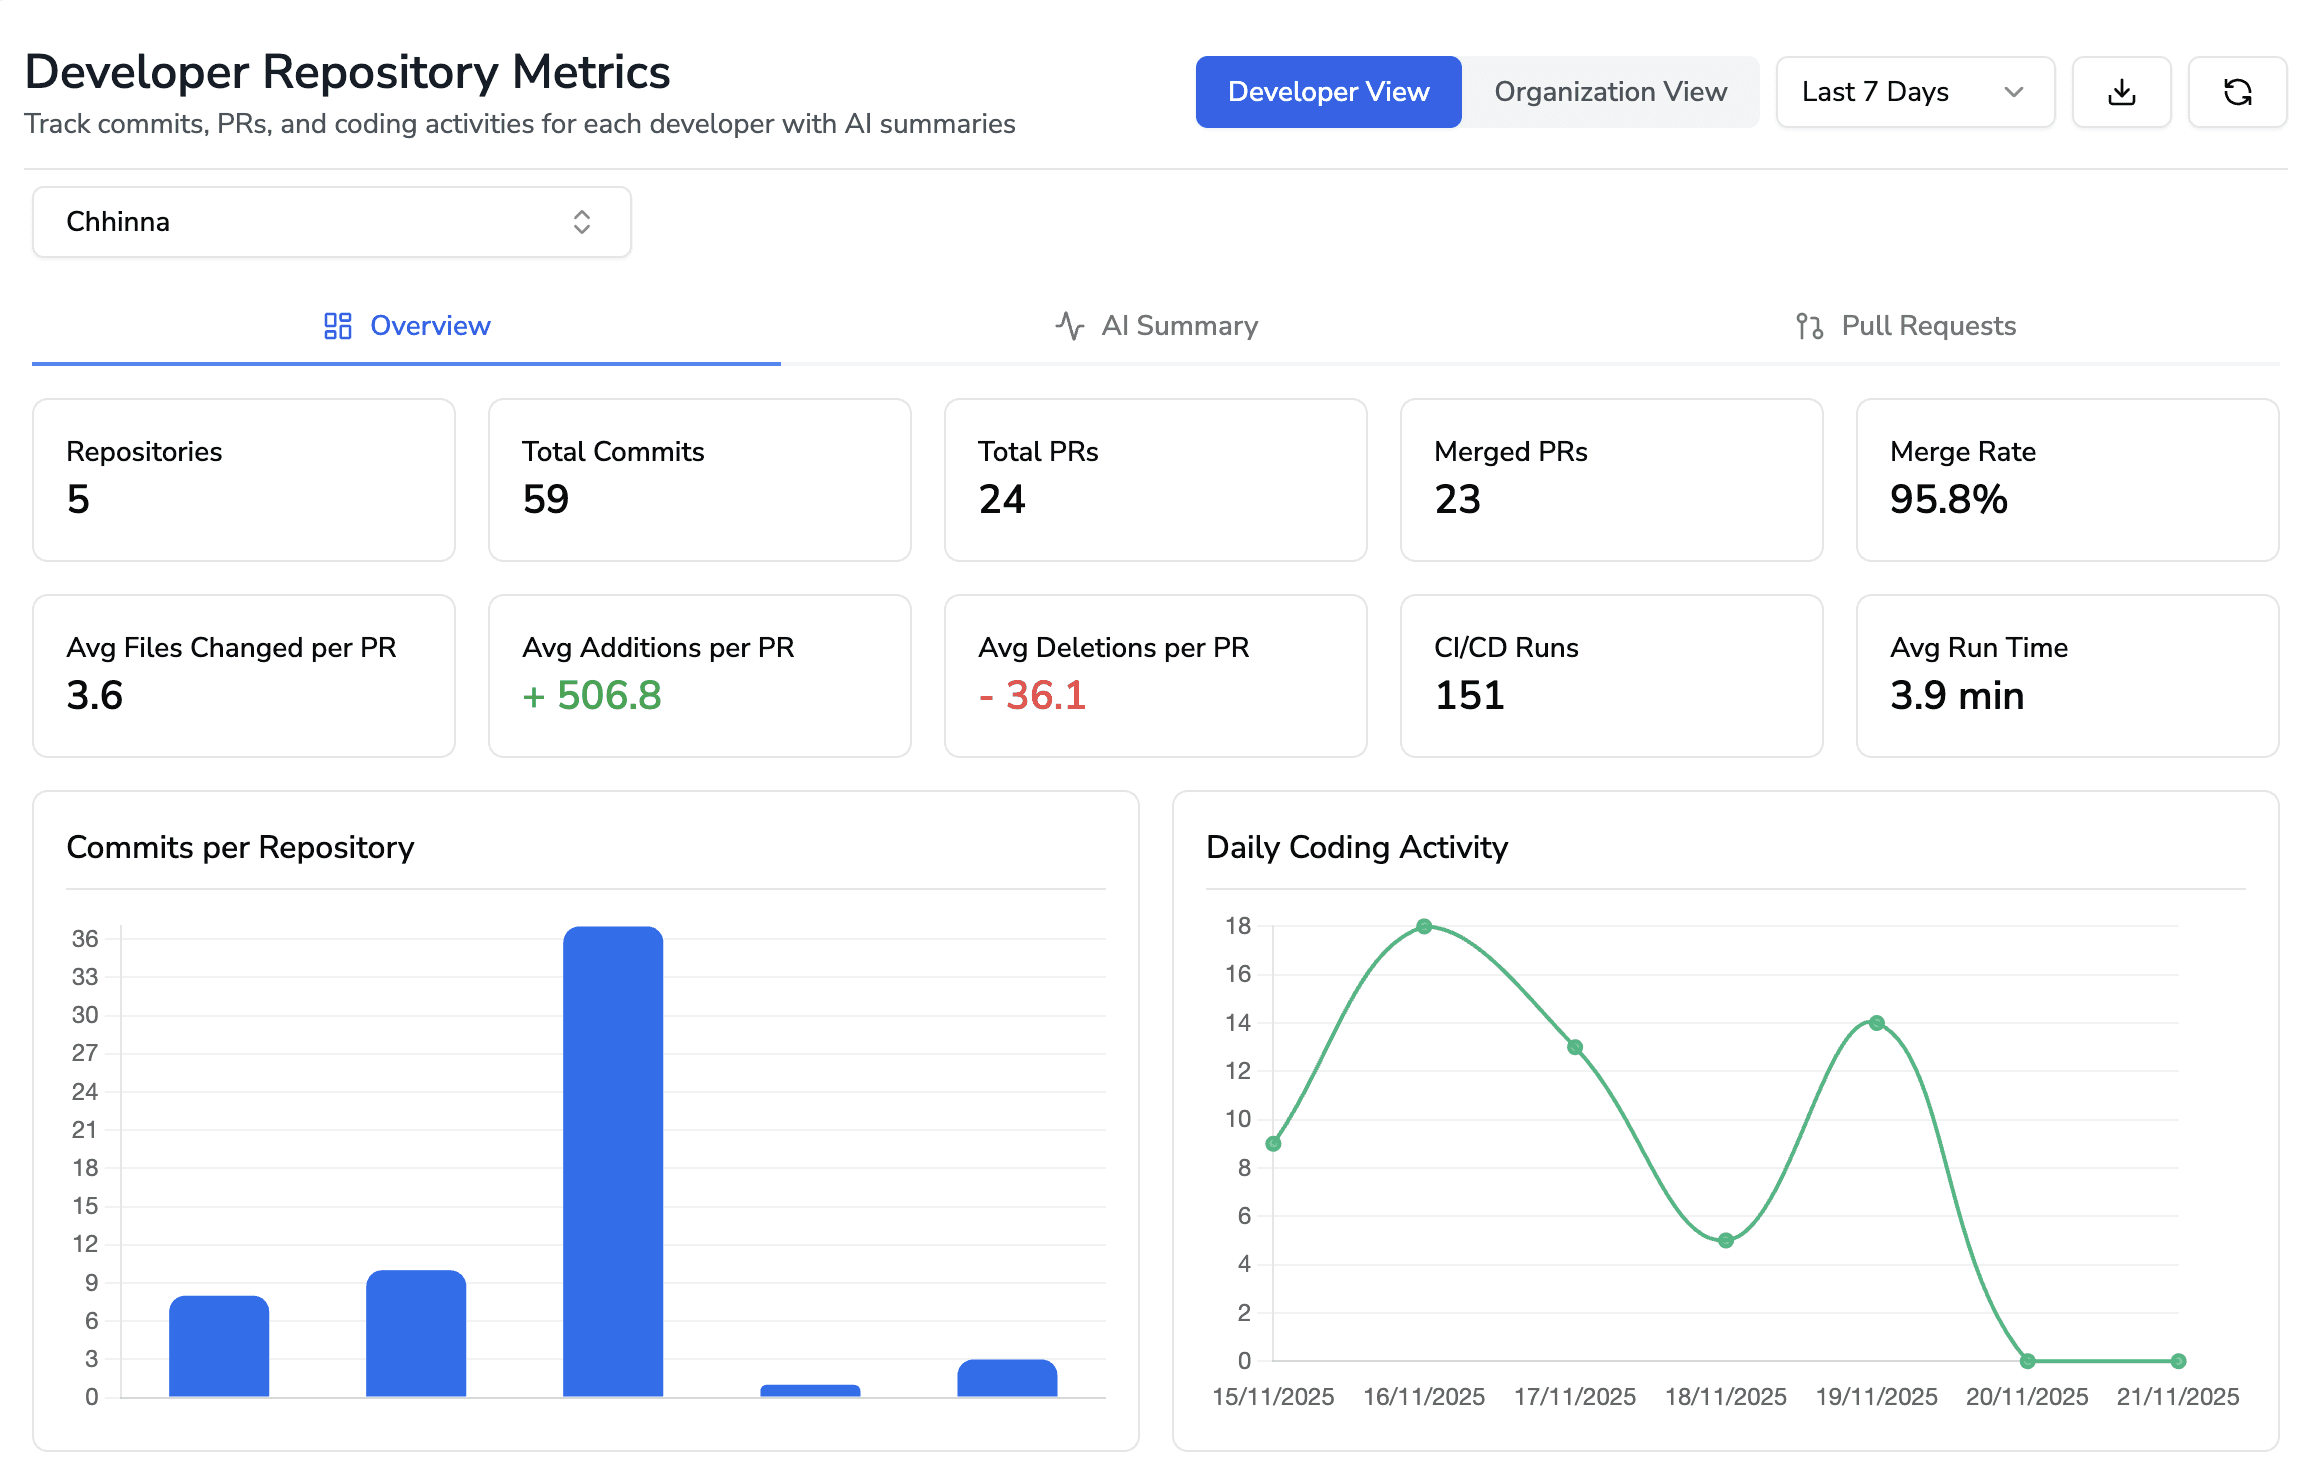
Developer 360
CodeAnt.ai’s Developer 360 aggregates metrics like commit volume, review velocity, and team workload. This helps spot team-level debt: e.g. if one team’s PR cycle is much slower than peers (a potential process debt issue), or if a specialist’s departure would create an ownership gap.
Under the hood, CodeAnt AI applies AI/ML to convert raw data into:
Code quality scores
Risk assessments
Debt indices
It tracks a “debt curve” over time so teams can:
See the impact of refactoring
Measure risk reduction
Prove ROI from debt work
Advanced detection includes:
Secret exposure
Insecure patterns
Risky dependency usage
These surface deliberate and reckless debt before incidents occur.
A Single Source of Truth for Technical Debt
CodeAnt becomes a single pane of glass for technical debt management.
Leaders can:
Start at high-level indicators (e.g., highest-debt repositories)
Drill down into:
Specific pull requests
Commits
Files
Teams
Most importantly, CodeAnt AI ties debt to the metrics leadership actually cares about. This removes the need for:
Manual audits
Spreadsheet tracking
Disconnected tools
Conclusion: Turn Technical Debt into Measurable Engineering Advantage
Technical debt isn’t something teams “fix once” and move on from. It’s an ongoing discipline that requires continuous visibility, consistent measurement, and deliberate action. When engineering leaders track code, architecture, process, and team metrics, they stop guessing and start making data-driven decisions about what to fix, when to refactor, and where risk is actually growing.
The most effective teams don’t just ship faster, they ship smarter. By treating technical debt as a measurable engineering and business problem, teams reduce wasted developer time, lower delivery risk, and build systems that are easier to scale and extend over time.
Tools like CodeAnt AI make this practical by combining real-time code quality analysis, DORA metrics, PR workflow visibility, and developer productivity insights in one platform. Instead of scattered tools and manual audits, leaders get a single, clear view of where debt lives and how it affects delivery outcomes. Wanna know more, try our 14-day free trial TODAY!!
FAQs
What are technical debt metrics?
Why is measuring technical debt important?
What are the most important metrics to track technical debt?
How do technical debt metrics impact business outcomes?
How can engineering teams reduce technical debt using metrics?


