Code Quality
What Are the 7 Axes of Code Quality?

Sonali Sood

Founding GTM, CodeAnt AI
A 2025 framework for engineering leaders who want speed and quality.
Shipping fast with quality code is no longer optional. Investors, customers, and risk teams now expect clean code that’s secure, reliable, and operable in production, without slowing delivery. Leaders who only watch velocity dashboards miss the silent drag: code quality debt. It shows up as sluggish PRs, brittle components, surprise incidents, excess cloud bills, and creeping review fatigue.
The fix isn’t a single “code quality tool.” It’s a measurement-first framework that connects software quality metrics to your business KPIs (release frequency, change failure rate, time-to-restore).
To make that mindset operational, use the 7 Axes of Code Quality outlined below. Each axis defines:
What it measures
Why it matters
Key metrics and thresholds
How to measure in practice
How to improve quality with repeatable playbooks
We’ll align each dimension with recognized standards (ISO/IEC 25010 family) and current 2024-2025 guidance from OWASP and NIST, so your code quality strategy maps cleanly to global engineering benchmarks.
You can also check out more on: State of AI-assisted Software Development Report
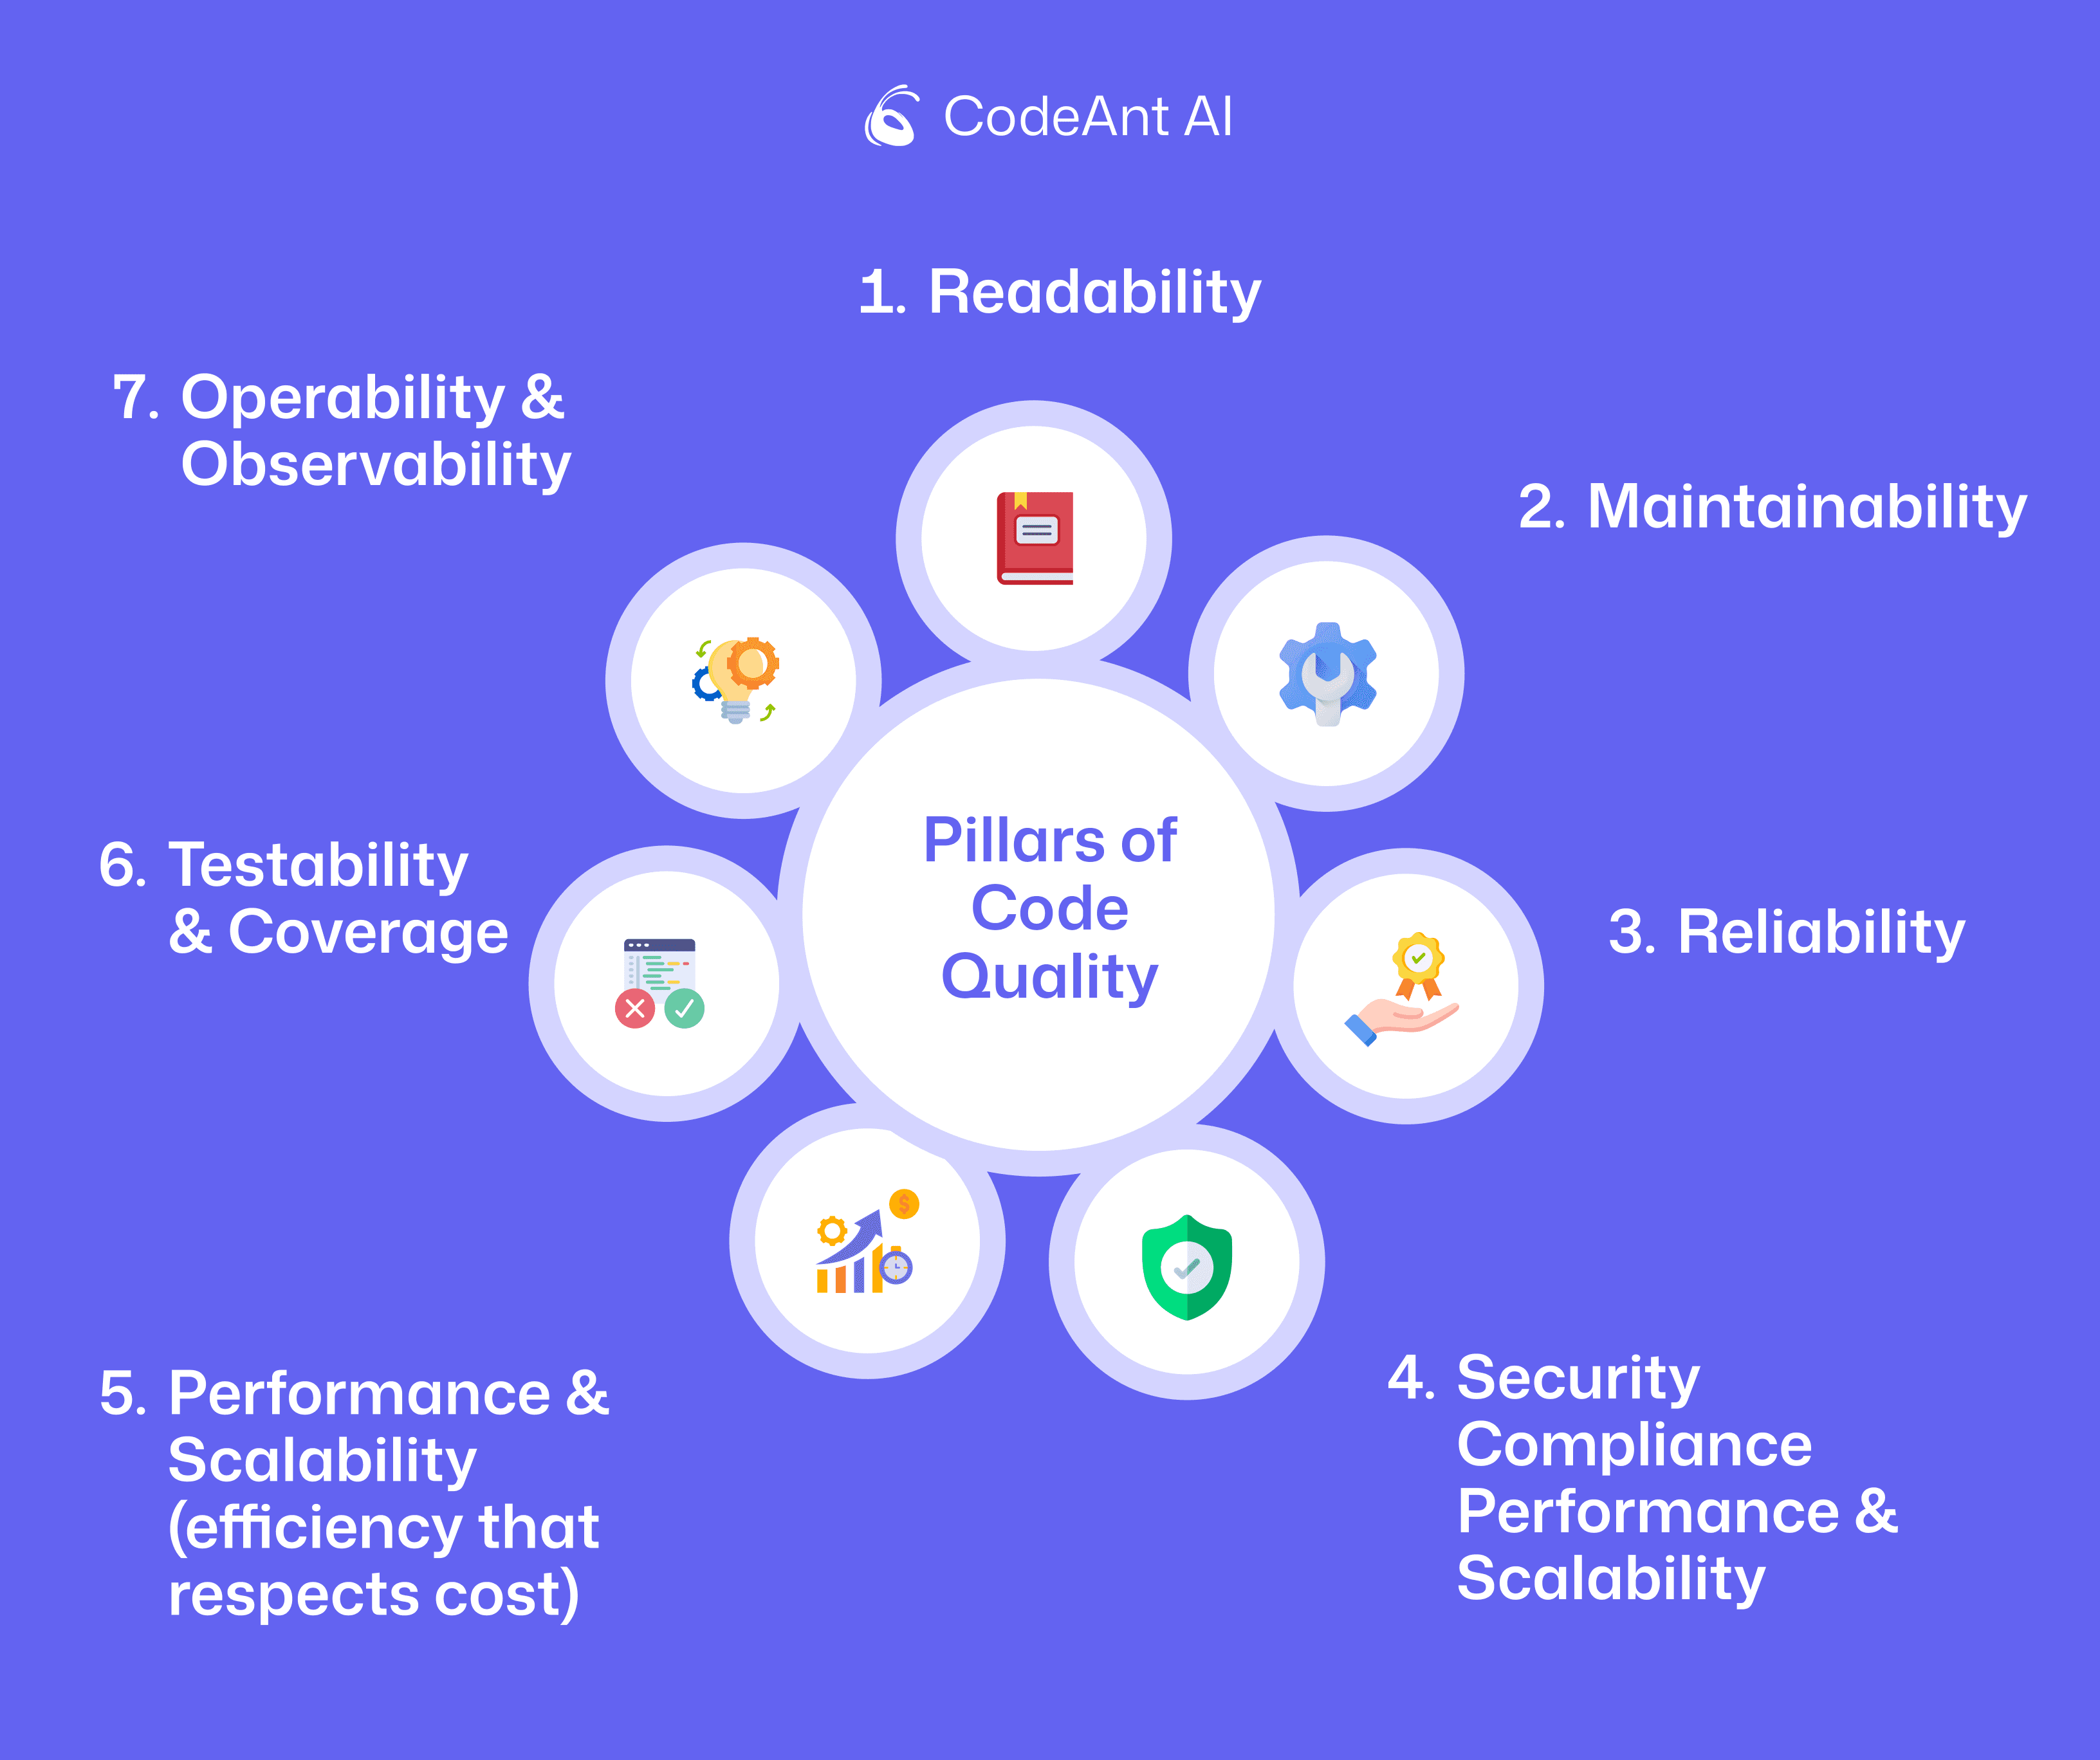
The 7 Axes of Code Quality
At a glance:
Readability
Maintainability
Reliability
Security & Compliance
Performance & Scalability
Testability & Coverage
Operability & Observability
These seven axes align with modern quality models (e.g., ISO/IEC 25010 product quality characteristics and 25002 measurement guidance) and with delivery performance views (DORA/SPACE). They give you a complete map from code metrics to quality metrics for software outcomes.
Axis 1: Readability (make the code easy to understand)
Why it matters: If engineers can’t quickly read code, they can’t safely change it. Readability drives faster PR reviews, fewer coding violations, and higher developer throughput.
Core code metrics (examples):
Cognitive Complexity (per function/module): keep < 15 for most functions; outliers trigger refactor.
Comment Density (helpful, not noisy): aim for intent-level docs and public API docs.
Naming Consistency / Lint violations (from code quality tools like CodeAnt.ai): target a declining trend in naming/formatting violations sprint over sprint.
How to measure code quality here:
Enforce style via linters/formatters pre-PR; block on high-severity readability coding violations.
Track “time to first meaningful review comment” and “reviewer reread count” as qualitative signals.
Use code quality audit snapshots monthly to trend readability violations.
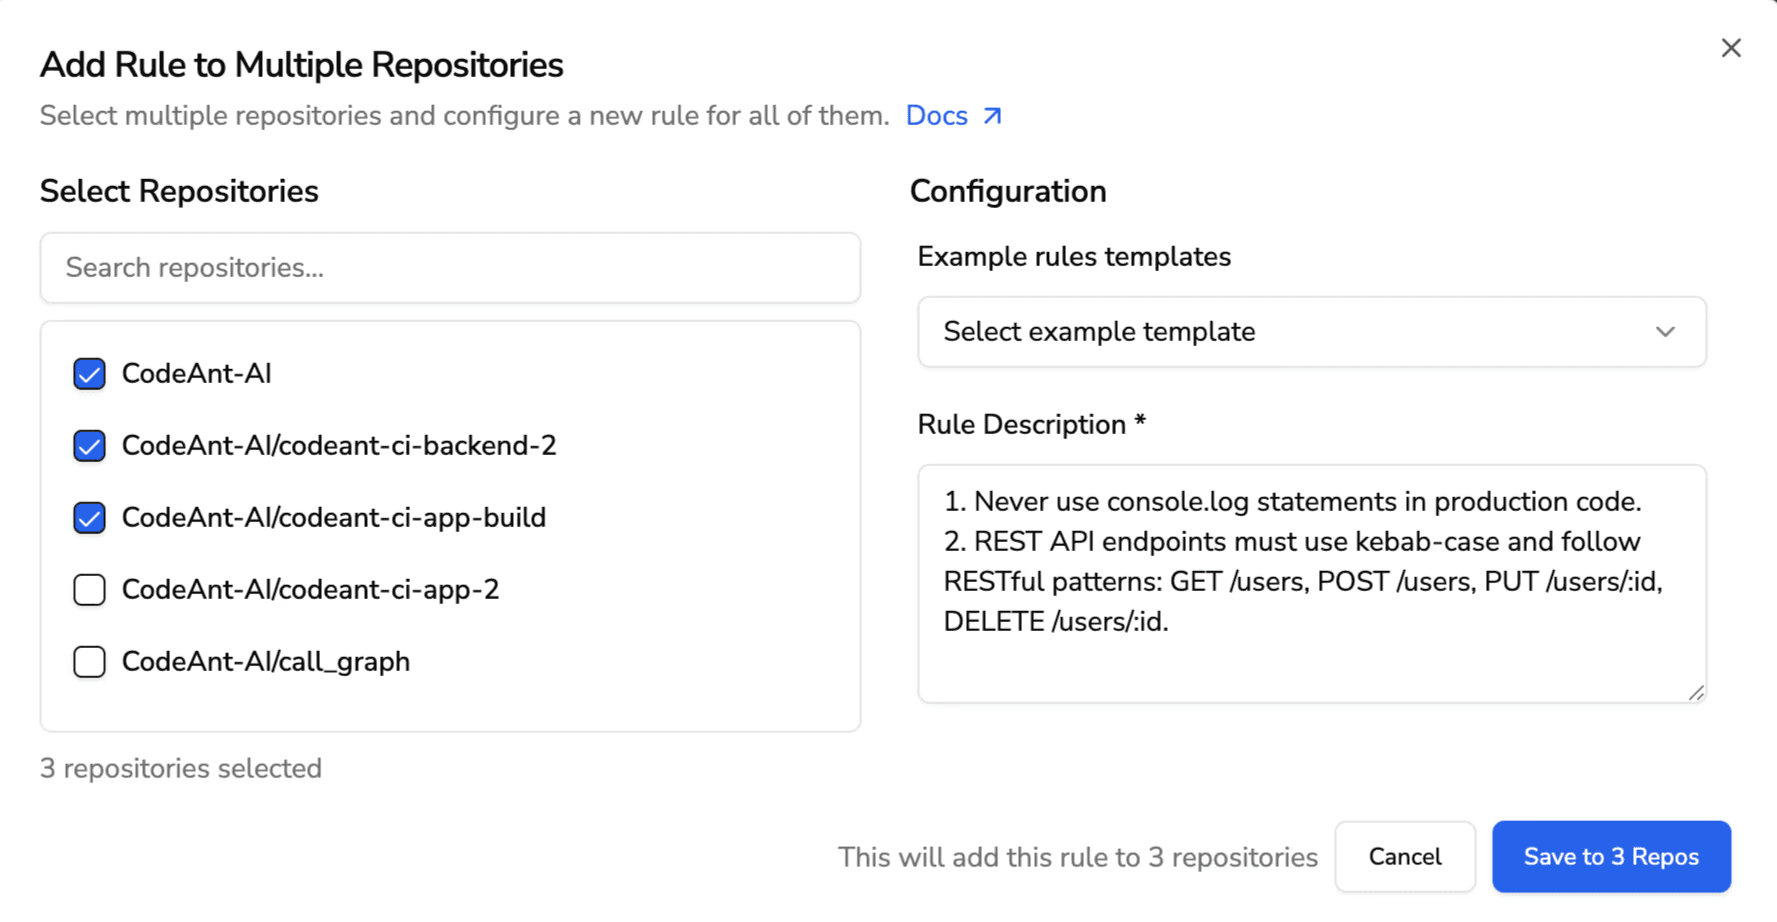
Here’s how automated antipattern checks and multi-repo rule enforcement surface risky logic early and standardize coding practices across teams:
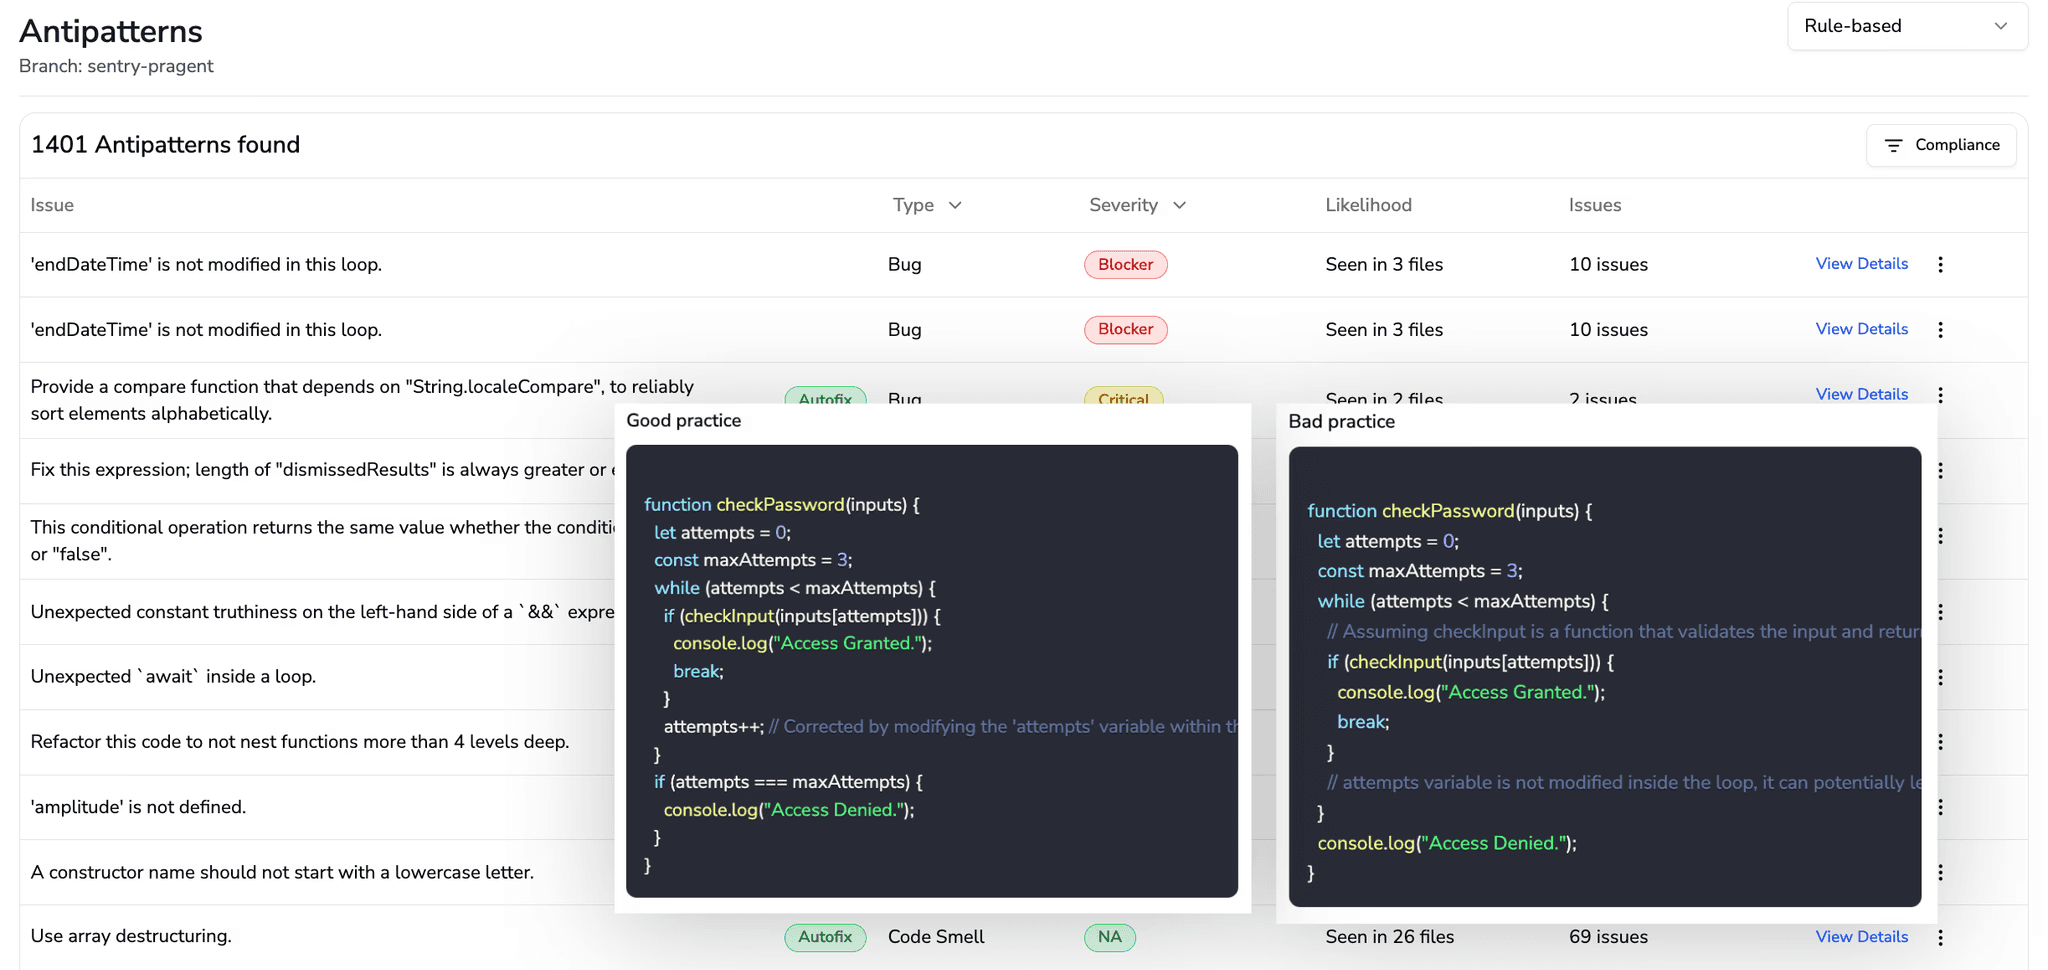
Catching logic flaws and enforcing rules consistently is how you stop subtle defects from multiplying across services.
Structured documentation checks and dead-code analysis reduce cognitive load and maintain clarity as systems grow.
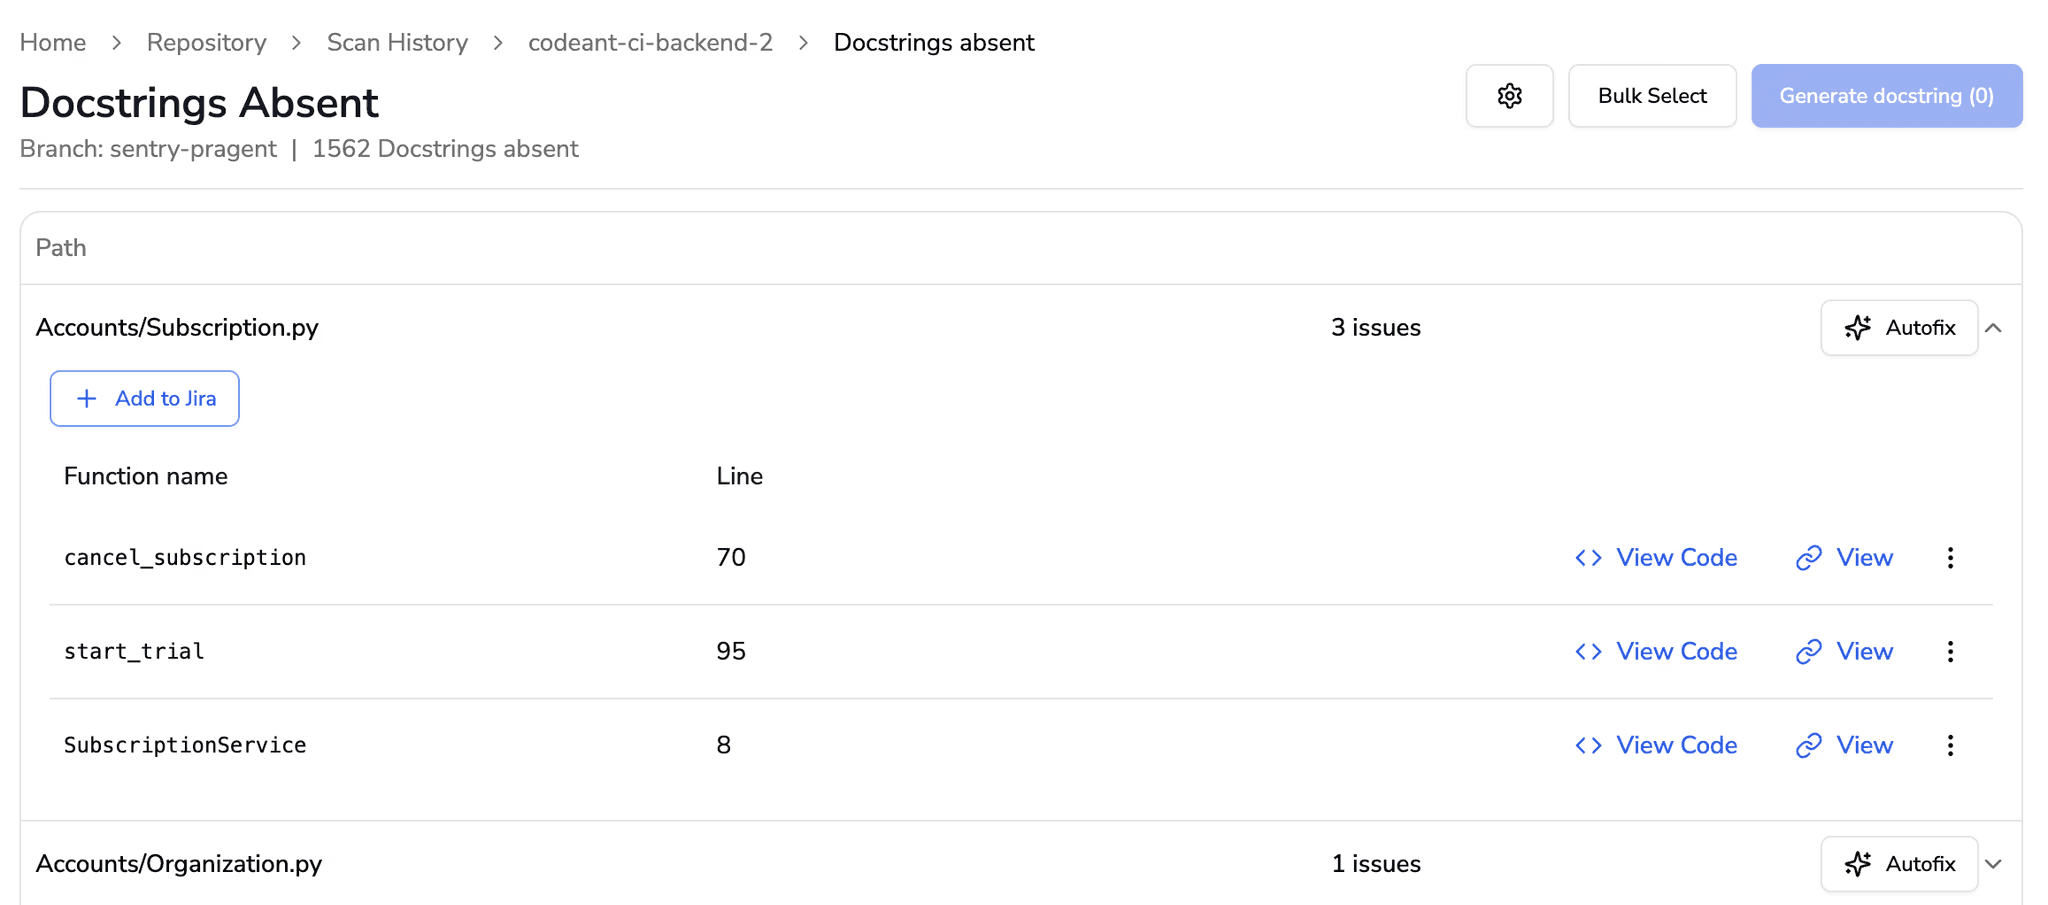
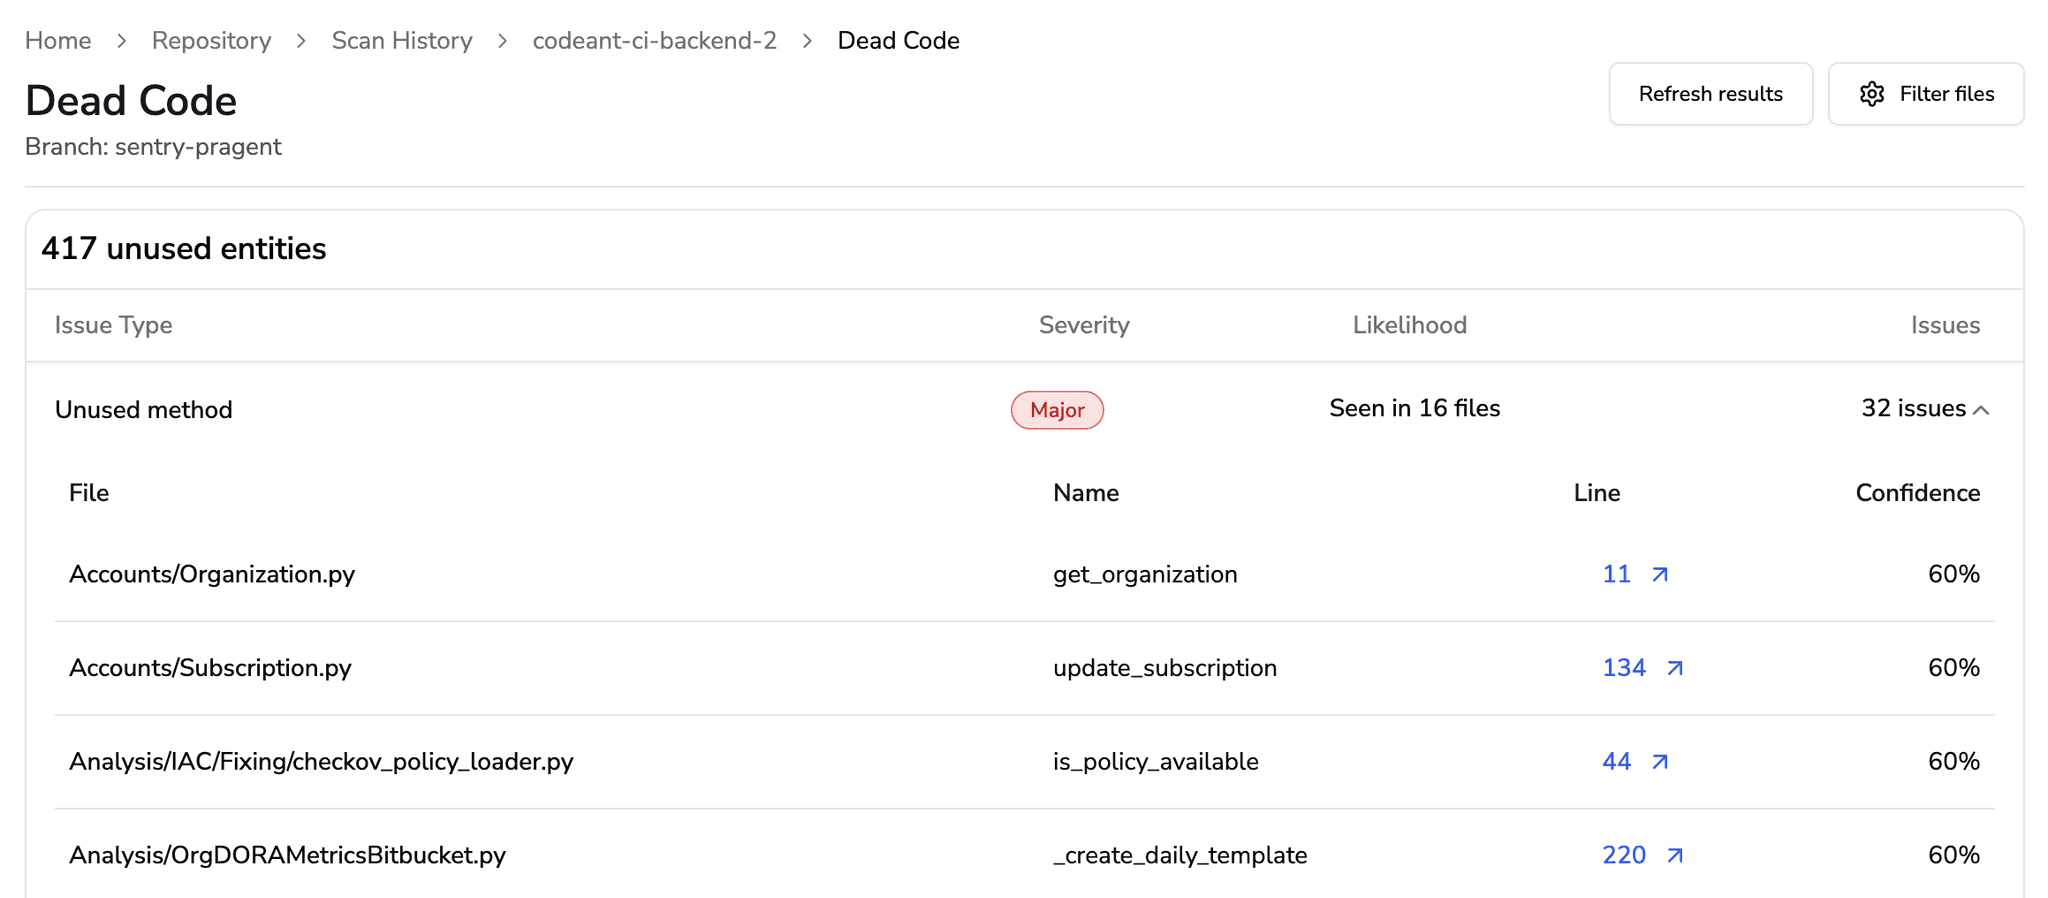
Removing stale or dead code and enforcing doc clarity keeps the codebase readable and predictable for every contributor.
Outcome link: Readable code reduces review time (supports DORA lead time) and lowers defects introduced by misread logic.
Axis 2: Maintainability (optimize for safe change over time)
Why it matters: Maintainability is the cumulative friction your team pays when changing the system. Poor scores silently tax every sprint.
Core code metrics:
Maintainability Index (MI): composite of cyclomatic complexity, LOC, Halstead; used to flag modules for refactoring.
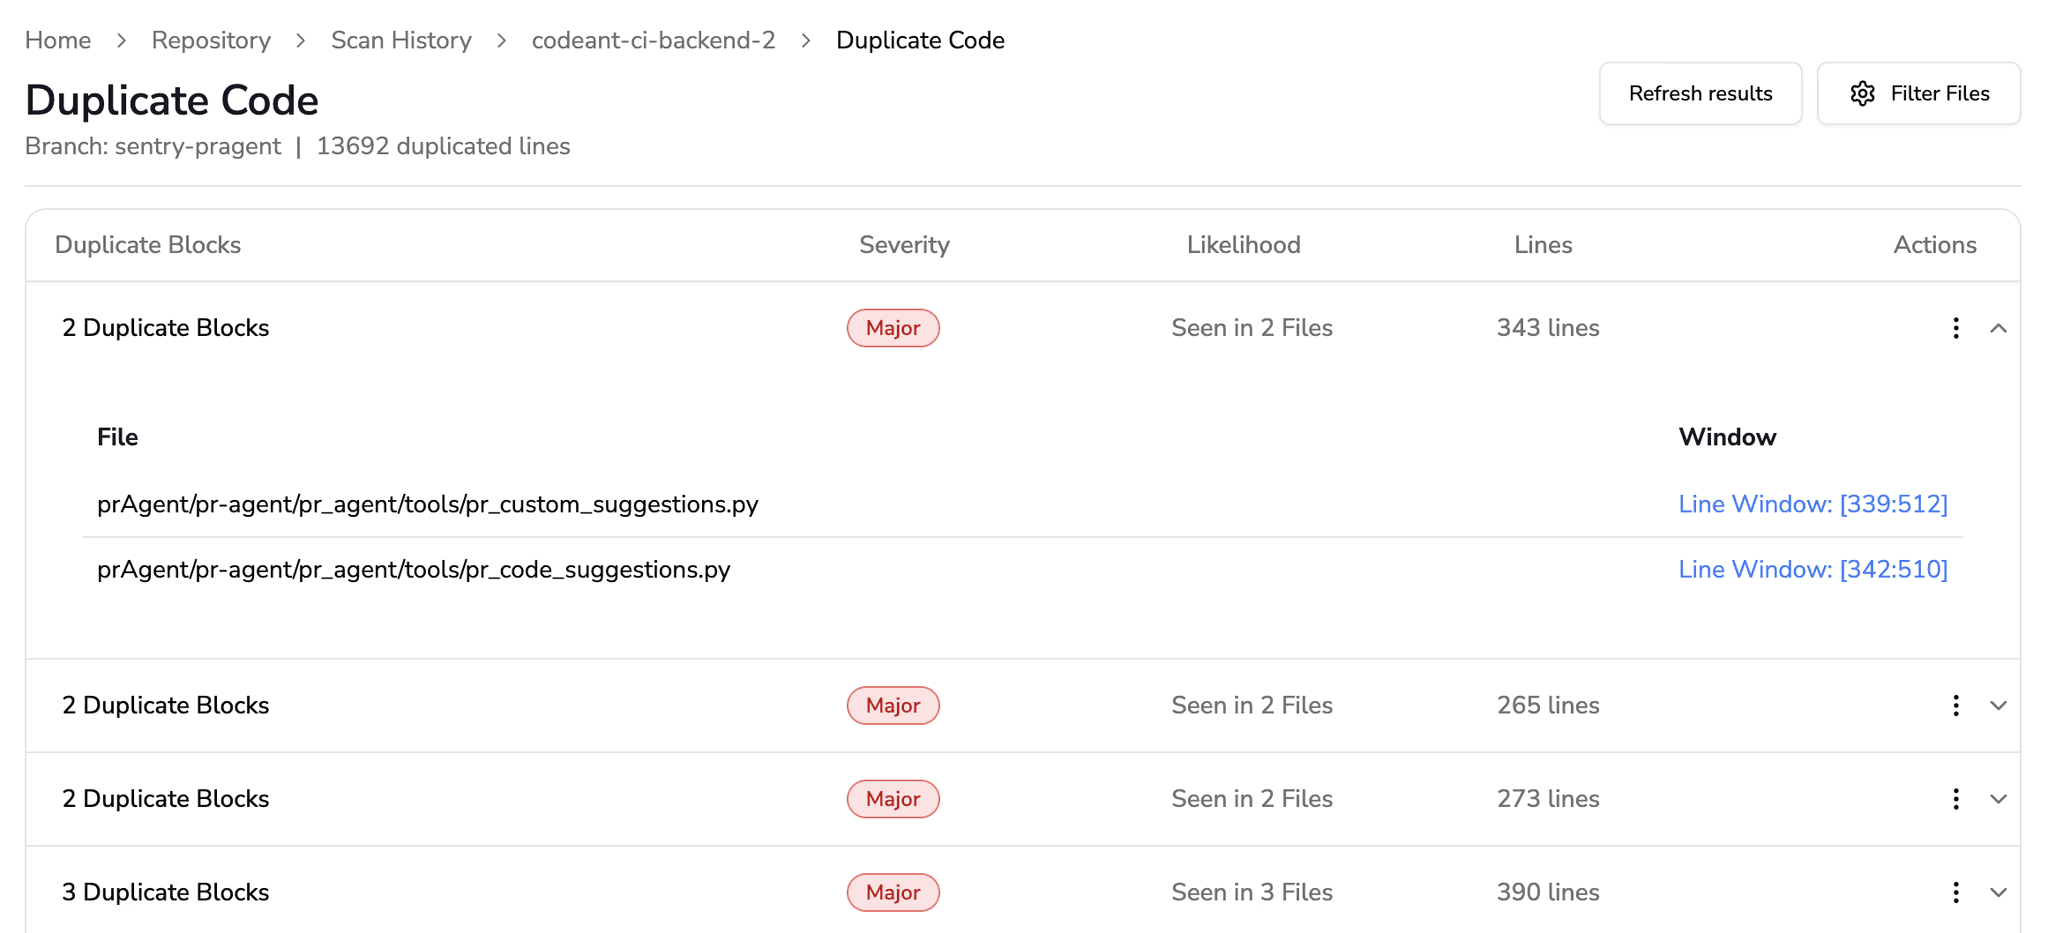
Duplication %: aim to keep < 5–10% in critical modules.
Code Churn: high churn + high complexity = refactor candidate.
Module Coupling / Instability: prefer low coupling, high cohesion.
How to measure:
Weekly report: top 10 worst MI deltas; trend code metrics over time.
“Refactor before feature” policy if MI/duplication breaches a threshold.
Tie maintainability deltas to PR size and review latency.
Standards & context: ISO/IEC 25010 calls out maintainability; 25002 provides measurement guidance to define and aggregate indicators for quality models.
Use CodeAnt AI for continuous scanning + PR-level suggestions where you can protect every repo, branch, and commit against leaked API keys, tokens, high entropy strings, and credentials. Check out the product here: https://www.codeant.ai/code-security/secret-scanning
Axis 3: Reliability (reduce production defects and failure risk)
Why it matters: If the code behaves unpredictably in real conditions, you’ll pay in incidents, hotfixes, and lose trust.
Core code quality metrics:
Defect Density = Defects / KLOC (track by severity).
Change Failure Rate (CFR): % of deployments causing incidents (a DORA “four keys” metric).
Mean Time to Recovery (MTTR): median time to restore service.
Escaped Defects: bugs found post-release.
How to measure:
Quality gates: block merges when Escaped Defects trend ↑ or CFR exceeds policy.
Mutation testing score on critical modules (see Axis 6).
Error budgets (SLOs) tied to reliability KPIs; review in ops retros.
Reference: DORA’s delivery metrics (CFR, MTTR) remain the industry-standard link between code quality measurement and delivery performance.
Axis 4: Security & Compliance (build in protection and proof)
Why it matters: Security mistakes are the costliest quality failures. Modern guidance (NIST, OWASP) emphasizes shifting left, catching issues in code review before they reach prod.
Core code quality metrics:
Vulnerability Density (open vulns / KLOC), grouped by severity (CVSS).
Mean Time to Remediate (MTTR-V) for high/critical vulns.
Secrets / Misconfig Violations per PR.
Standards coverage (e.g., % of rules from SSDF or OWASP modeled as policy-as-code).
How to measure:
SAST/secret scan on every PR; block on high-risk findings.
Monthly code quality audit: top risky modules, time-to-fix trends.
AI-specific secure-dev practices if you build with/for models (NIST 800-218A extends SSDF with guidance for AI systems).
Use tools like CodeAnt AI (unified quality+security gates) with SOC2/ISO 27001/CIS-aligned controls. Check out the platform here: https://www.codeant.ai/
Axis 5: Performance & Scalability (efficiency that respects cost)
Why it matters: Inefficient code inflates cloud spend and hurts UX; scale issues create reliability incidents.
Core metrics:
p95/p99 latency by endpoint/use case; Throughput under baseline and peak loads.
Resource per transaction (CPU-ms, MB, I/O ops); GC pause time.
Hotspot complexity: complexity × change frequency (predicts perf regressions).
How to measure:
Add performance checks to CI (fail PR if p95 grows > X% on critical path).
Profile new code paths; flag nested loops/poor allocations.
Tie perf regressions to business KPIs (conversion, retention, SLA penalties).
Axis 6: Testability & Coverage (proof beats opinion)
Why it matters: Without tests you’re guessing. Testability measures how easily code can be validated; higher testability → faster, safer change.
Core metrics & formulas:
Branch / Statement Coverage (thresholds by criticality; e.g., ≥80% on core modules, but avoid “coverage theater”).
Mutation Score = (Killed Mutations / Total Mutations) × 100, stronger signal than raw coverage.
Flake Rate: % of unstable tests (drag on velocity).
Test Cycle Time: time to execute impacted tests for a PR.
How to measure:
Mutation testing on critical packages; alert when score drops < threshold.
Keep PRs small; use test impact analysis to keep feedback fast.
Track “time to first failing test” as a PR-level quality signal.
Axis 7: Operability & Observability (make it supportable in the wild)
Why it matters: Operability closes the loop from code to customer. If teams can’t observe behavior or recover fast, quality fails where it matters most—production.
Core metrics:
MTTR (DORA key), Incident Count per service, Error Budget Burn.
Instrumentation Coverage (% of critical flows emitting traces, metrics, logs).
On-call toil (pages per engineer per week), Runbook freshness.
How to measure:
Define SLOs per service; set budget policy (slowdown/stop if budget burns too fast).
Embed golden signals (latency, traffic, errors, saturation) as acceptance criteria.
PR checks: “Does this change degrade observability?” (e.g., removes logging or breaks tracing).
How to Do Code Quality Measurement That Leaders Trust
To keep “quality” from becoming a vague aspiration, ground it in a quality model and a measurement plan:
1) Adopt a model
Use ISO/IEC 25010 (product quality) with 25002 (measurement guidance) to define characteristics, sub-characteristics, measures, and aggregation rules. Map our seven axes to these characteristics (e.g., maintainability, reliability, performance efficiency, security, usability/operability).
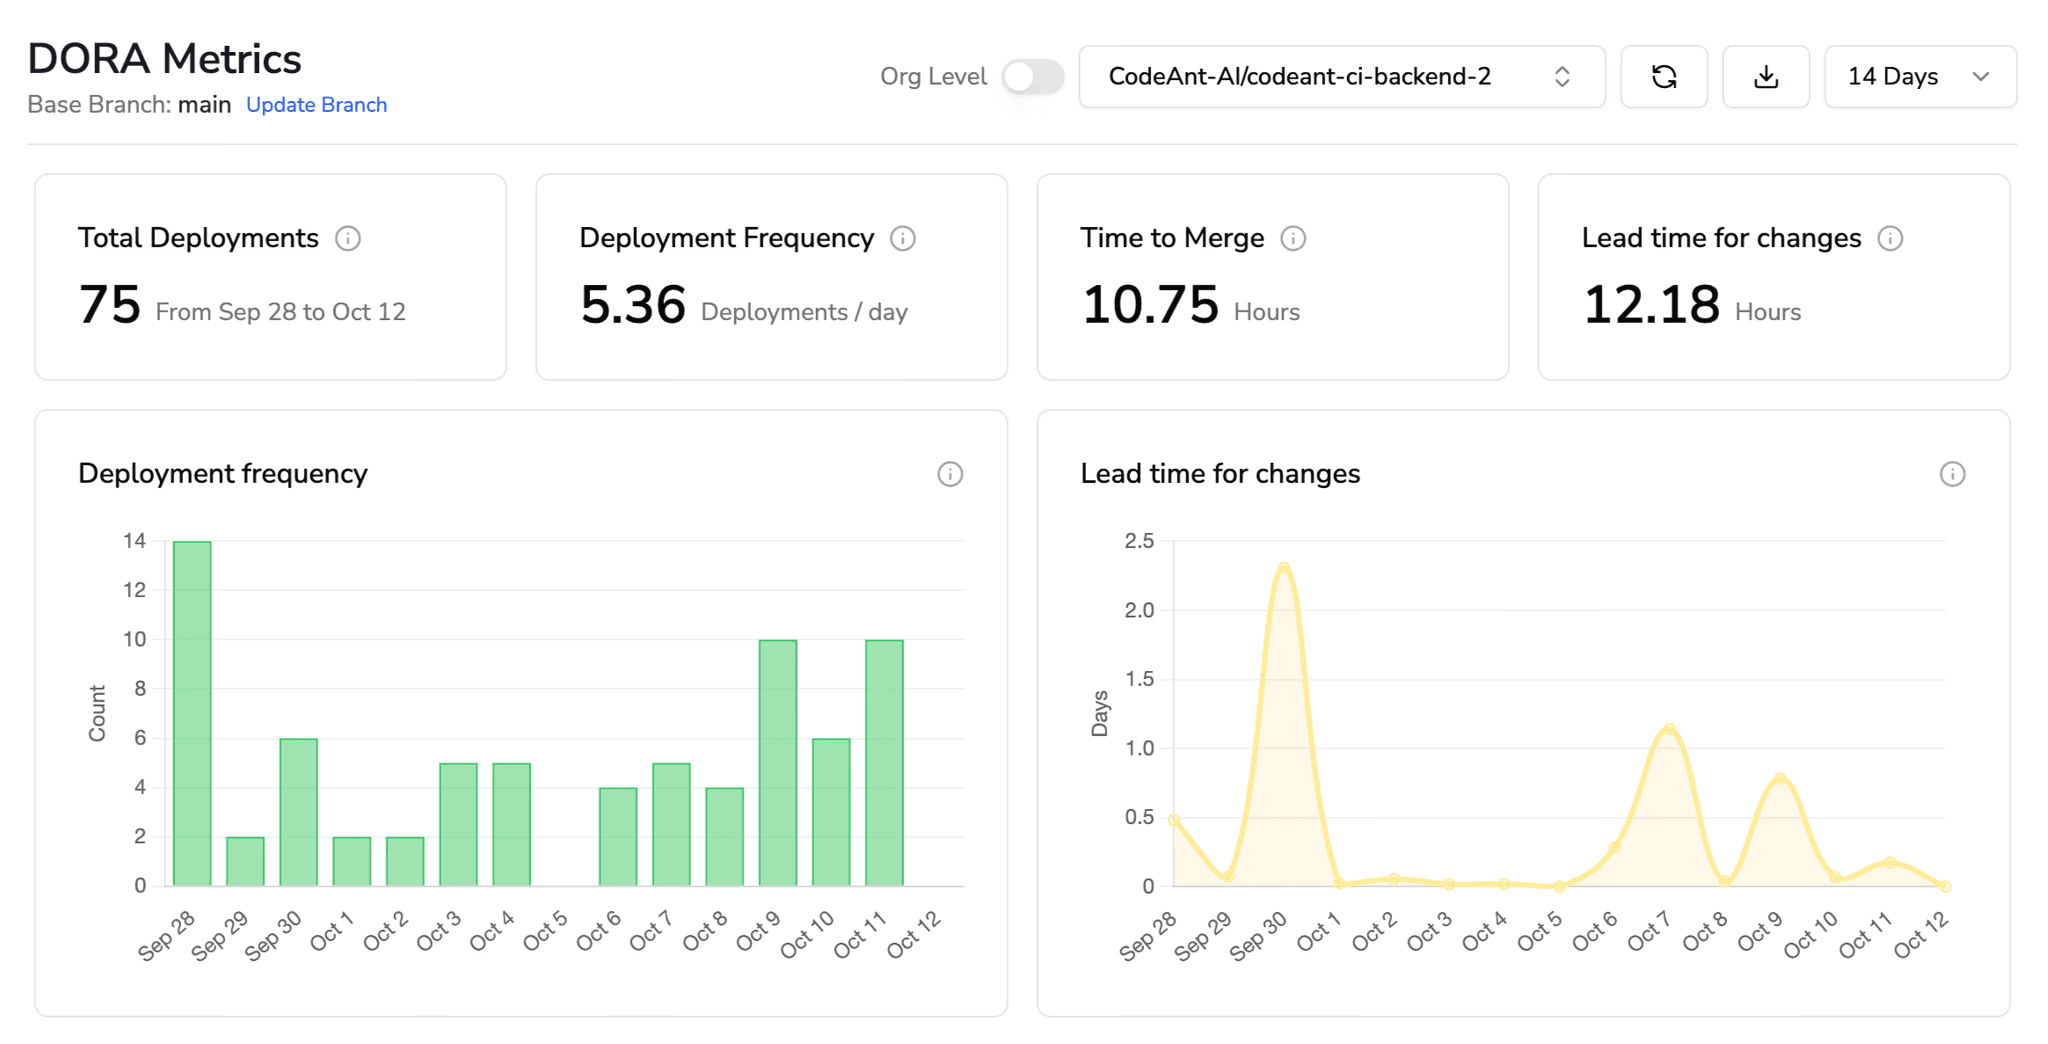
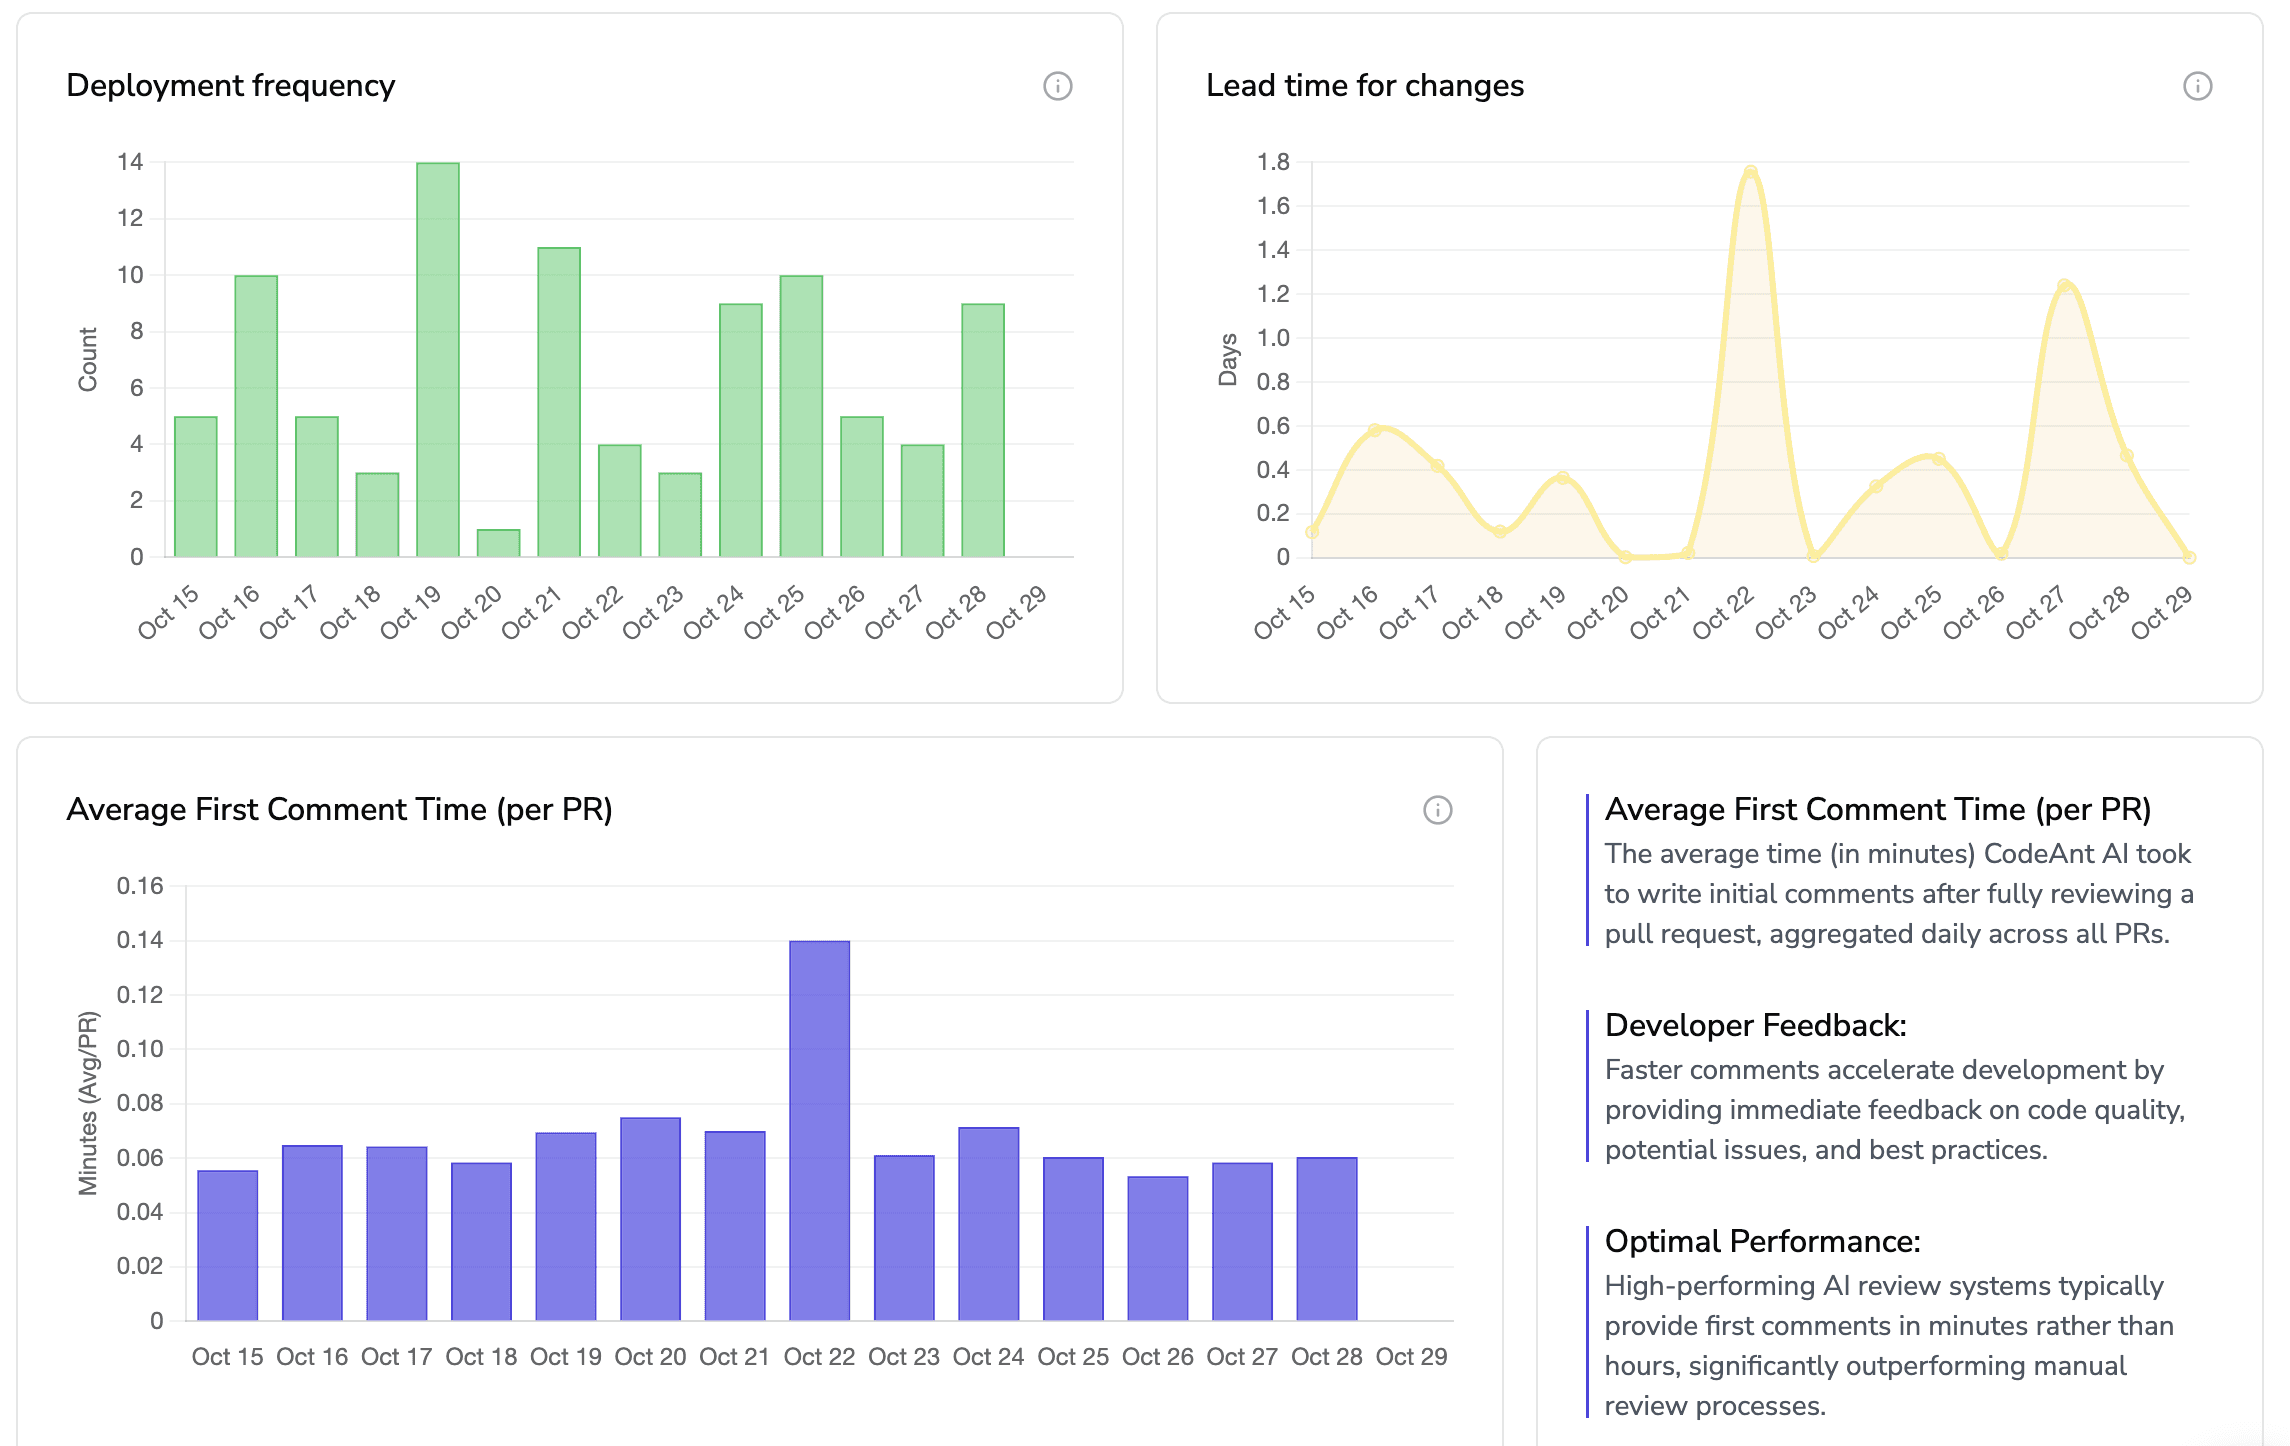
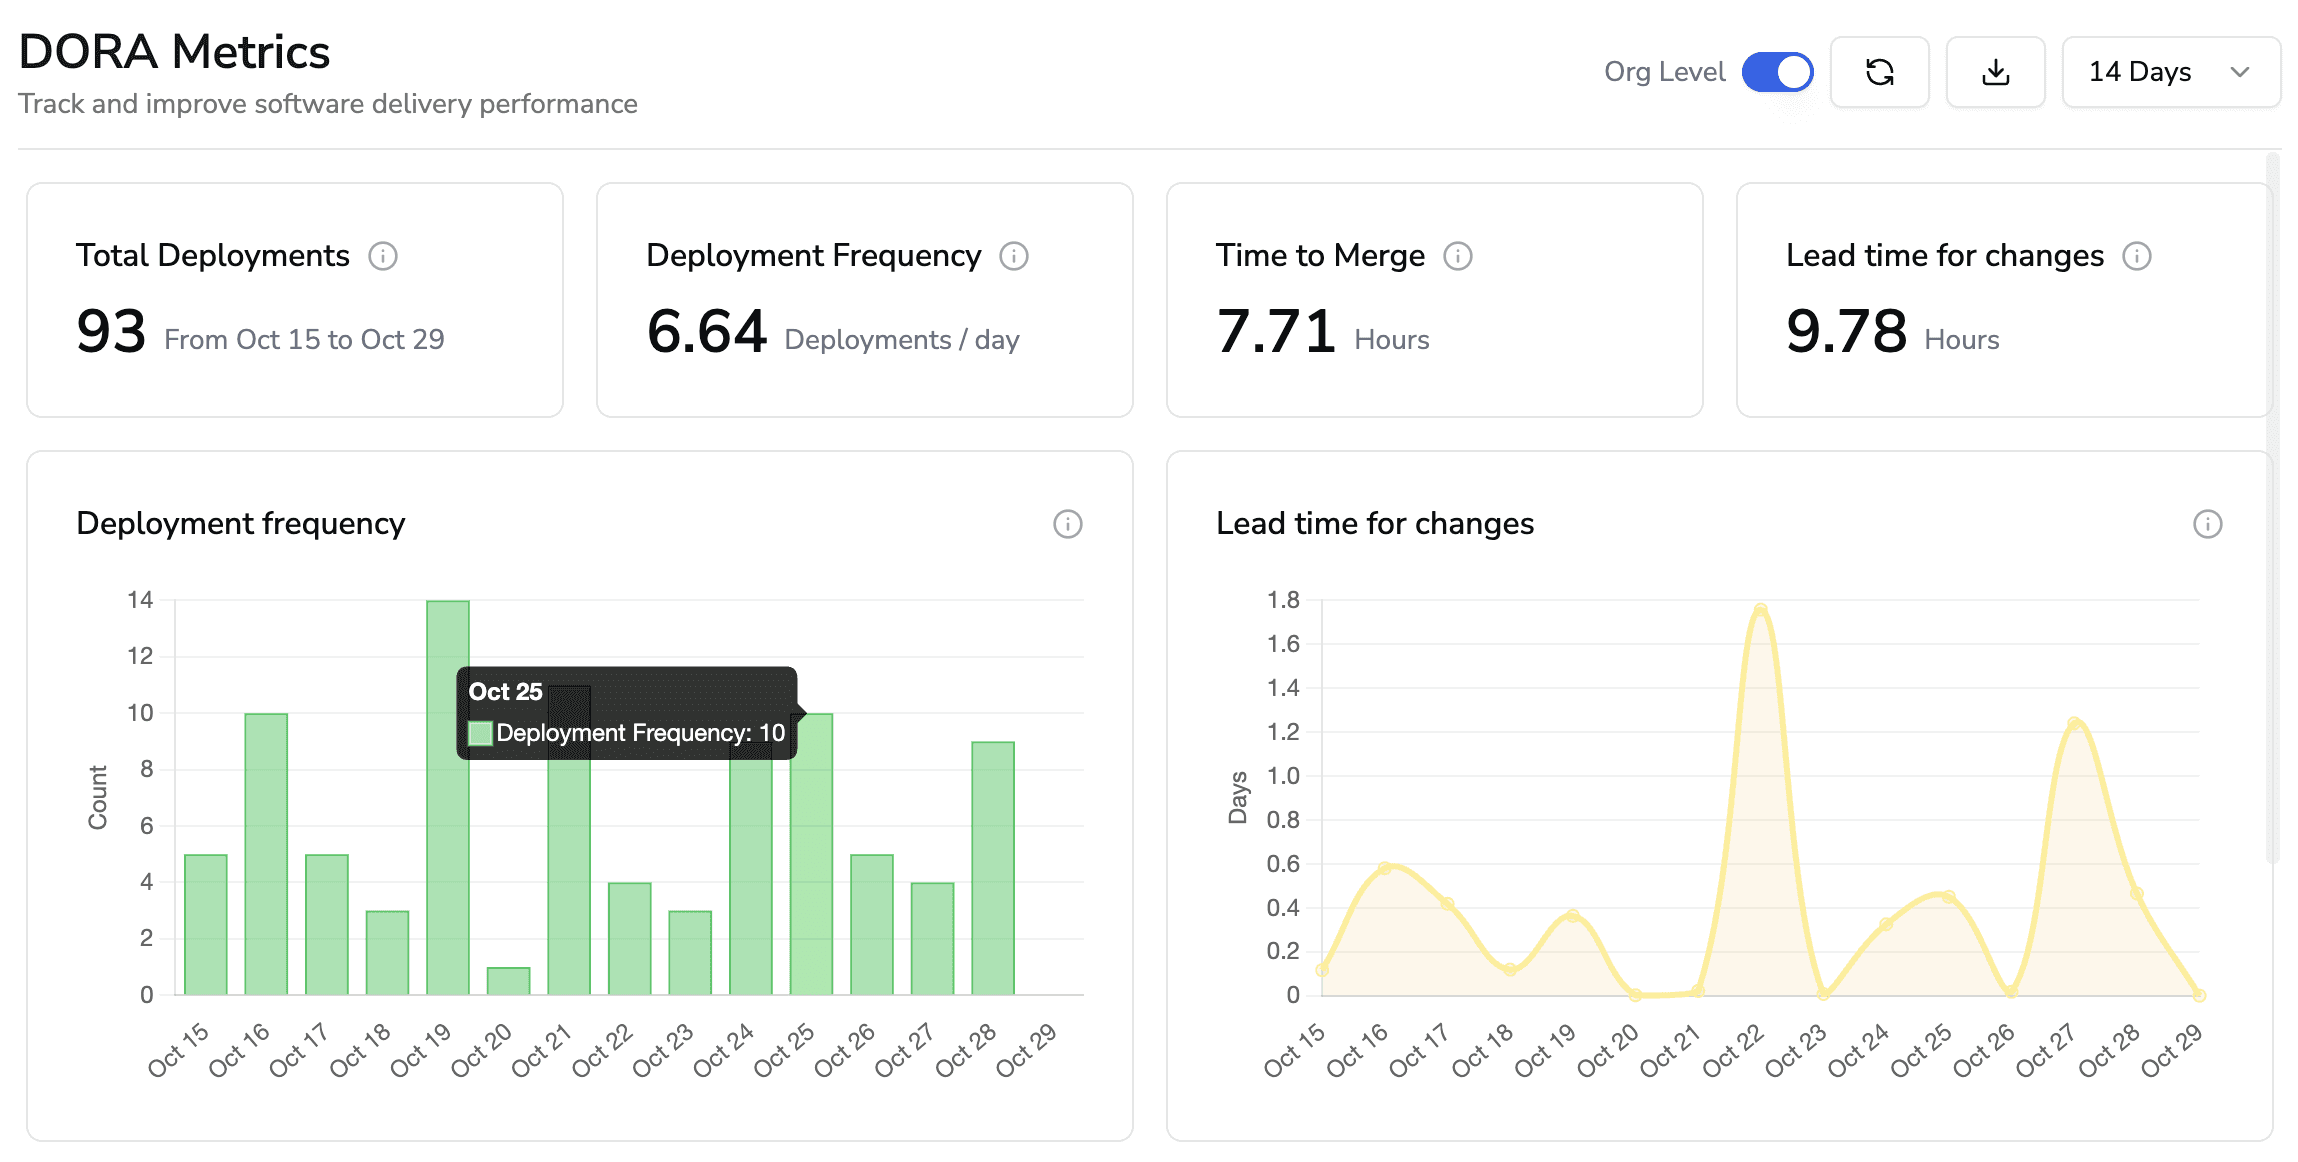
2) Link to delivery metrics (DORA/SPACE)
Quality without delivery is academic; delivery without quality is chaos. Roll up axis metrics to DORA’s four keys to see business impact (lead time, deployment frequency, change failure rate, MTTR).
3) Define targets by criticality
Not every module is equal. Assign code grading tiers (Gold/Silver/Bronze) with different thresholds (e.g., mutation score ≥70% for Gold, ≥50% for Silver).
4) Automate a code quality audit pipeline
Nightly/weekly: compute metrics, diff trends, flag regressions, and create issues automatically.
5) Make dashboards decision-ready
Show:
Metrics for code quality by axis; red/yellow/green thresholds
Hotspots (high complexity × high churn)
Security backlog and MTTR-V trend
DORA overlay (lead time, CFR, MTTR) to connect quality to throughput
6) Govern via quality gates
Block merges on “must-not-fail” checks (e.g., secret detection, critical SAST findings, catastrophic test failures); warn (don’t block) on advisory checks to avoid review gridlock.
7) Review quarterly
Correlate metric movements with business results; re-tune thresholds. McKinsey notes that productivity programs realize value only when measurement and ways-of-working change together, mirroring that in engineering.
Benchmarks & Thresholds (pragmatic starting points)
Use these as guardrails, not dogma, tailored by service criticality and risk.
Cyclomatic Complexity: aim for median function CC < 10; flag > 15 for review. (Still widely referenced in 2025 quality roundups.)
Duplication: < 5–10% per module for core services.
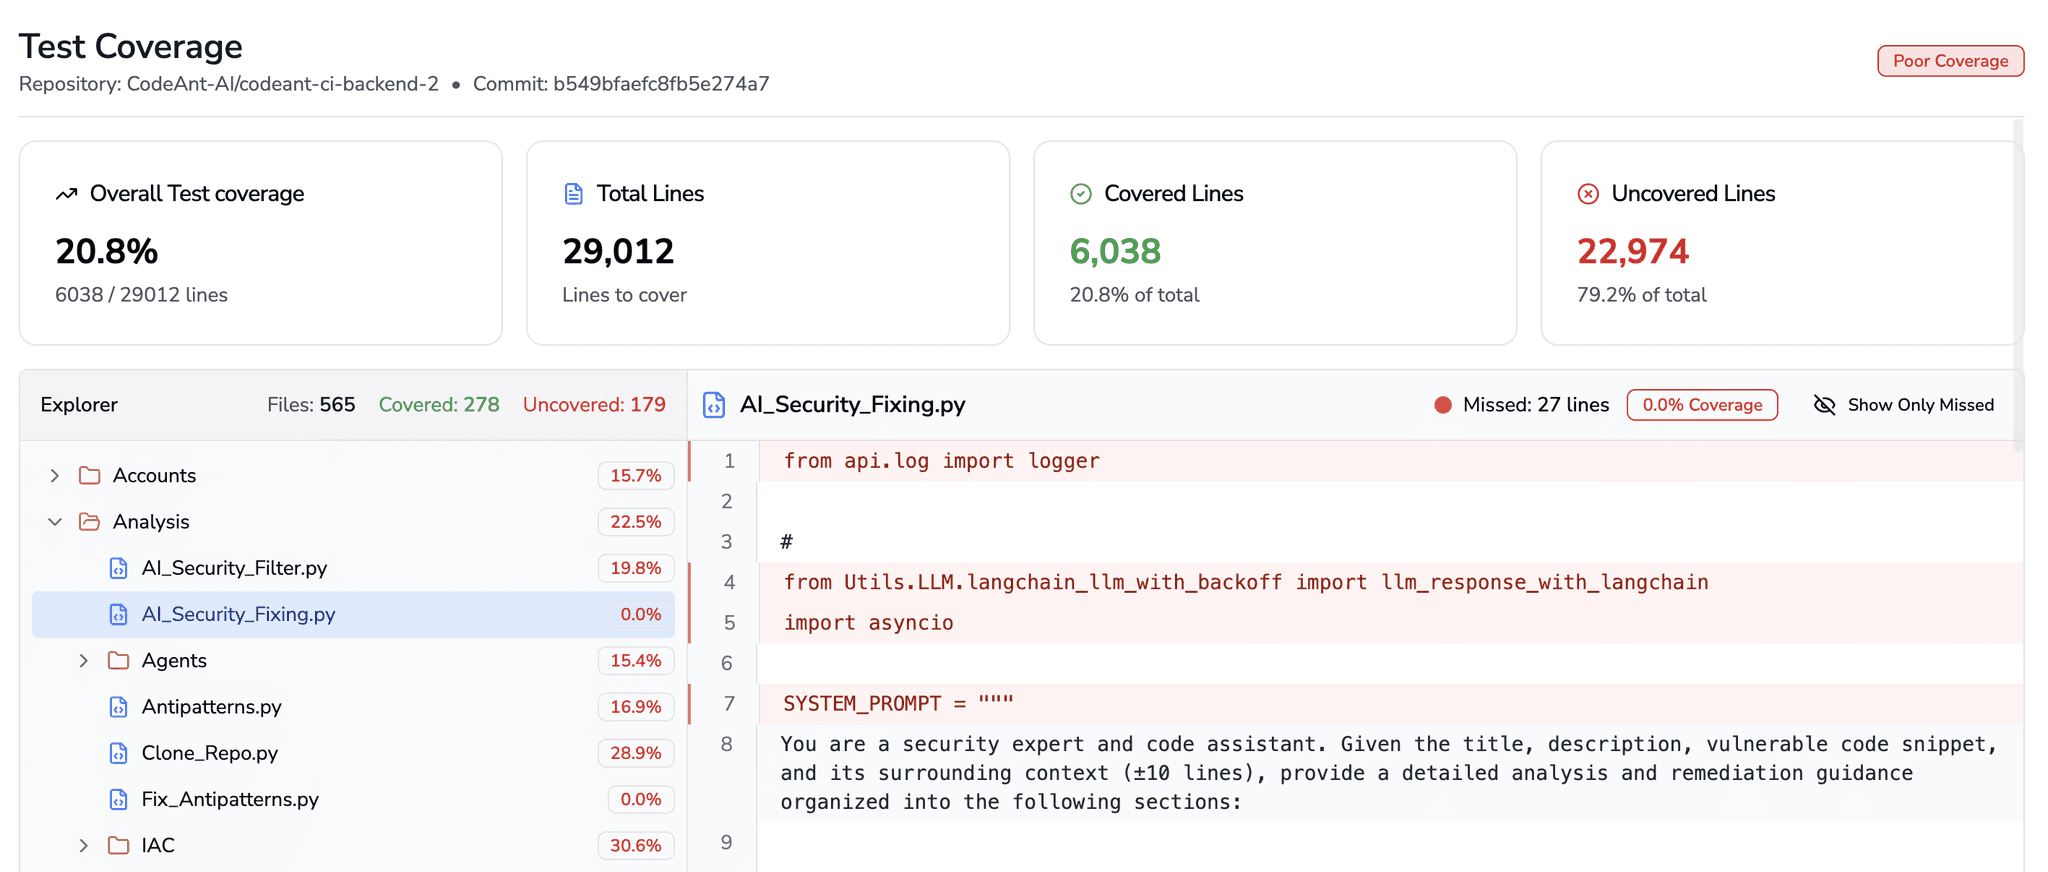
Coverage: 80%+ on core logic, but prefer mutation score ≥ 60–70% over raw coverage.
CFR: push below 15% for core services (DORA orientation); MTTR to hours, not days.
Security: no open critical vulns; high-risk findings MTTR-V < 24–72h (policy-driven). Follow NIST SSDF and 800-218A where AI is involved.
Perf: hold p95 latency within SLO; fail PRs that regress p95 by >10% on hot endpoints.
How Do You Ensure the Quality of Your Code?
Shipping fast only works if your codebase can absorb that speed without collapsing under tech debt. A structured 90-day quality playbook helps teams go beyond “fix issues when they appear” and instead build predictable, compounding code health improvements.
Days 0–30 (baseline & block the worst risks)
Stand up code quality tools on PRs.
Enable secret scanning + SAST; block on critical finds.
Baseline code quality metrics across the seven axes; identify top 10 hotspot modules.
Set PR size guardrails (soft fail > 400 LOC) to reduce review latency.
Days 31–60 (quality gates & fast feedback)
Turn on quality gates per axis (security, tests, duplication).
Add mutation testing to critical services.
Introduce performance checks in CI for hot endpoints.
Start monthly code quality audit reviews with DORA overlay.
Days 61–90 (governance & culture)
Publish dashboards (axis health + DORA metrics); hold axis owners accountable.
Shift “refactor before feature” for Red-grade modules.
Secure-by-design: map SSDF/OWASP controls into PR checklists and policy-as-code.
Celebrate: track and share wins (CFR ↓, MTTR ↓, lead time ↓).
Where CodeAnt AI fits (and why it matters for fast-moving teams)
Context-aware AI review on every PR: catches readability issues, complexity spikes, duplication, test gaps, and security risks; suggests one-click fixes so reviewers focus on design, not nits.
Unified quality + security + compliance: one pane of glass versus stitching multiple tools; aligns directly to Axes 1–5 with governance for 6–7.
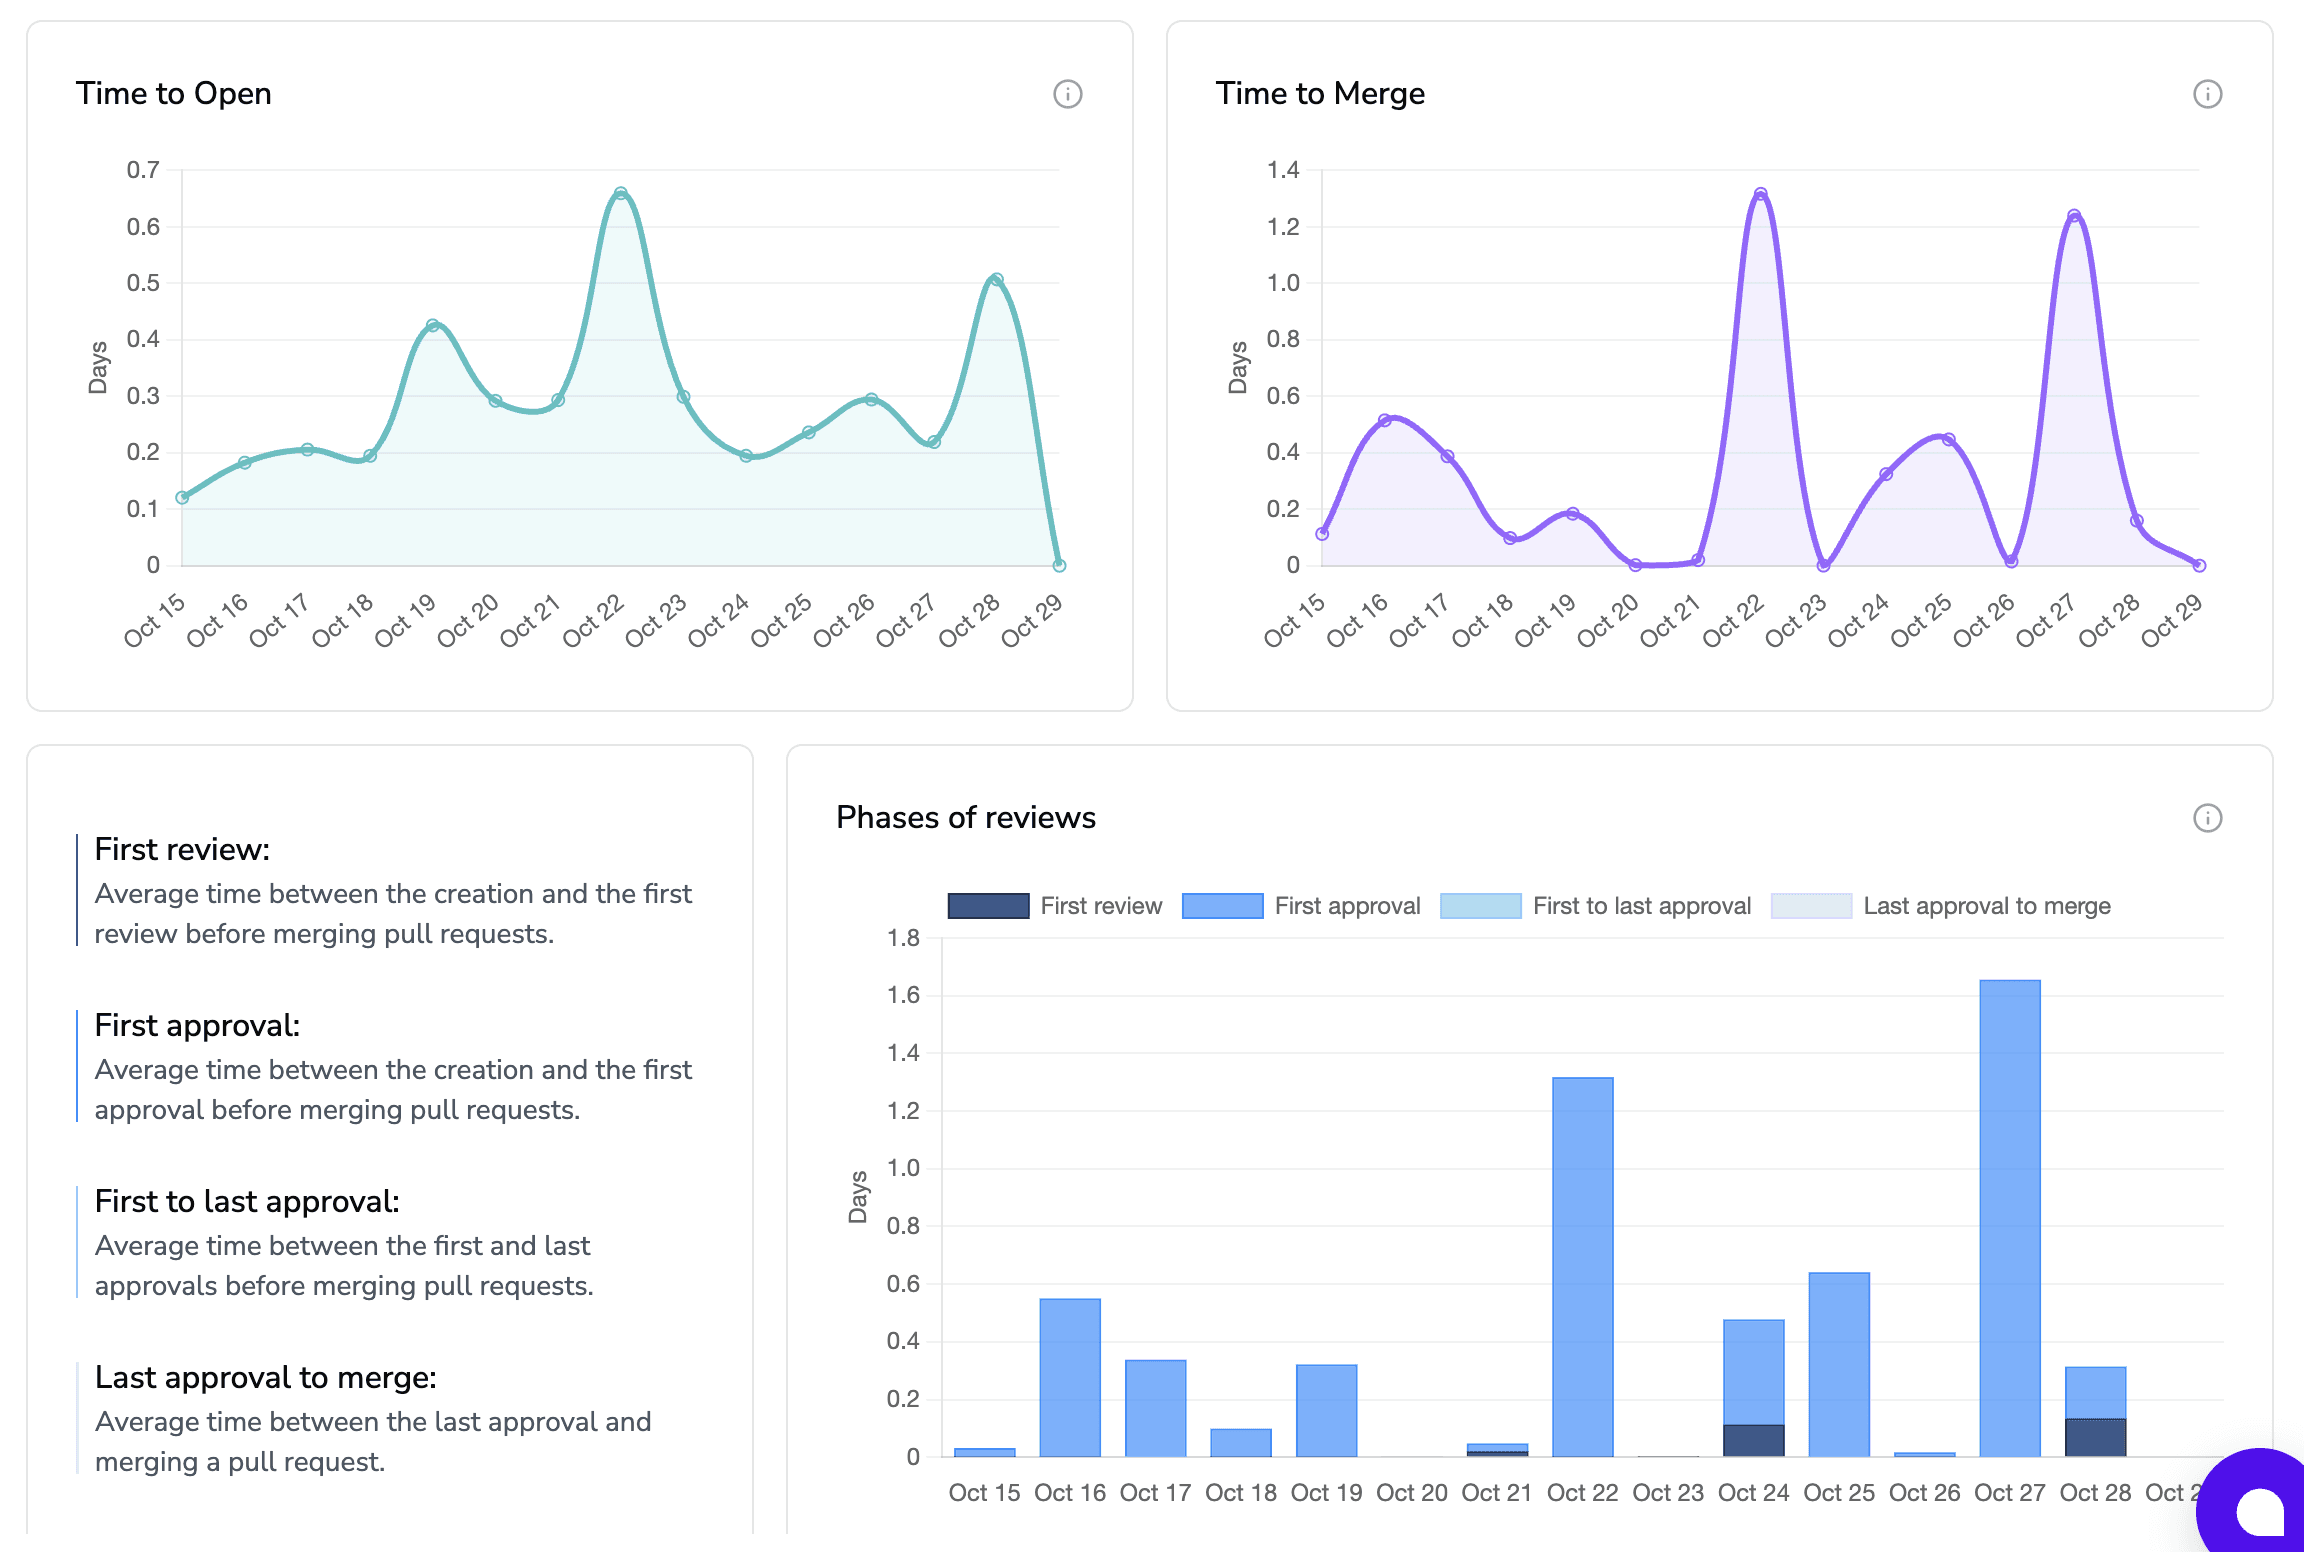
Leadership metrics: developer-level and team dashboards (review latency, PR sizes, CFR/MTTR overlays) so you can measure code quality and its impact on delivery.
Scale: built for 100+ developer orgs with multi-repo, polyglot stacks; per-developer pricing avoids “per-LOC” penalties as you scale.
Bottom line: Turn “Quality” Into a System You Can Run
Code quality isn’t a slogan, it’s a system. Use these 7 axes to turn “quality” into a measurable, improvable capability. Tie code quality metrics (complexity, duplication, mutation score, vuln density) to software quality metrics (CFR, MTTR, SLOs). Automate code quality measurement and quality gates.
Next step:
Start implementing the 7 Axes today. Use a platform like CodeAnt.ai to operationalize code quality at scale, giving developers fast, precise feedback and giving leaders clear visibility into how quality drives delivery speed, reliability, and cost efficiency.
That’s how you turn the question “How do you ensure code quality?” into a framework you can run, measure, and scale.
Try out our code quality product here: https://www.codeant.ai/code-quality
To learn more, you can also book a free live demo with our sales team today!
FAQs
What are the 7 Axes of Code Quality?
How do you ensure the quality of your code?
How do you ensure code quality in AI/LLM projects?
What are the most important metrics for code quality?
What are code quality audits and when should they be done?


