AI Code Review
What Metrics Prove AI Code Review Reduces Backlog (Not Just Comment Volume)

Sonali Sood

Founding GTM, CodeAnt AI
You adopted AI code review to clear your backlog. Three months later, comment volume is up 40%, but your backlog hasn't budged. Your team spends hours triaging suggestions instead of shipping code. This is the activity trap: measuring what AI produces, not what developers accomplish.
The real question: Are developers fixing what AI flags, or dismissing it as noise?
This guide shows you which metrics prove AI code review delivers throughput gains: Time to First Review (TTFR), resolved-issue rate, and security-catch rate, the three signals that separate backlog reduction from review theater. You'll learn how to measure them without tool sprawl.
Why Most AI Code Review Metrics Miss the Point
The typical adoption story: you integrate an AI tool, see 40% more comments per PR, and assume you're catching more issues. Three months later, backlog has grown 30%, developers spend more time triaging than fixing, and leadership questions the ROI.
The problem: You're tracking activity (comments generated), not outcomes (issues resolved).
The False Positive Problem
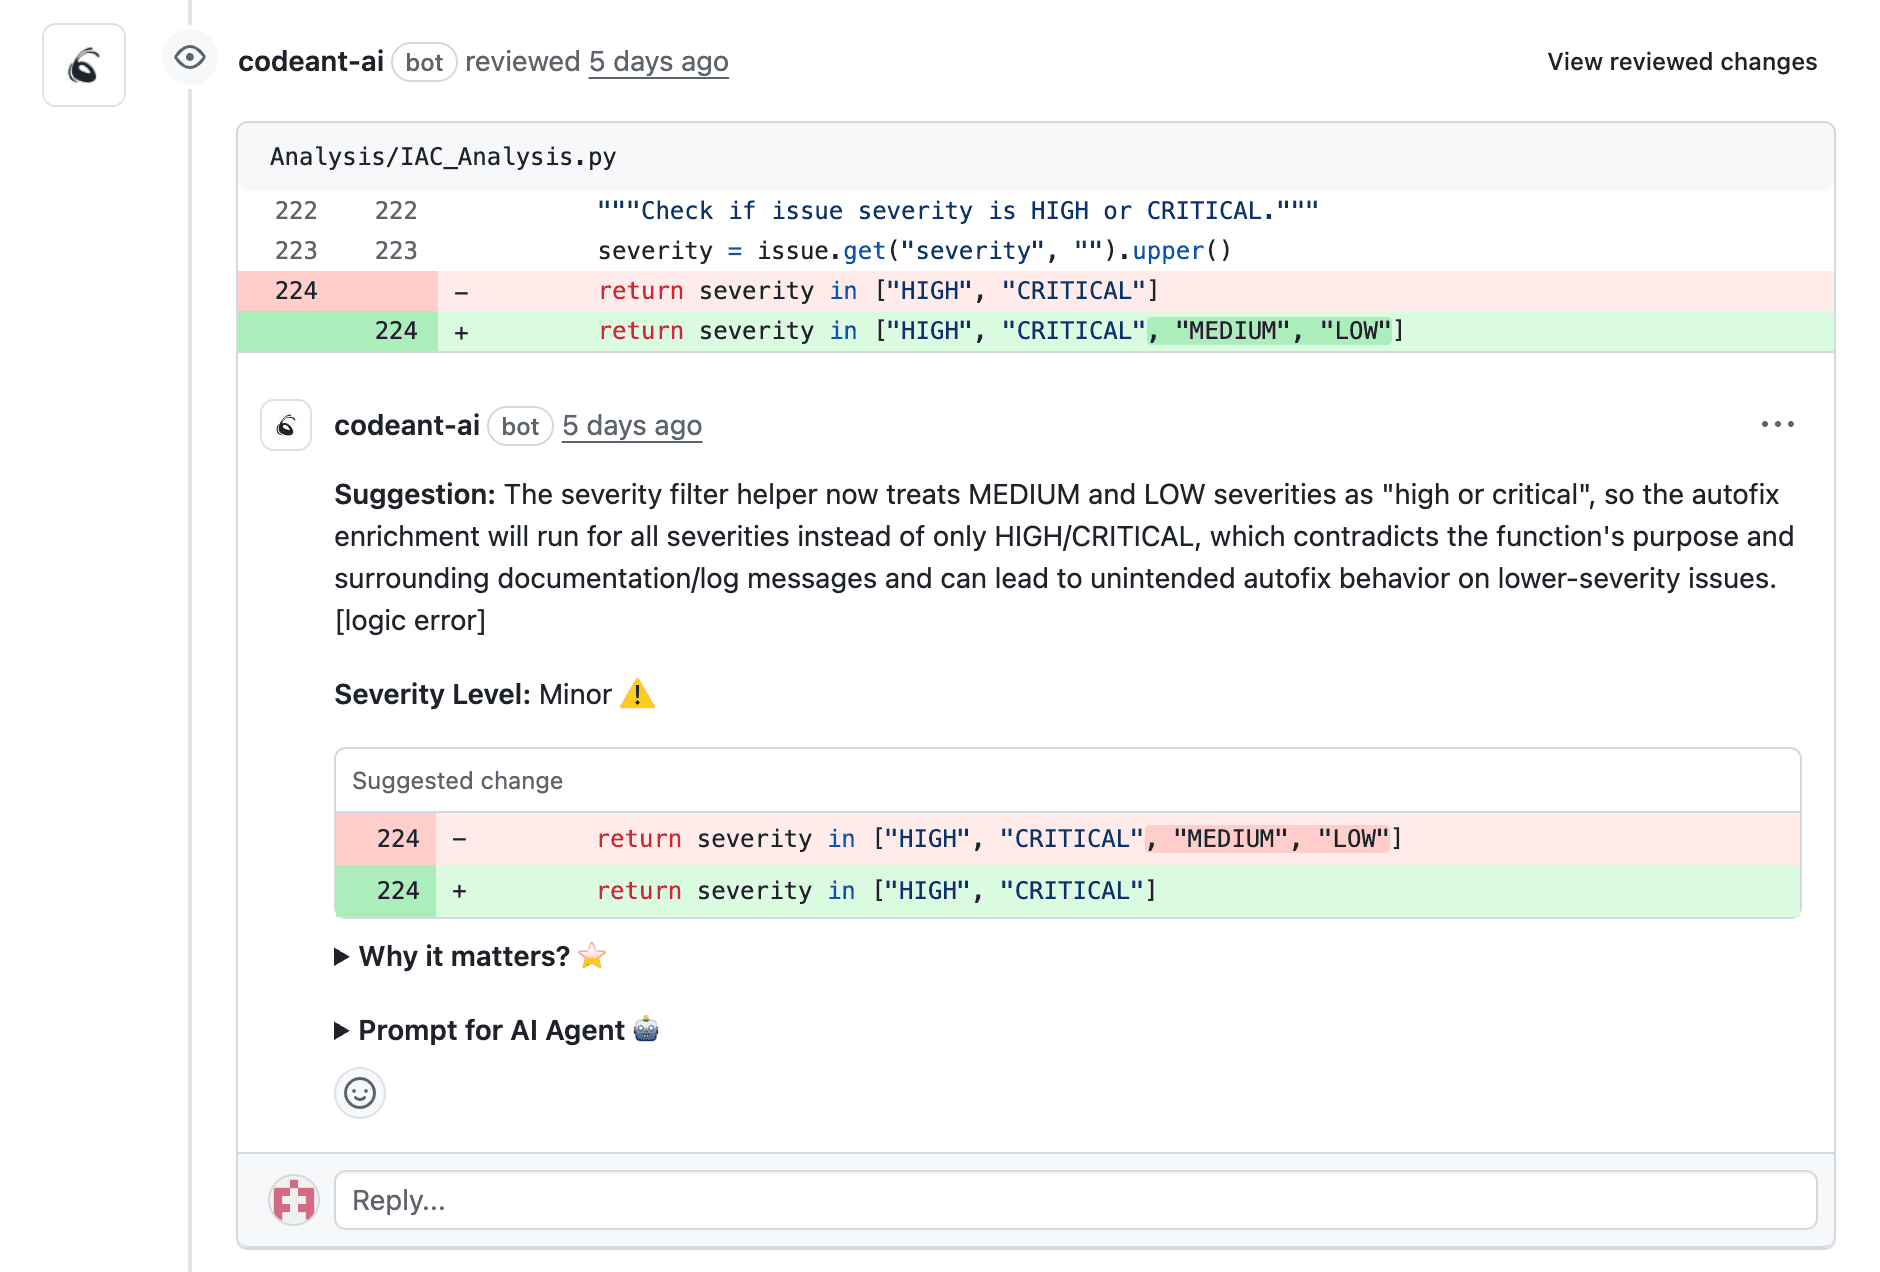
Research shows 68% of AI-generated comments go unaddressed because they're low-signal noise, style nitpicks, context-blind suggestions, or issues already covered by linters. When your AI flags 15 items per PR but developers only act on 4, you haven't improved code quality; you've created a review theater.
Vanity metric: Comments per PR
Impact metric: Resolved issues per PR (issues developers actually fixed and merged)
CodeAnt addresses this by learning your codebase's patterns and risk profile. Our context-aware engine reduces false positives by 80% compared to generic tools, surfacing only issues that matter, security vulnerabilities, complexity spikes, coverage drops. When CodeAnt flags something, developers fix it.
When Backlog Grows Despite AI Adoption
A 50-person team adopts AI code review, sees comment volume increase from 8 to 12 per PR, and celebrates "deeper analysis." Six weeks later, their PR backlog grew from 42 to 55. Why? Developers now spend 20 minutes per PR sorting signal from noise instead of 10 minutes addressing real issues.
The root cause: not all backlog is created equal. A PR with a critical SQL injection is fundamentally different from one with minor duplication, but most AI tools treat them identically.
CodeAnt's backlog composition analysis categorizes PRs into security-critical, coverage drops, complexity spikes, and stale reviews. You immediately see what's blocking merges and where to focus.
What "Improved Throughput" Actually Means
Developer throughput isn't "PRs opened" or "lines of code written." It's valuable, production-ready code shipped per unit time. This aligns with DORA metrics:
Deployment frequency: How often you ship to production
Lead time for changes: Time from commit to production
Change failure rate: Percentage of deployments causing incidents
AI code review should improve all three by catching issues earlier, accelerating review cycles, and reducing post-merge defects. But standard DORA metrics don't capture AI-specific impact, how many vulnerabilities were prevented, how often developers accepted auto-fixes, or whether your backlog is growing despite faster reviews.
CodeAnt extends DORA with AI-native measurements: auto-fix adoption rate, context-aware accuracy, and risk-adjusted backlog velocity.
The 3 Metrics That Prove Backlog Reduction
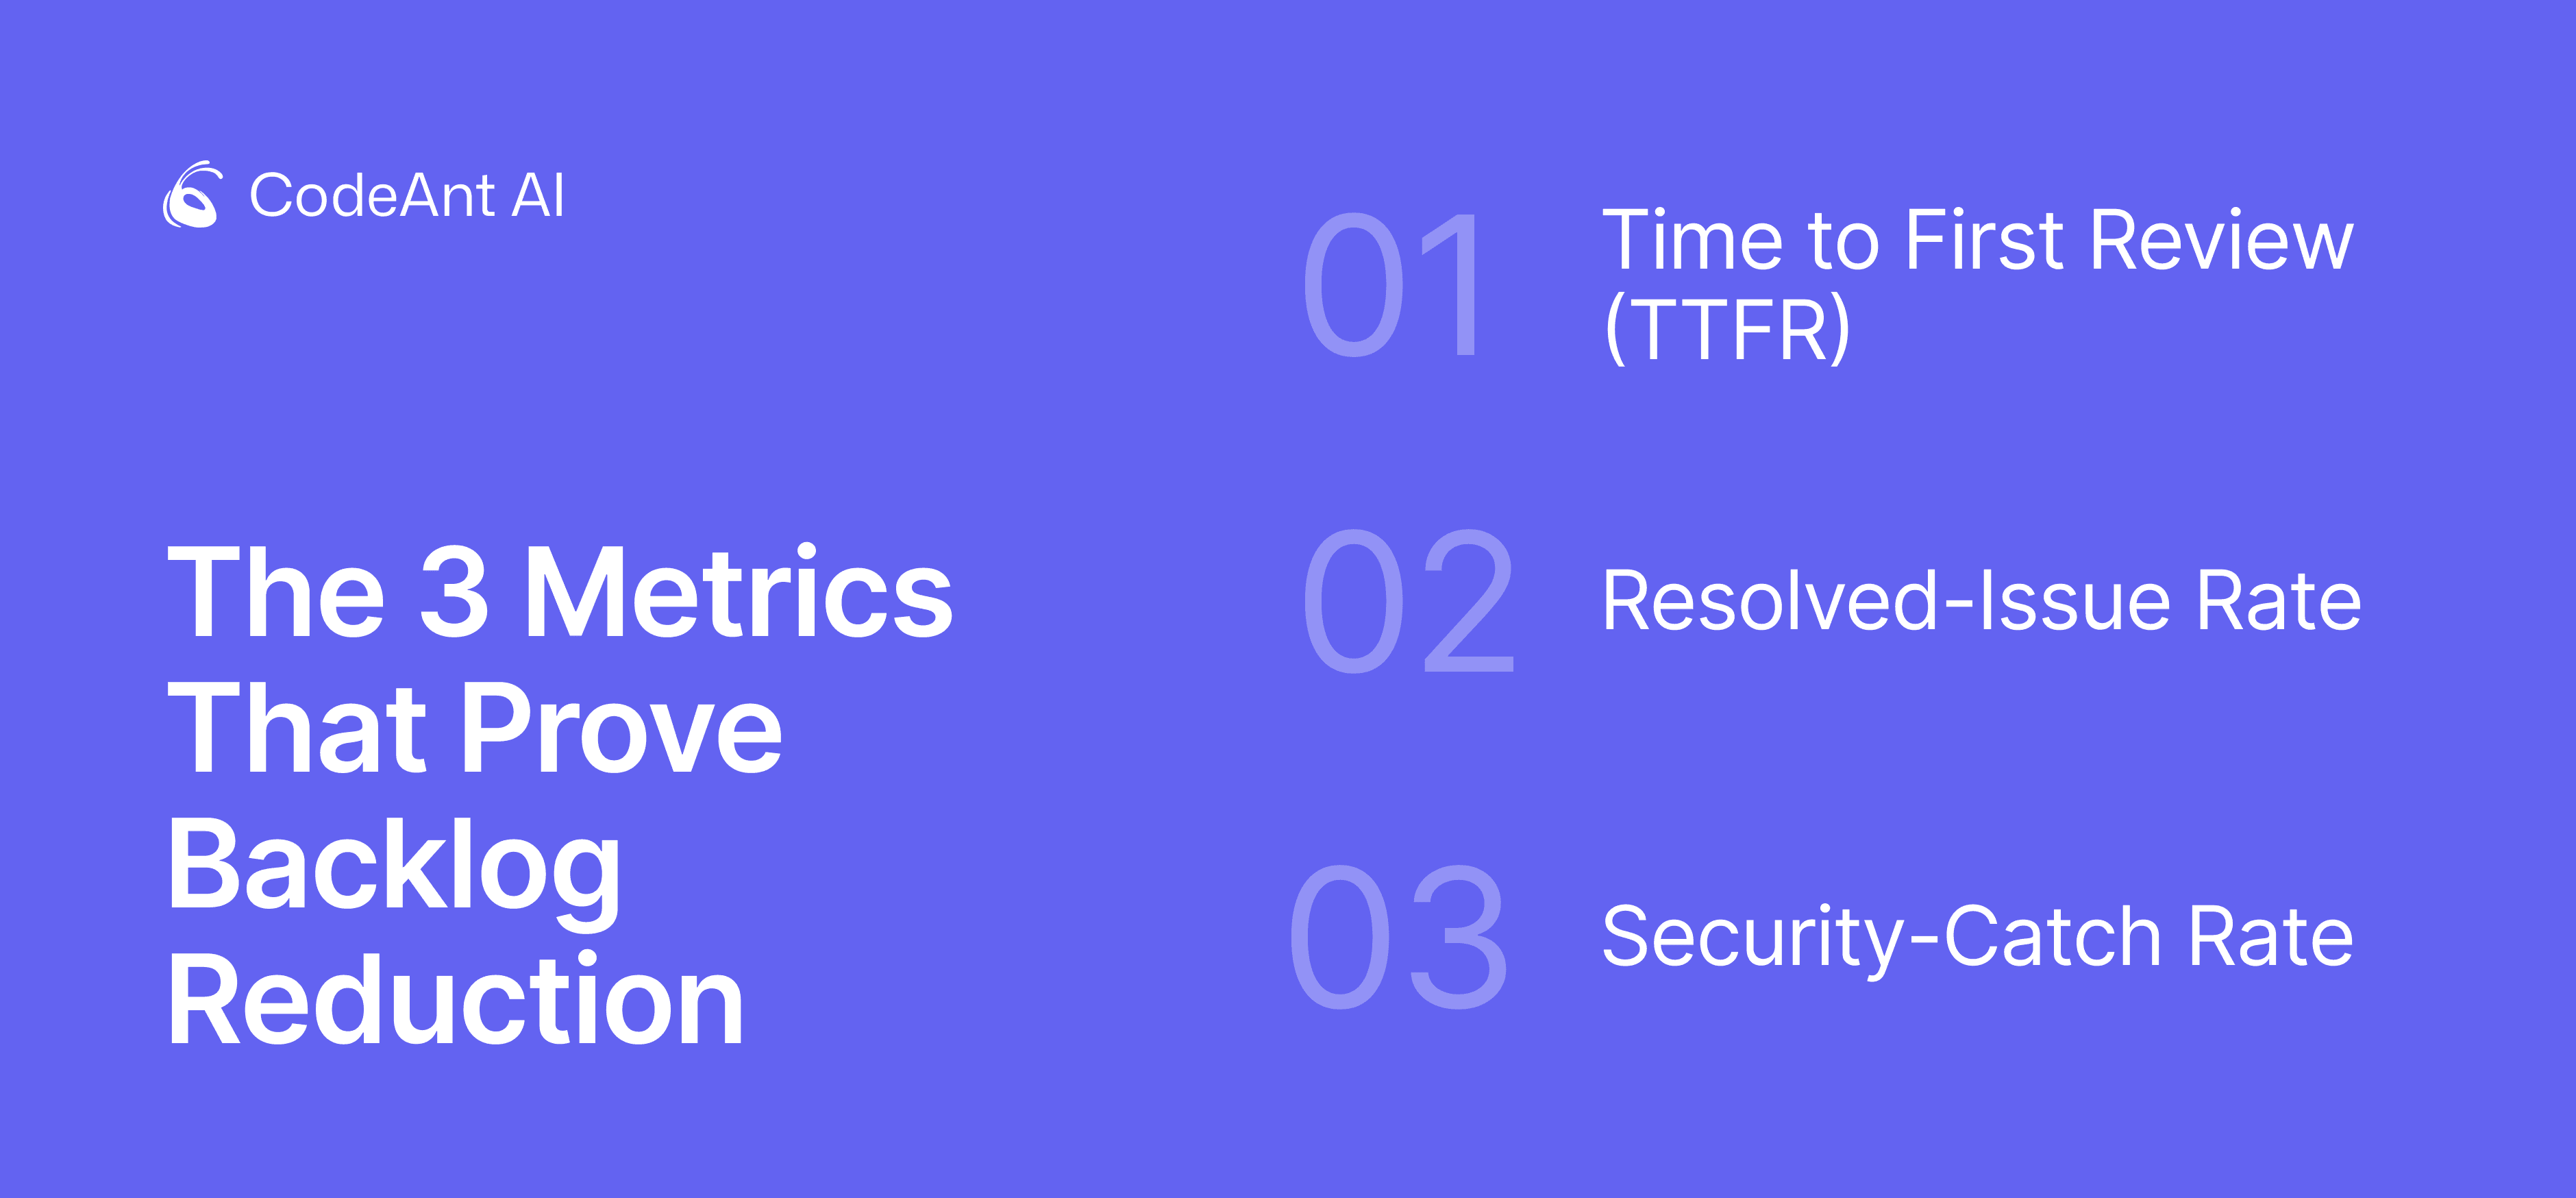
Instead of tracking how much your AI talks, measure what happens after it speaks. These three outcome-based metrics prove whether you're cutting backlog or creating busywork.
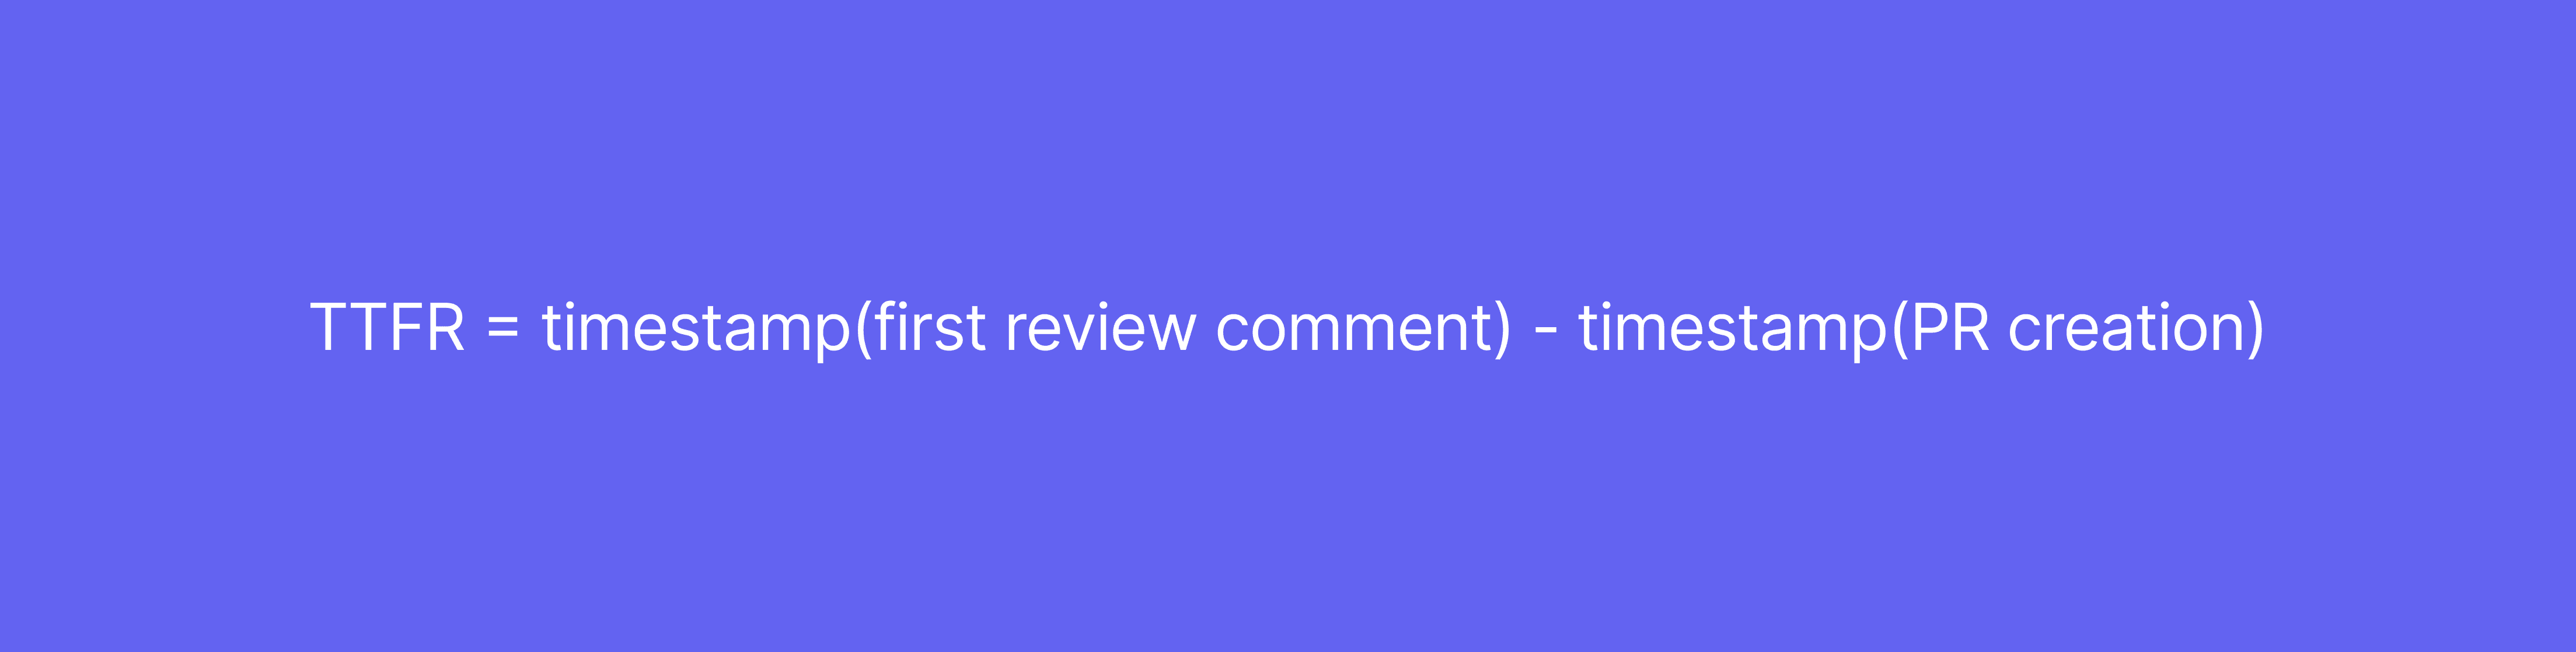
Metric #1: Time to First Review (TTFR)
Definition: Time from PR creation to first meaningful review comment.
Long TTFR forces developers into context switching. If a developer opens a PR at 10 AM and doesn't get feedback until 2 PM, they've already moved on. When feedback arrives, they need 15–20 minutes to reload context. Multiply that across 200 PRs per week, and you've lost 50+ engineering hours to cognitive overhead.
Industry benchmark: <4 hours (manual review)
AI-accelerated target: <15 minutes
Formula:
Real-world impact: A fintech team using CodeAnt reduced TTFR from 4.2 hours to 12 minutes, cutting PR backlog by 63% in 90 days. Developers stayed in flow state, addressed feedback immediately, and merged faster.
CodeAnt achieves this through continuous scanning, we analyze code as it's pushed, not just when PRs are opened. By the time a developer creates a PR, CodeAnt has already identified issues and posted actionable feedback.
You can read all our use cases here.
Target thresholds by PR size:
PR Size | Target TTFR | Red Flag |
Small (<200 lines) | <10 minutes | >30 minutes |
Medium (200-500 lines) | <30 minutes | >2 hours |
Large (>500 lines) | <2 hours | >8 hours |
Metric #2: Resolved-Issue Rate
Definition: Percentage of AI-flagged issues that developers actually fix and merge into production.
This separates signal from noise. If your AI flags 100 issues per week but developers only resolve 40, your resolved-issue rate is 40%, meaning 60% of AI output is wasted effort.
Benchmark thresholds:
<45%: Noise problem, too many false positives or low-priority suggestions
45–75%: Acceptable, room for improvement in context awareness
>75%: High-value AI, developers trust and act on recommendations
CodeAnt customer average: 78% resolved-issue rate
Why CodeAnt outperforms:
Context-aware analysis: We learn your team's conventions, architectural patterns, and risk tolerance
One-click fixes: Instead of just identifying problems, CodeAnt generates production-ready fixes
How to calculate with proper normalization:
Handle dismissals correctly:
False positives: Excluded from denominator (with justification)
Accepted risk: Excluded from denominator (requires security approval)
Deferred: Included in denominator (counts as unresolved)
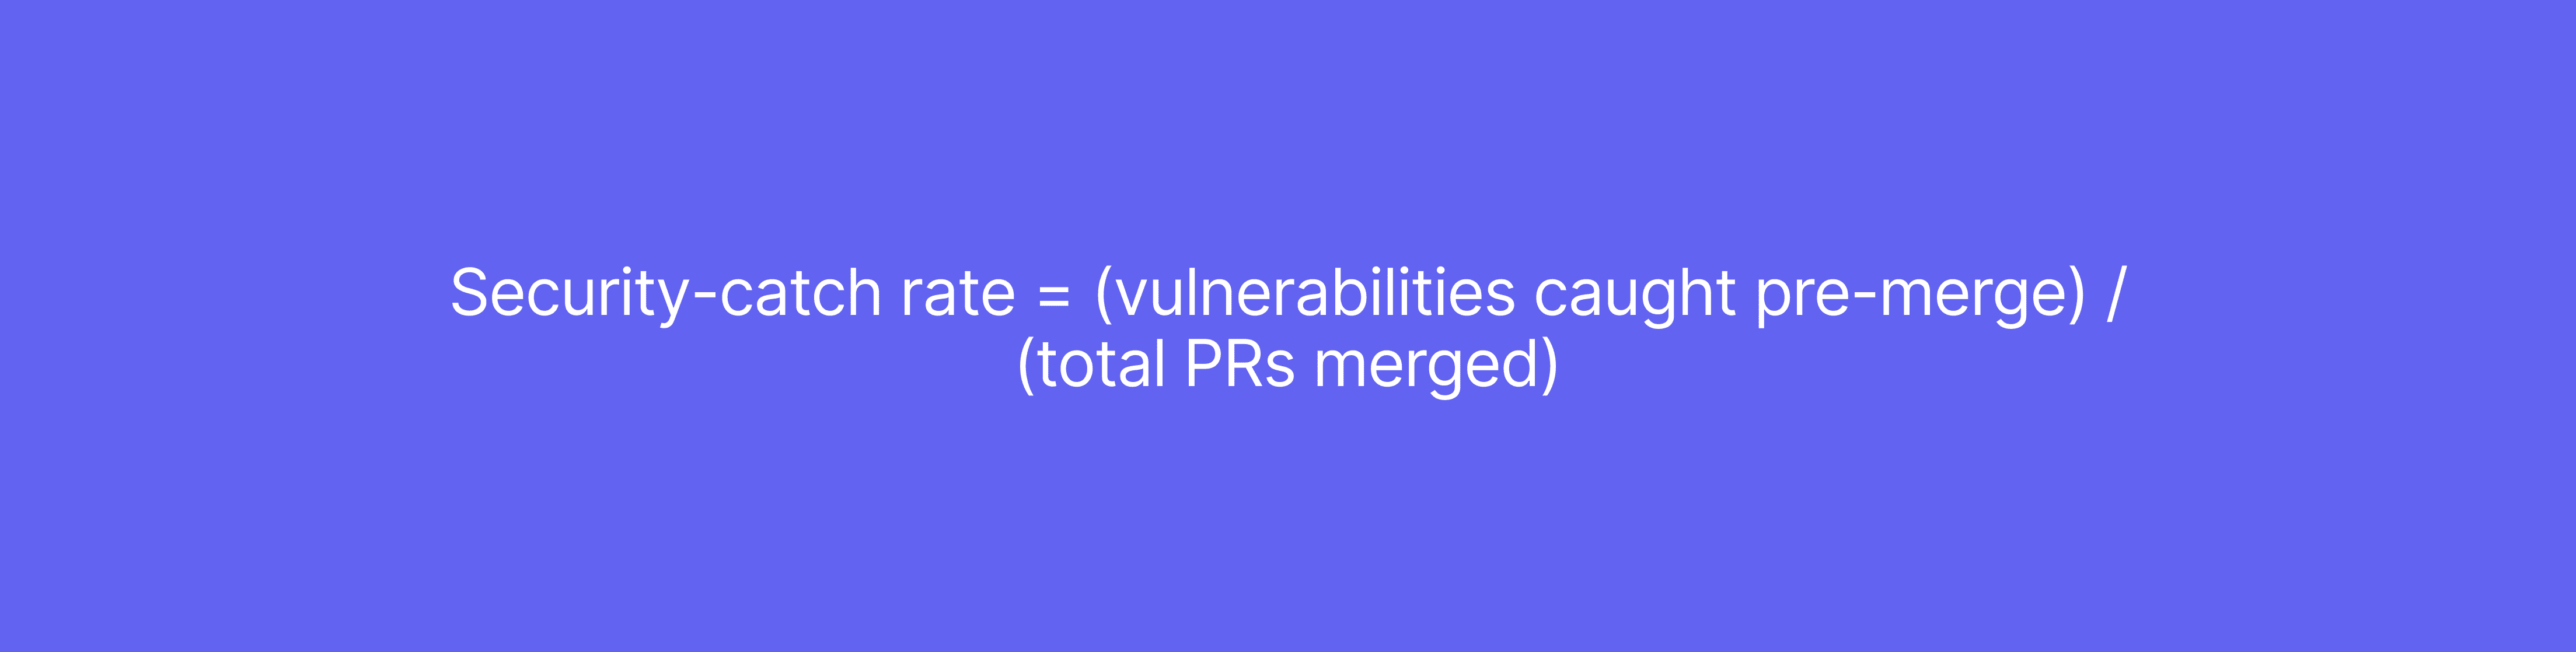
Metric #3: Security-Catch Rate
Definition: Number of security vulnerabilities (SQL injection, XSS, secrets exposure, misconfigurations) caught before merge.
Post-merge defect rate tells you what slipped through; security-catch rate tells you what AI prevented. This is critical for proving ROI, every pre-merge vulnerability is an incident you avoided.
Formula:
Target: >90% of vulnerabilities caught before production
Real-world example: An e-commerce platform using CodeAnt caught 47 security issues pre-merge in Q1 2024, compared to 12 with their previous tool. The difference? CodeAnt's continuous scanning across every branch and commit, not just PRs.
Why this matters for backlog: Security issues are the highest-priority backlog items. If your AI only catches 30% pre-merge, the other 70% become urgent post-merge fixes, incident response, and customer escalations.
Segment by vulnerability class for accuracy:
Vulnerability Class | Target Catch Rate |
Secrets exposure | >95% |
Injection flaws | >80% |
Authorization defects | >70% |
Dependency CVEs | >85% |
Misconfigurations | >65% |
Supporting Metrics That Prevent Vanity
The three primary metrics tell you whether AI is working. Supporting metrics diagnose why and prevent you from optimizing for the wrong outcomes.
PR Aging Distribution
Track P50 (median) and P90 (90th percentile) time-to-merge, not just total backlog count.
P50 time open: Should stay under 48 hours; if it exceeds 72 hours, you're accumulating stale context
P90 time open: If >7 days, you have structural review bottlenecks
Age buckets: <24h, 1-3 days, 3-7 days, >7 days
A team with 40 PRs and P50 of 18 hours is healthy. A team with 40 PRs and P50 of 96 hours has a backlog crisis.
Rework Rate
Definition: Percentage of merged PRs requiring follow-up fixes within 48 hours.
Target: <8% follow-up PR rate
Rising rework rate signals your AI is greenlighting incomplete changes. You're trading review rigor for false velocity, PRs merge faster, but developers spend more time cleaning up mistakes.
Backlog Composition by Risk
Not all PRs are equal. Track backlog breakdown:
Risk Category | What to Track |
Security-critical | Count, average age, blocking factors |
Coverage drops | PRs with test coverage regressions |
Complexity spikes | Functions exceeding cyclomatic thresholds |
Stale reviews | PRs waiting >7 days |
Low-risk | Documentation, config tweaks |
CodeAnt's risk-based categorization answers: "What's blocking us, and where should we focus?"
One-Click Fix Adoption Rate
Definition: Percentage of CodeAnt's auto-generated fixes that developers accept and merge.
This is the ultimate proof-of-value metric. If developers accept 65% of one-click fixes, that's 65% of issues resolved without manual rewriting, direct backlog reduction.
CodeAnt customer benchmark: 65% adoption rate for auto-fixes
Comparison:
Platform | Flags Issues | Generates Fixes | Tracks Adoption |
CodeAnt AI | ✅ | ✅ | ✅ |
GitHub Copilot | ❌ | ✅ (in editor only) | ❌ |
SonarQube | ✅ | ❌ | ❌ |
Snyk Code | ✅ | ❌ | ❌ |
How to Implement These Metrics
Phase 1: Establish Baseline (Weeks 1-2)
Before proving AI impact, capture your current state:
PR backlog size and age distribution
Current TTFR across repos
Average cycle time (PR open → merge)
Security issues found post-merge
Developer review load per week
Phase 2: Define Event Schema (Week 2)
Track every meaningful interaction:
Event | Metadata | Why It Matters |
| Author, repo, lines changed | Start clock for TTFR |
| Issue type, severity, auto-fix available | AI activity |
| Issue ID, resolution type | The signal—proves real impact |
| Commit SHA, merge timestamp | End of cycle time |
Phase 3: Set Inclusion Rules (Week 3)
Include:
PRs with >10 lines of code changed
PRs going through standard review process
PRs merged to main/production branches
Exclude:
Automated dependency updates (unless specifically measuring)
Release PRs bundling multiple changes
PRs during incident response or release freezes
Phase 4: Segment for Meaningful Comparison (Week 4)
Track metrics separately by:
Repository: Frontend vs. backend, legacy vs. greenfield
Team: Platform, product, security, data
PR size: Small (<100 lines), medium (100-500), large (>500)
Language: Python vs. Rust vs. TypeScript
This reveals where AI delivers most value and where tuning is needed.
Translating Metrics to Executive ROI
Engineering metrics prove AI works, but leadership speaks ROI. Here's the translation framework:
Hours Saved from Reduced TTFR
Hours saved = (Old TTFR - New TTFR) × PRs/month × Reviews per PR
Cost saved = Hours saved × Blended hourly rate
Example:
(4 hours - 0.25 hours) × 200 PRs × 2 reviews = 1,500 hours/month
1,500 hours × $75/hour = $112,500/month saved
Avoided Incidents from Security Catches
Avoided cost = Security issues caught × Incident probability × Avg incident cost
Example:
47 vulnerabilities × 0.15 probability × $300K = $2.1M in avoided risk
Increased Deployment Frequency
Revenue impact = Deployment frequency increase × Feature value per deploy
Example:
3× more deploys × $50K avg feature value = $150K/month accelerated revenue
Executive Summary Template
Metric | Before | After (90 days) | Business Impact |
TTFR | 4.2 hours | 12 minutes | $112K/month saved time |
Security catches | 12/quarter | 47/quarter | $2.1M avoided incidents |
PR backlog | 60 PRs | 24 PRs | 3× faster deployments |
Quarterly ROI | — | — | $1.1M+ value vs. $20K investment (55× return) |
How CodeAnt Tracks What Actually Matters
CodeAnt provides the only unified platform that measures AI code review impact across flow, quality, and security, proving backlog reduction through 360° engineering insights.
Continuous Scanning: We analyze every branch and commit continuously, not just when PRs are opened, surfacing risks before they become backlog items.
Resolved Findings That Ship: Track issues from detection → fix → merge → production, proving AI suggestions actually improved your code.
Risk-Based Backlog Composition: See exactly what's blocking your team by security risk, quality impact, and flow bottlenecks in a unified view.
Developer-Level Insights: Drill down to individual contributor metrics, who's blocked, who's overloaded, where bottlenecks exist.
One-Click Fixes: 65% of CodeAnt's auto-generated fixes get accepted and merged, directly reducing backlog by eliminating manual fix implementation.
Start your 14-day free trial and get a custom metric dashboard configured for your team, proving backlog reduction in 90 days, not 90 slides.
Key Takeaways
AI code review tools should reduce backlog, not inflate comment volume. To prove impact, track outcome-based metrics:
Time to First Review (TTFR): <15 minutes keeps developers in flow state
Resolved-issue rate: >75% proves AI recommendations are high-signal
Security-catch rate: >90% means vulnerabilities are stopped pre-merge
Supporting metrics, backlog composition, PR aging, rework rate, and one-click fix adoption, provide the full picture of AI impact.
Stop measuring activity. Start measuring outcomes. CodeAnt is the only platform that tracks all of these in a unified dashboard, providing backlog reduction through 360° engineering insights.See measurable results in 90 days.
FAQs
What's a realistic resolved-issue rate target for AI code review?
How do I distinguish AI comments that improve code quality versus create noise?
Should I measure metrics per-repo, per-team, or organization-wide?
What if TTFR drops but overall cycle time stays flat or increases?
What if the resolved-issue rate is low because findings are low severity?


