AI Code Review
Which Developer Productivity Vendor Offers the Most Reliable Metrics

Sonali Sood

Founding GTM, CodeAnt AI
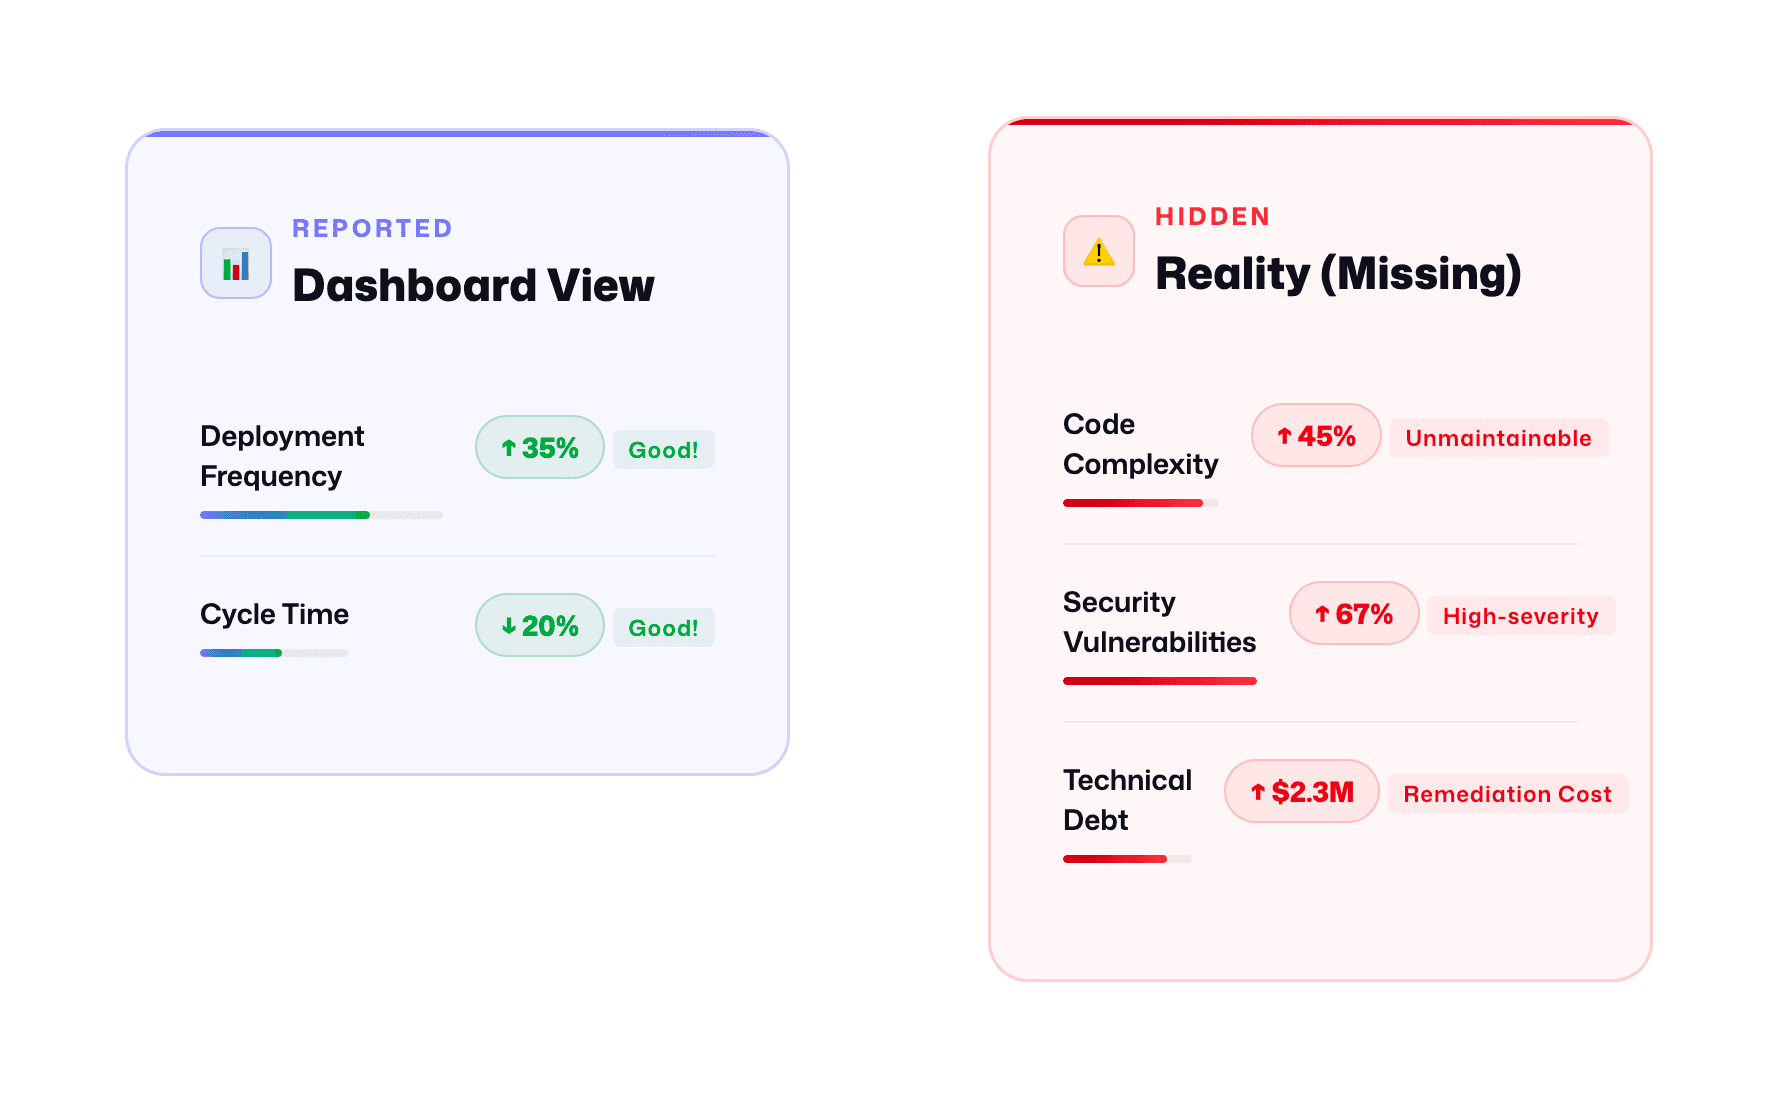
Engineering leaders spend thousands on developer productivity platforms expecting actionable insights. Instead, most get vanity metrics that teams either game or ignore, dashboards tracking commits and PRs that encourage box-checking over quality, retrospective reports that arrive too late to prevent delivery slips, and context-free numbers that mislead more than they inform.
The challenge isn't measuring productivity, it's finding reliable metrics that actually predict delivery success. Reliable metrics are real-time, gaming-resistant, contextually aware, and embedded in your workflow. They measure outcomes like code health and review thoroughness, not activity like lines of code or story points.
This guide evaluates productivity vendors against a reliability framework built for engineering leaders managing 100+ developer teams. You'll see why traditional platforms fall short, how to assess vendor claims, and why unified code health approach delivers the most trustworthy productivity insights without surveillance theater or tool sprawl.
Why Most Developer Productivity Metrics Aren't Reliable
Traditional productivity platforms measure the wrong things in ways that actively undermine team performance. Three failure modes destroy metric reliability:
Surveillance Theater: When Activity Tracking Destroys Trust
Platforms tracking commits, lines of code, and PR counts measure developer activity rather than delivery outcomes. Teams predictably optimize for metrics instead of results:
Developers split meaningful PRs into trivial ones to boost velocity
Commit counts rise while code quality declines
Engineers avoid complex refactoring that tanks productivity scores
Code reviews become rubber-stamps to maintain throughput numbers
The real cost isn't just metric gaming, it's eroded trust. When developers feel surveilled rather than supported, they disengage from improvement processes.
Lagging Indicators: Retrospectives That Arrive Too Late
DORA metrics (deployment frequency, change failure rate, lead time) are valuable for trends but fundamentally retrospective. By the time you see cycle time increased 30% last month, the sprint is over, the team has moved on, and context has evaporated.
Without real-time insights during development, lagging indicators become expensive reporting exercises that don't actually improve delivery.
Context-Free Aggregation: When Numbers Mislead
Rolling up metrics across teams, projects, and codebases without accounting for differences produces technically accurate but practically meaningless numbers. Platform teams have longer cycle times than feature teams, not because they're less productive, but because infrastructure work has different risk profiles. Legacy monoliths have lower velocity than greenfield services due to complexity tax, not skill gaps.
When vendors aggregate these contexts into single numbers, engineering leaders lose the ability to make informed decisions.
What Reliable Productivity Metrics Actually Look Like
Reliable metrics aren't about abandoning measurement, they're about measuring what predicts delivery success through leading indicators that are contextual, non-gameable, and workflow-embedded.
The Six Pillars of Metric Reliability
1. Decision-Grade Accuracy
Metrics must be precise enough to inform resource allocation and architectural decisions. A "cycle time" metric conflating PR creation with first commit isn't decision-grade—it's misleading.
2. Stable Under Normal Variance
Day-to-day fluctuations shouldn't trigger false alarms. If your dashboard shows 40% drops because engineers took PTO, the metric lacks statistical robustness.
3. Gaming-Resistant by Design
The moment you measure commits or story points, teams optimize for the metric. Reliable metrics focus on outcomes that can't be faked: code complexity trends, security debt accumulation, review thoroughness measured by issue detection rate. If developers can improve scores without improving code health, the metric is broken.
4. Contextualized to Your Reality
A 10-day cycle time might be excellent for regulated fintech or concerning consumer mobile apps. Reliable metrics explain why numbers changed, rising complexity, team composition shifts, not just what changed.
5. Actionable at PR/Sprint Timescales
Retrospective dashboards don't help teams improve this sprint. Reliable metrics surface insights during development: "This PR introduces high-complexity functions that historically correlate with 3x bug rates." Actionability requires real-time analysis in workflow.
6. Aligned with Quality and Security Outcomes
The ultimate test: do metric improvements predict better business outcomes? If "productivity gains" coincide with rising bug rates or security vulnerabilities, you're measuring the wrong things.
The Code Health Alternative
Reliable metrics start with a different question: instead of "how much are developers doing?" ask "how healthy is the code they're producing?" Code health metrics, complexity trends, security posture, review effectiveness, are inherently more reliable because they:
Can't be gamed (you can't fake low cyclomatic complexity)
Predict outcomes (rising complexity correlates with production incidents)
Provide context (AI explains why health metrics changed)
Operate in real-time (surface insights during PR review)
Align incentives (developers want to ship healthy code)
The Reliability Framework: Evaluating Vendors
Evaluate productivity vendors against four criteria that separate actionable insights from noise:
Criterion 1: Actionable in Real Time
What to ask:
"Show me how developers see metrics during their workflow—in PRs or separate dashboards?"
"If cycle time spikes, when does the team learn about it?"
"Can you surface insights at repo level where teams work, or only org level?"
Evidence to request:
Integration architecture showing where metrics surface
Latency specifications (sub-minute response times)
Screenshots of PR-level interventions
Pilot test:
Developers receive feedback within 5 minutes of PR creation
60%+ of issues fixed before merge
Team leads identify bottlenecks within same sprint
Zero manual report generation
CodeAnt AI advantage: AI-powered PR review delivers security, quality, and complexity insights within minutes. Developers fix issues before human review; leaders see real-time trends without separate dashboards.
Criterion 2: Gaming Resistance
What to ask:
"What prevents developers from splitting PRs to boost productivity scores?"
"How do you distinguish refactoring from feature work in LOC metrics?"
"Can you detect shallow reviews—approvals without meaningful feedback?"
Evidence to request:
Metric definitions showing outcome-based measures (defect escape rate, security debt reduction) over activity-based ones
Gaming detection mechanisms for suspicious patterns
Customer examples where teams tried gaming metrics
CodeAnt AI advantage: Code health metrics can't be faked. You can't game "cyclomatic complexity reduced 15%" without actually simplifying code.
Criterion 3: Contextual Awareness
What to ask:
"If cycle time increases 30%, does your platform explain why?"
"How do you differentiate critical payment services from internal tools?"
"Can you segment by team, repo maturity, or service tier?"
Evidence to request:
Contextual metadata schema (repo age, team size, criticality)
Segmentation capabilities by team or service tier
Recommendation engine examples
CodeAnt AI advantage: AI-powered analysis understands codebase context—identifying high-risk files needing thorough review, flagging complexity accumulation in critical services, adjusting recommendations by repo maturity.
Criterion 4: Developer Trust
What to ask:
"Can managers see individual metrics or only team aggregates?"
"Are metric definitions transparent or proprietary?"
"What privacy controls exist?"
Evidence to request:
Privacy policy and data access controls
Transparent metric definitions
Developer adoption metrics (not just manager usage)
CodeAnt AI advantage: Metrics focus on code health and process improvement, never individual surveillance. Developers see AI feedback as expert review helping them write better code, not activity tracking.
Vendor Landscape: Three Measurement Philosophies
The developer productivity market has three distinct approaches, each with inherent reliability gaps:
1. Workflow Dashboards (DX, LinearB, Jellyfish)
What they measure: Process metrics, DORA indicators, cycle time, deployment frequency, PR throughput from Git, Jira, and CI/CD pipelines.
Reliability breakdown:
Retrospective by design, show last sprint, not today's PR
Activity-based, tracking commits and PRs incentivizes gaming
Context-blind, 2-day cycle time looks identical whether code is clean or riddled with security debt
Tool sprawl, requires 3-4 additional platforms (SonarQube, Snyk, GitHub Advanced Security) for code health
2. Code Quality Scanners (SonarQube, Snyk Code, DeepSource)
What they measure: Static analysis, bugs, vulnerabilities, code smells, technical debt.
Reliability breakdown:
No productivity context, identifies 500 issues but doesn't explain why cycle time increased
Slow feedback, CI/CD scans arrive after code is written
Noise overload, legacy codebases generate thousands of warnings teams ignore
Disconnected from workflow, separate dashboards developers rarely visit
3. Unified Code Health Platforms (CodeAnt AI)
What they measure: Productivity through code health, embedded AI-powered analysis in pull request review where code quality, security, and delivery speed intersect.
Why this delivers reliable metrics:
Leading indicators, complexity, review thoroughness, and security debt predict delivery problems before they cause delays
Real-time intervention, AI catches issues during PR review when fixing takes minutes not days
Outcome-based measurement, tracks code maintainability, security posture, review effectiveness (not gameable commit counts)
Unified view, single platform connects code health to productivity outcomes, eliminating tool sprawl
Traditional Productivity Dashboards: Where Reliability Breaks
Platforms like DX, LinearB, and Jellyfish excel at executive reporting and DORA visualization but create three critical reliability gaps:
1. Retrospective Insights Arrive Too Late
Dashboards aggregate data weekly or monthly. By the time you notice cycle time jumped 30%, the problematic code has merged and the team moved on. Without code-level context, you can't determine if the increase came from:
High-risk refactoring requiring extra scrutiny
Degraded review quality letting bugs through
Technical debt accumulating to where every change touches fragile code
2. Activity-Based Metrics Encourage Gaming
When platforms track commits, PRs, lines changed, or story points, teams optimize for metrics rather than outcomes:
Split meaningful PRs into artificially small chunks
Inflate story point estimates
Rush reviews to hit throughput targets
Batch trivial commits to maintain activity levels
Your dashboard shows deployment frequency up 40%, but production incidents doubled because reviews became rubber stamps.
3. Missing Code Health Context
Traditional platforms operate separately from code quality and security tools. They tell you how fast code moves but not what condition it's in when it ships:
To get complete pictures, organizations layer 3-4 additional tools, each generating separate alerts and dashboards. Engineering leaders spend hours correlating data across platforms, trying to answer: "Did improved cycle time come at code quality's cost?"
Code Quality Platforms: The Productivity Gap
Static analysis platforms like SonarQube and Snyk Code excel at deep inspection, catching bugs, tracking technical debt, and identifying vulnerabilities. But when measuring developer productivity, they hit fundamental limitations.
The Noise Management Problem
Legacy codebases generate thousands of existing issues. Initial scans show:
Critical Issues: 127
Major Issues: 1,843
Code Smells: 8,932
Technical Debt: 487 days
Now teams face impossible choices: halt features to address 15,423 issues? Suppress them all and lose visibility into real risks? These platforms measure issue presence but not the cost of managing them, teams lose 25% velocity configuring quality gate exceptions and investigating false positives.
Issue Counts Don't Predict Delivery Success
Static analysis operates reactively, identifying problems after code is written:
Metric | What It Measures | What It Misses |
Code Coverage | % lines executed by tests | Whether tests validate behavior; coverage can increase while quality decreases |
Technical Debt Ratio | Estimated remediation time | Which debt actually blocks delivery; not all debt is equal |
Security Vulnerabilities | Known CVEs | Operational impact; critical vulns in unused code don't affect delivery |
These metrics lack delivery context. A codebase with 10% duplication might be highly productive if duplication is in stable utility code. Another with 3% duplication might bottleneck if it's in critical business logic requiring synchronized changes.
The Missing Link: Risk-Based Prioritization
When SonarQube flags 1,843 "major" issues, which 10 should your team address this sprint? The platform can't tell you because it doesn't understand churn rate, review patterns, deployment correlation, or team expertise.
Checkout the best SonarQube alternative.
CodeAnt AI: Unified Code Health as Reliable Productivity Metrics
CodeAnt AI takes a fundamentally different approach: measuring productivity through code health, anchoring metrics to outcomes like review quality, security posture, and maintainability rather than developer activity.
Why Code Health Metrics Are More Reliable
Traditional dashboards track lagging indicators. CodeAnt AI's metrics are leading indicators tied to code outcomes:
Review thoroughness (issues AI caught vs. human reviewers missed) predicts production bug rates 2-3 sprints ahead
Security debt accumulation (unresolved vulnerabilities, exposed secrets) signals deployment delays before they happen
Code complexity trends identify bottlenecks while there's time to refactor
Maintainability scores forecast where teams will slow down under feature pressure
These aren't vanity metrics, they're causal explanations embedded in workflow. When cycle time increases, CodeAnt AI tells you why: "Review quality dropped 18% as complexity in payment-service increased; 3 PRs merged with unresolved security issues."
Real-Time Insights Where Behavior Changes
CodeAnt AI operates at PR-time, the only moment developers can actually change behavior:
AI-Powered Code Review
Automatically reviews every PR for security vulnerabilities, secrets exposure, and quality issues
Generates concise summaries explaining what changed, why it matters, what risks it introduces
Suggests specific fixes with code snippets
# Example: CodeAnt AI PR comment
Security Risk: High
- Hardcoded AWS credentials in config/database.yml (line 47)
- Fix: Move to environment variables or AWS Secrets Manager
Quality Issue: Medium
- Cyclomatic complexity of processPayment() increased from 12 to 18
- Refactor: Extract validation logic into separate methods
This isn't just faster than waiting for CI/CD, it's contextually aware. CodeAnt AI knows your organization's standards, understands your codebase's risk profile, and learns from past reviews.
DORA Metrics With Code Health Context
CodeAnt AI connects DORA metrics to code health factors that influence them:
Deployment Frequency: Correlated with review quality (teams catching issues early deploy more) and technical debt levels
Lead Time: Broken down by code complexity, review bottlenecks, and security remediation delays
Change Failure Rate: Linked to specific patterns (PRs merged with unresolved issues, insufficient coverage)
Time to Restore: Analyzed alongside incident root causes (which vulnerabilities caused outages, which areas are fragile)
Instead of "deployment frequency dropped 15%," you get "deployment frequency dropped because review quality declined in auth-service (complexity +22%, coverage -8%) and 4 high-severity vulnerabilities blocked 3 releases."
The Unified Platform Advantage
Traditional setups require 3-4 tools: DORA dashboard, code quality platform, security scanner, review automation. Each generates separate metrics that don't connect. CodeAnt AI delivers all four in one unified view:
One dashboard showing how review quality, security posture, and technical debt affect delivery speed
One AI model understanding your entire codebase and learning from every review
One set of metrics engineering leaders trust and developers actually improve against
This isn't just convenient, it's structurally more reliable. When metrics come from a unified platform seeing the whole picture, they're contextually accurate in ways stitched-together dashboards can never be.
Vendor Reliability Scorecard
Vendor | Real-Time | Gaming Resistance | Context Awareness | Developer Trust | Best For |
CodeAnt AI | ★★★★★ PR-level | ★★★★★ Code outcomes | ★★★★★ AI-powered | ★★★★★ Workflow-embedded | Teams needing reliable leading indicators without tool sprawl |
DX/LinearB | ★★★☆☆ Retrospective | ★★★☆☆ Process-focused | ★★★☆☆ Trend analysis | ★★★★☆ Automation-first | Orgs prioritizing workflow automation and DORA reporting |
SonarQube | ★★☆☆☆ CI/CD gates | ★★★★★ Quality outcomes | ★★★★☆ Technical debt | ★★★☆☆ Separate tool | Enterprises with dedicated quality engineering teams |
Snyk | ★★★★☆ PR checks | ★★★★☆ Security posture | ★★★☆☆ Vulnerability context | ★★★★☆ Dev-friendly | Security-first orgs needing supply chain protection |
Choose CodeAnt AI's unified approach when you need reliable leading indicators without tool sprawl, when you're tired of waiting weeks for retrospective metrics, juggling 4-5 tools to understand code health vs. delivery speed relationships, and watching developers game activity-based metrics instead of improving outcomes.
Implementation Without Breaking Trust
Rolling out metrics requires governance, transparency, and clear commitment to improvement over surveillance:
Four Non-Negotiables
1. Start Team-Level, Never Individual
Aggregate at team or service level, not individuals. Measure code health and delivery outcomes for squads. CodeAnt AI defaults to team-level aggregation—you can't accidentally create developer leaderboards.
2. Publish Metric Definitions
Document what each metric measures, why it matters, how it's calculated, and what it doesn't measure. Create a living metrics glossary accessible to all engineers. Transparency transforms metrics from black-box surveillance into shared improvement tools.
3. Establish "Improvement-Only" Policy
Declare explicitly: metrics will never be used for performance reviews, promotions, or headcount justification. This policy must come from executive leadership and be reinforced consistently.
4. Pair Metrics with Enablement
For every metric tracked, provide automation to help teams improve:
Code complexity → auto-refactoring suggestions
Security posture → automated vulnerability fixes
Review thoroughness → AI-powered review summaries
Test coverage gaps → auto-generated test scaffolding
CodeAnt AI doesn't just measure code health, it actively improves it. When complexity spikes, it suggests refactoring. When security issues appear, it proposes fixes.
Rollout Sequence
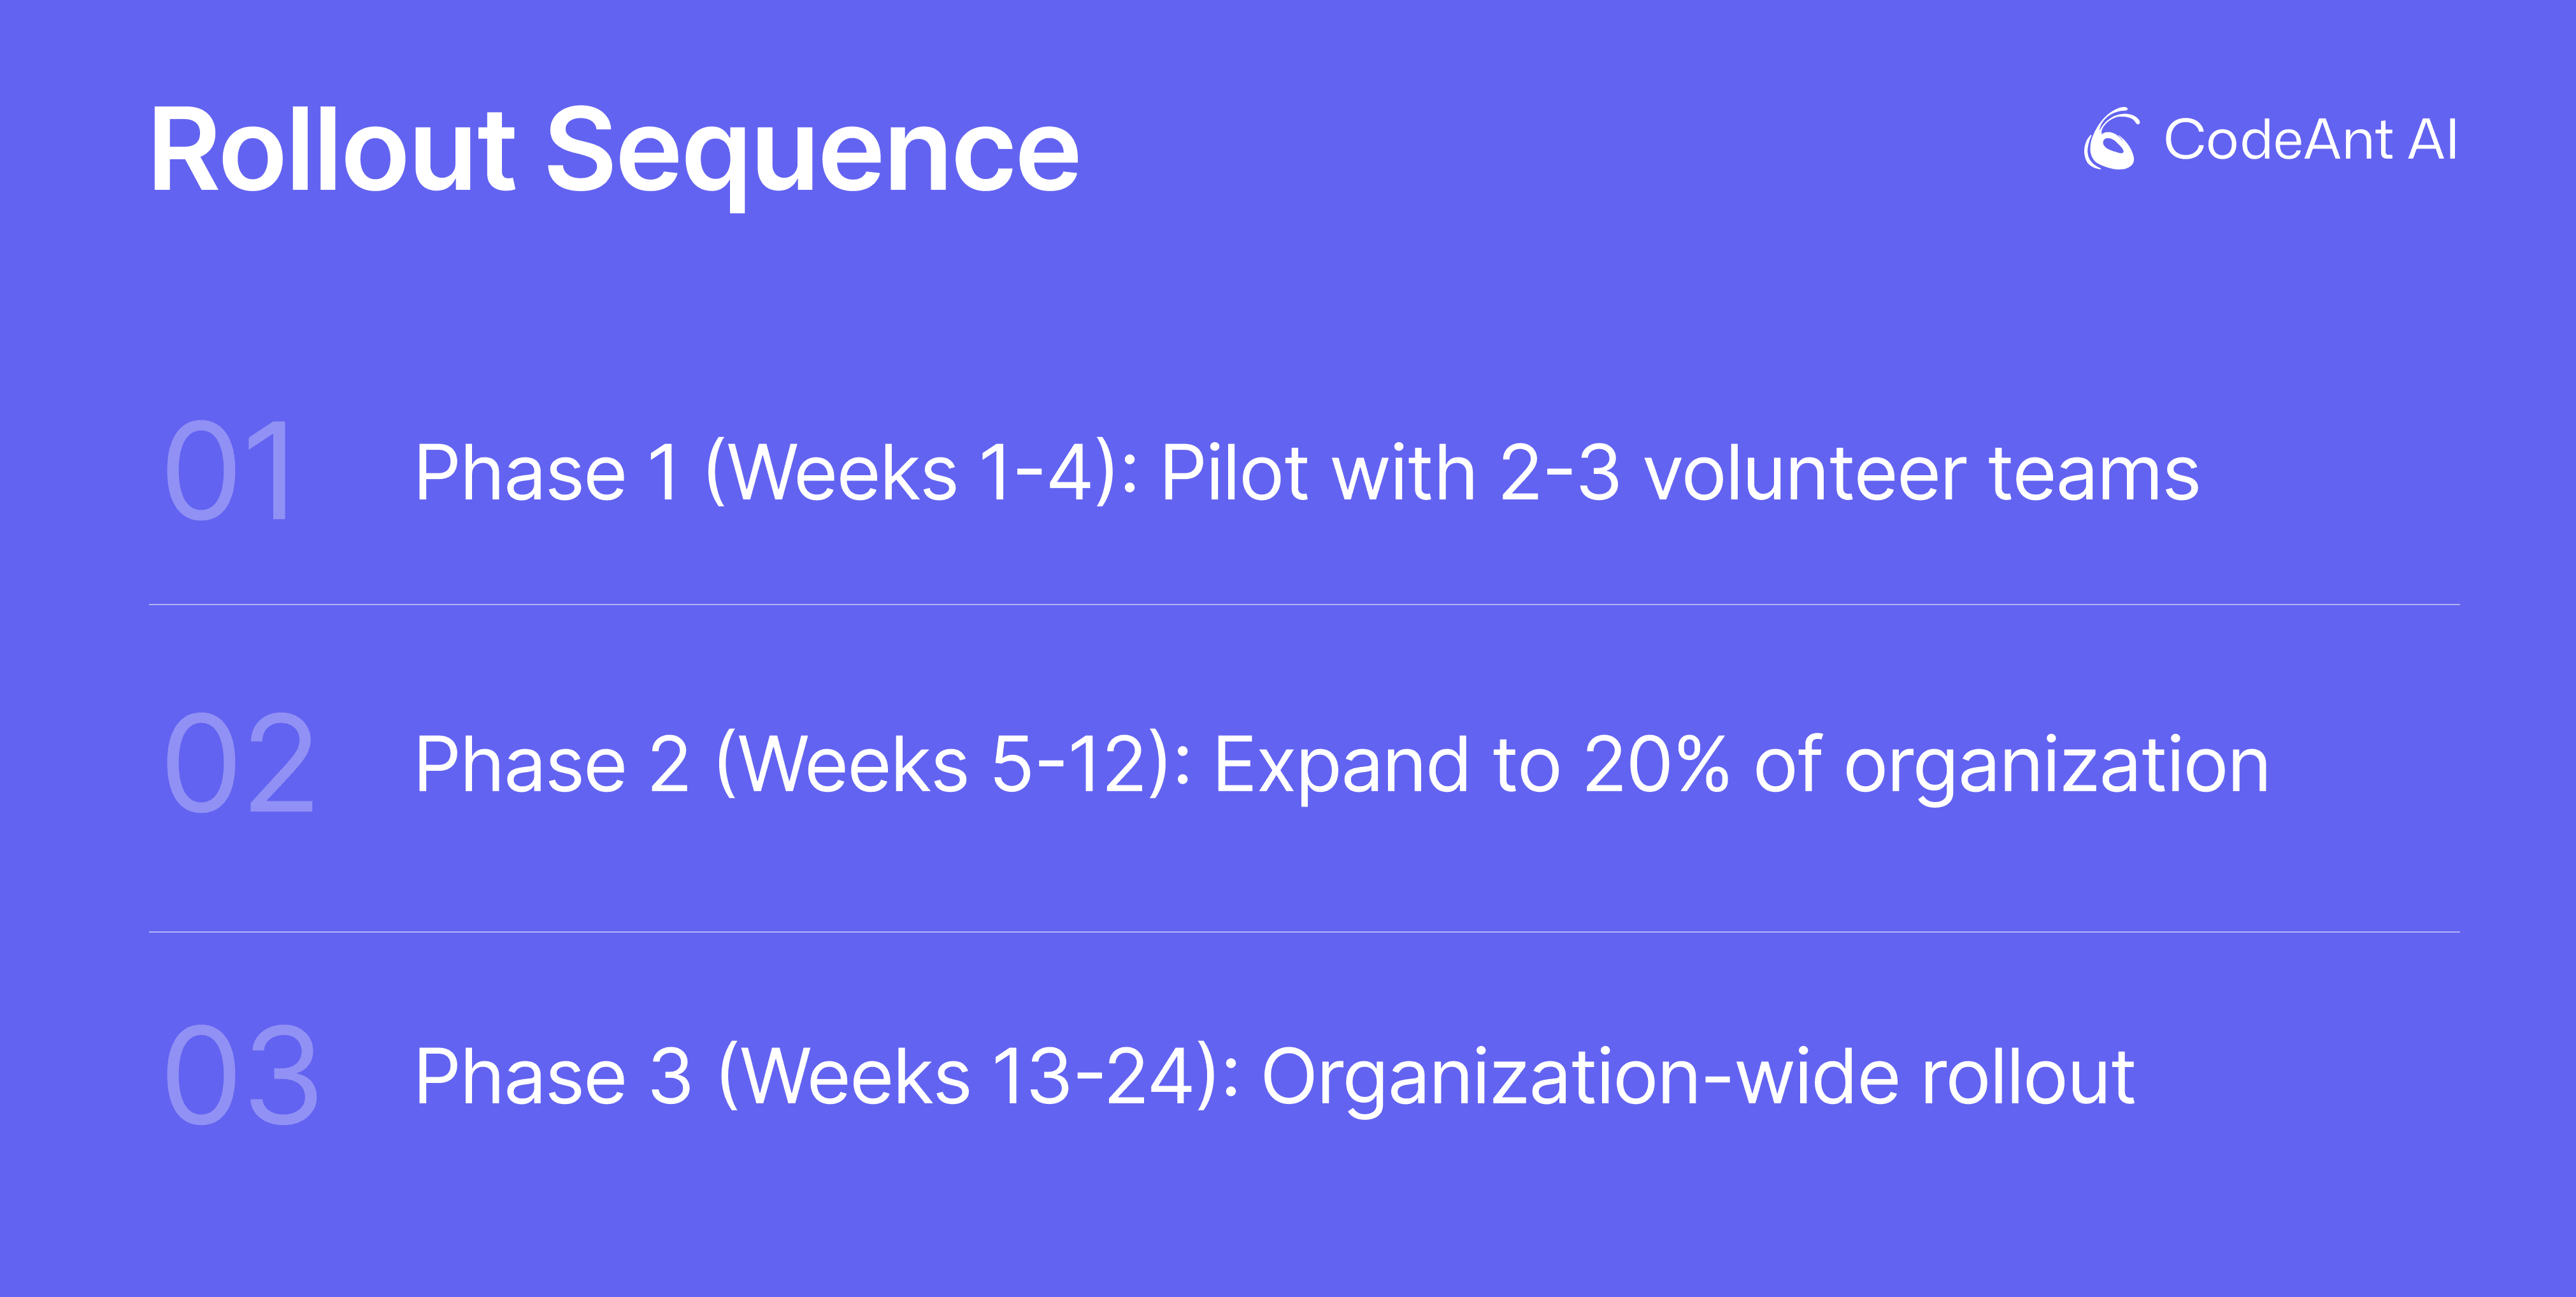
Phase 1 (Weeks 1-4): Pilot with 2-3 volunteer teams
Deploy full metric suite, gather feedback, iterate on definitions and thresholds.
Phase 2 (Weeks 5-12): Expand to 20% of organization
Target teams with known process pain points, pair metrics with targeted enablement.
Phase 3 (Weeks 13-24): Organization-wide rollout
Deploy to remaining teams in cohorts, provide onboarding sessions, launch quarterly metric reviews.
The Bottom Line
Reliable productivity measurement requires outcome-tied, context-aware metrics embedded in your workflow, not retrospective dashboards or activity tracking. Traditional dashboards deliver lagging indicators teams game; code scanners identify issues but don't translate to productivity decisions. CodeAnt AI combines code health signals with real-time interventions at PR time, producing leading indicators that predict delivery success while improving code quality, security posture, and review efficiency simultaneously.
Your Next Steps
Evaluate your current stack:
Score your existing tools against the reliability criteria
Identify gaps: leading or lagging? Gaming-resistant or easily manipulated?
Run a focused pilot:
Select 2-3 teams and one critical repo for 2-week comparison
Measure review cycle time, defect escape rate, developer sentiment before/after
Track whether insights arrive at PR time or in retrospective
Experience unified code health:
Start 14-day free trial with CodeAnt AI
See how automated PR reviews, security scanning, and productivity metrics converge into a single source of truth
Compare against your current stack using the reliability framework
Stop paying for dashboards your team ignores. Experience how AI-driven code health delivers reliable productivity metrics engineering leaders actually need, without surveillance theater or tool sprawl.
FAQs
Are DORA metrics enough to measure developer productivity?
Can productivity metrics be used for performance reviews without destroying trust?
How do you prevent metric gaming?
How do you handle legacy code without drowning in noise?
How quickly can you see meaningful signals?


