AI Code Review
Best Tools for Tracking Developer Performance Metrics in 2026

Sonali Sood

Founding GTM, CodeAnt AI
Most engineering leaders are tracking the wrong signals. They're measuring commit velocity and PR counts while AI assistants quietly rewrite 40% of their codebase. They're juggling five disconnected tools, GitHub for commits, Jira for delivery, SonarQube for quality, Snyk for security, yet still can't answer: Is our code getting healthier or riskier with every sprint?
Traditional developer metrics tools were built for a world where humans wrote every line and "productivity" meant counting commits. In 2026, that playbook is broken. You need platforms that understand AI-generated code, connect delivery speed to security posture, and turn metrics into action, not dashboards that show problems without fixing them.
This guide evaluates the best tools for tracking developer performance metrics. More importantly, it shows you how to choose based on team size, tech stack, and whether you need passive tracking or active code health improvement.
Why Traditional Metrics Tools Fail in the AI Era
The AI Coding Assistant Blind Spot
Traditional metrics assume developers write 100% of code. But in 2026, 40–60% of code is AI-generated, and legacy tools can't distinguish between human logic and AI boilerplate.
This creates critical distortions:
Inflated velocity: A developer using Copilot commits 3x more code, but is that productivity or just AI scaffolding?
Misleading churn: AI-suggested refactors get flagged as negative churn when they improve maintainability
False comparisons: Comparing Cursor users against vanilla VS Code users penalizes tool adoption, not engineering impact
What's needed: AI-aware analytics that tag AI contributions, normalize velocity across toolchains, and focus on outcomes, code health, review quality, incident reduction, rather than activity proxies.
The Tool Sprawl Tax
Walk into most 100+ developer organizations and you'll find a Frankenstein stack:
Jira/Linear for delivery
SonarQube/Snyk for quality and security
Datadog/New Relic for observability
Custom dashboards to stitch it together
The hidden cost isn't the $150K–$300K in annual subscriptions, it's the opportunity cost:
Hidden Cost | Impact on 100-Dev Team |
Integration maintenance | 2–4 engineering weeks/quarter maintaining APIs and webhooks |
Data silos | Security findings don't correlate with deployment frequency |
Context-switching | Engineers toggle between 5+ tools to understand one issue |
Alert fatigue | Disconnected notifications drown out signal |
For a 150-person team, the real cost is $400K–$600K annually in tool sprawl, integration overhead, and lost engineering time.
Metrics That Don't Drive Action Are Just Theater
Most platforms are passive observers. They'll tell you:
"Your PR review time is 18 hours" (but not why or how to fix it)
"Code complexity increased 15%" (but not which files or how to refactor)
"You have 47 high-severity vulnerabilities" (but not which matter in your context)
Why this happens:
No root cause analysis, tools show symptoms without diagnosing causes
No prioritization intelligence, 200 security findings without exploitability context
No remediation path, engineers research solutions manually
Teams drown in data but starve for insight. Metrics become reporting exercises, not improvement engines.
The Metrics Framework That Predicts Success
Before evaluating tools, understand what you're measuring, and why. The framework that matters in 2026 combines three dimensions:
DORA Metrics: Delivery Performance Baseline
The industry standard for measuring software delivery:
Deployment Frequency: How often you ship to production
Lead Time for Changes: Time from commit to production
Change Failure Rate: Percentage of deployments causing incidents
Mean Time to Recovery (MTTR): How quickly you restore service
Elite performers deploy on-demand (multiple times daily), with lead times under one hour, change failure rates below 15%, and MTTR under one hour.
Tool requirements: Integration with CI/CD pipelines, deployment tracking systems, and incident management (PagerDuty, Opsgenie) for automated data capture.
Code Health Metrics: Quality and Security
DORA tells you how fast you ship, not whether what you're shipping is maintainable or secure:
Cyclomatic Complexity: High complexity = hard to test and maintain
Code Duplication: Duplication = bug multiplication
Test Coverage: Percentage of code exercised by tests
Vulnerability Density: Security issues per thousand lines
Secret Exposure: Hardcoded credentials in source code
Dependency Risk: Outdated libraries with known CVEs
Tool requirements: Continuous static analysis on every commit, context-aware detection to reduce false positives, and auto-fix capabilities that suggest or apply fixes.
Developer Experience Metrics: Team Sustainability
The SPACE framework showed that developer experience directly impacts productivity and retention:
PR Review Response Time: Time to first review comment
PR Merge Time: Time from creation to merge
Merge Conflict Frequency: Integration pain points
After-Hours Activity: Burnout and attrition predictor
AI Assistance Effectiveness: Time saved vs. time spent fixing
Tool requirements: Passive tracking of PR lifecycle, commit timestamp analysis for work patterns, and AI-aware instrumentation distinguishing humans from AI code.
Key takeaway: The metrics that predict success aren't lines of code or commit velocity. They're delivery speed, code reliability, and team sustainability, measured at the team level, not individual surveillance.
Best Tools by Category (Ranked)
Productivity & Engineering Analytics Platforms
LinearB – Best for DORA metrics and delivery visibility
Strengths:
Automated DORA tracking with minimal configuration
WorkerB automation for PR reminders and workflow optimization
Executive dashboards translating engineering work to business impact
Strong Jira, GitHub, GitLab, Slack integrations
Gaps:
No code quality analysis (need SonarQube)
No security scanning (need Snyk)
No AI-aware analytics
Shows what is slow, not why or how to fix it
Setup: 2-3 days initial configuration
Pair with: SonarQube for quality, Snyk for security
Jellyfish – Best for engineering investment allocation
Strengths:
Engineering investment tracking across teams and initiatives
Alignment metrics connecting work to business objectives
Capacity planning for headcount justification
Multi-source aggregation (Git, Jira, PagerDuty, Slack)
Gaps:
No code-level insights
No automated remediation
Expensive for mid-market teams
Shows what teams work on, limited guidance on how to improve
Setup: 1-2 weeks for taxonomy definition
Pair with: Code quality platform, security scanner
Swarmia – Best for developer experience monitoring
Strengths:
Developer-centric metrics: flow state, focus time, meeting overhead
PR review analytics with bottleneck identification
Team health surveys integrated with quantitative metrics
Lightweight setup
Gaps:
Limited security and quality coverage
No automated fixes
Smaller integration ecosystem
Strong on diagnosing DevEx problems, weak on solutions
Setup: 1-2 days
Pair with: SonarQube for quality, Snyk for security, AI review tool
Code Quality & Security Platforms
SonarQube/SonarCloud – Best for code quality enforcement
Strengths:
Comprehensive static analysis across 30+ languages
Technical debt quantification (time to fix)
Security hotspot detection (OWASP Top 10)
Self-hosted or cloud options
Gaps:
No delivery velocity metrics
High false positive rate (30-40%)
No cross-platform support (separate instances per Git provider)
Generic fix guidance, not context-aware auto-fixes
Setup: 1-2 weeks for CI/CD integration
Pair with: DORA metrics platform, security scanner, AI review tool
Checkout the best SonarQube alternative.
Snyk – Best for security vulnerability detection
Strengths:
Real-time security scanning with IDE and PR integration
Dependency vulnerability tracking with license compliance
Container and IaC scanning
Developer-friendly fix suggestions
Gaps:
No code quality metrics (complexity, duplication)
No delivery velocity tracking
Limited AI-aware analytics
Excellent for known vulnerabilities, limited for systemic security debt
Setup: 1-2 days
Pair with: Code quality platform, DORA metrics tool
Checkout the best Synk alternative.
GitHub Advanced Security – Best for GitHub-native teams
Strengths:
Native GitHub integration, zero external tools
CodeQL semantic analysis
Secret scanning with push protection
Dependabot for automated security updates
Gaps:
GitHub-only (no GitLab, Bitbucket, Azure DevOps)
No code quality beyond security
Limited customization
Weak on prioritization and business impact
Setup: Seamless for GitHub users
Pair with: Code quality platform, DORA tracking tool
Checkout the best Github Advanced Security alternative.
Unified Code Health Platform
CodeAnt AI – Best for eliminating 3-5 point solutions
Why it's different: CodeAnt AI consolidates the entire metrics stack, productivity, quality, security, and AI-aware analytics, into a single platform that turns detection into remediation at PR time.
Comprehensive coverage:
DORA metrics: Deployment frequency, lead time, change failure rate, MTTR through automated deployment correlation
Code quality: Complexity, duplication, coverage, maintainability with trend analysis
Security posture: Vulnerabilities, secrets, misconfigurations, dependency risks with severity-based prioritization
DevEx metrics: PR review time, merge conflicts, after-hours activity
AI-aware analytics:
Distinguishes human-written from AI-generated code (Copilot, Cursor)
Adjusts velocity metrics to account for AI assistance
Tracks AI adoption patterns and correlates with quality outcomes
Metrics-to-action bridge:
AI-powered PR reviews that suggest context-aware fixes
Automated security remediation for common vulnerabilities
Root cause analysis explaining why metrics degrade
Next-best-action recommendations based on team patterns
Cross-platform support:
Native GitHub, GitLab, Bitbucket, Azure DevOps integration
Unified dashboard across all repos regardless of provider
Consistent quality gates enforced everywhere
Real-world impact:
Series B SaaS (150 devs): Reduced PR review time from 18 hours to 4 hours by auto-fixing 60% of issues
Enterprise fintech (500+ devs): Eliminated $2.4M in annual tool costs replacing LinearB + SonarQube + Snyk
Healthcare startup VP: Justified 15-person headcount with 40% reduction in change failure rate
Setup: 1-2 days across multiple Git providers
Pair with: Nothing, that's the point
Comparison Table
Capability | LinearB | SonarQube | Snyk | GitHub Advanced Security | CodeAnt AI |
DORA Metrics | ✅ | ❌ | ❌ | ⚠️ | ✅ |
Code Quality | ❌ | ✅ | ❌ | ❌ | ✅ |
Security Scanning | ❌ | ⚠️ | ✅ | ✅ | ✅ |
AI-Aware Analytics | ❌ | ❌ | ❌ | ❌ | ✅ |
Automated Fixes | ⚠️ | ❌ | ⚠️ | ⚠️ | ✅ |
Cross-Platform | ✅ | ⚠️ | ✅ | ❌ | ✅ |
False Positive Rate | N/A | High (30-40%) | Moderate (20-30%) | Moderate | Low |
Metrics-to-Action | ⚠️ | ⚠️ | ✅ | ⚠️ | ✅ |
Setup Time | 2-3 days | 1-2 weeks | 1-2 days | Immediate | 1-2 days |
Annual Cost (100 devs) | $50-75K | $40-60K | $60-80K | $21K | Contact sales |
Book your 1:1 with our experts to see how CodeAnt AI consolidates your metrics stack while driving real code health improvements.
Decision Framework: Choosing the Right Tool
Team Size Decision Tree
Under 50 developers: Start with native platform tools (GitHub Insights, built-in CI/CD metrics). Avoid specialized tools requiring dedicated admin time. Plan for scale by choosing platforms with cross-repo support.
50–150 developers: This is the danger zone for tool sprawl. Bias toward unified platforms providing cross-repository visibility, native SCM integration, and AI-aware analytics. The integration tax becomes quantifiable here.
100+ developers: Consolidation ROI is highest. Calculate your savings:
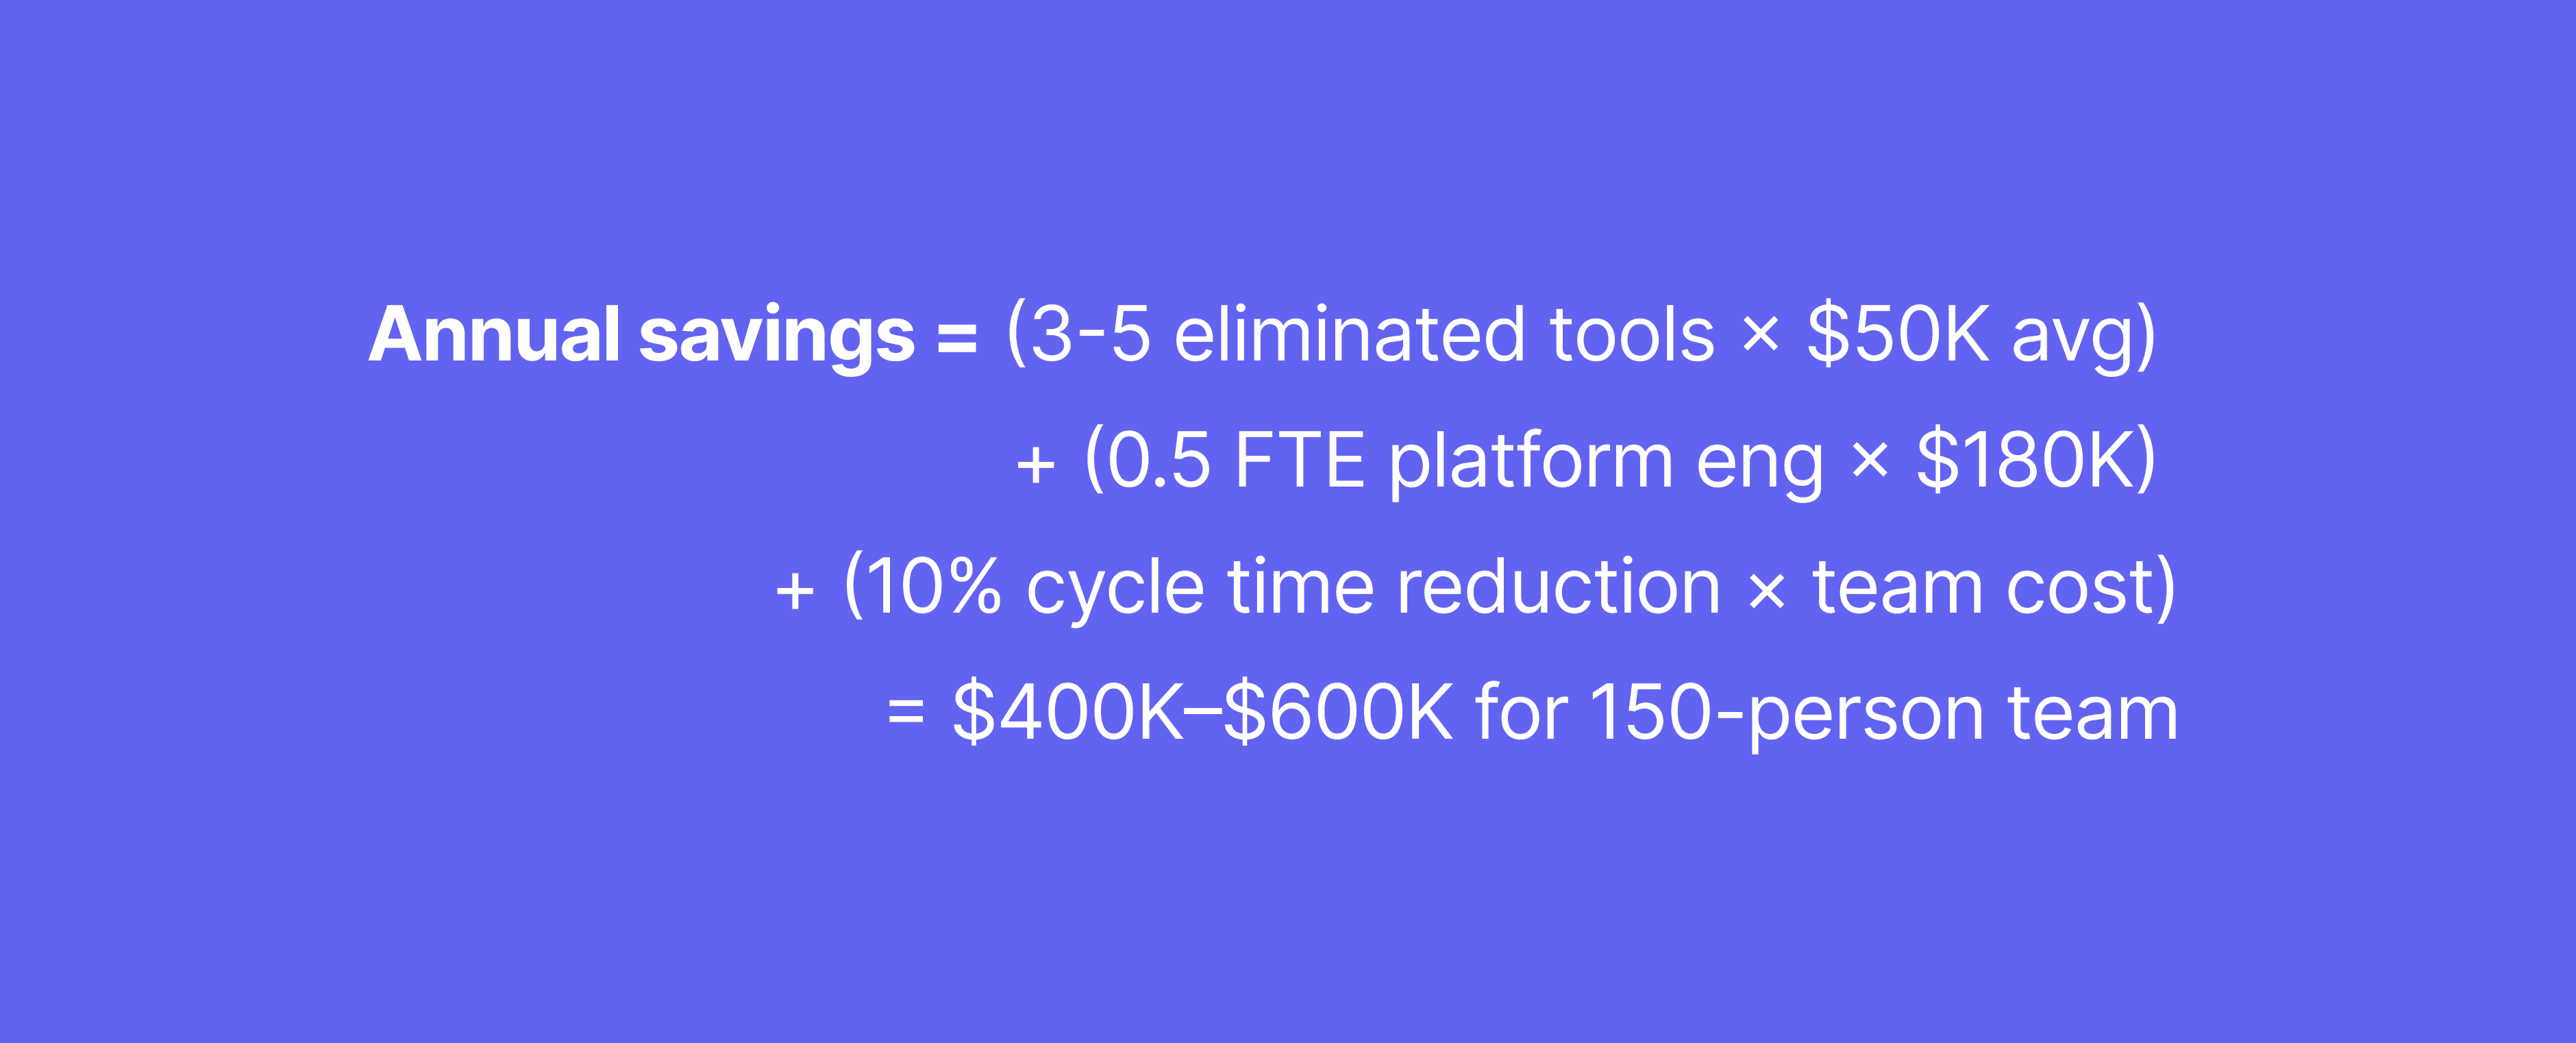
Prioritize unified platforms with code health spanning quality, security, and productivity.
Pragmatic Scoring Model
Capability | Weight | Why It Matters |
Cross-platform SCM support | 25% | Avoids vendor lock-in; supports M&A |
AI-aware analytics | 20% | Accurate velocity tracking in AI era |
Code-level remediation | 20% | Turns metrics into action |
Unified metrics view | 15% | Eliminates tool sprawl |
API access & extensibility | 10% | Custom reporting |
Developer experience focus | 10% | Reduces friction and burnout |
If you score 70%+ on the top three capabilities, bias toward unified platforms rather than point solutions. The integration tax exceeds feature advantages within 12-18 months.
Red Flags That Disqualify Platforms
Vanity metrics: Emphasizes lines of code or commit count without context
Surveillance posture: Tracks individual activity rather than team bottlenecks
Poor API access: Proprietary data formats with no export capability
Brittle integrations: Breaks with SCM updates, requires constant maintenance
No AI consideration: Doesn't account for AI-generated code contributions
30-Day Implementation Quick Start
Week 1: Define Baseline Metrics
Pick 3-5 outcome-focused KPIs: PR review time, change failure rate, vulnerability density
Document explicit definitions (what counts as "deployment"?)
Align leadership and senior engineers on measurement goals
Week 2: Instrument and Validate
Connect VCS, CI/CD, and issue tracking systems
Run data quality audit: check deployment detection, team mappings, bot account filtering
Fix data issues before showing metrics to teams
Week 3-4: Share and Calibrate
Present baselines in team retrospectives (team-level only, no individual data)
State "no individual ranking" policy explicitly
Set alert thresholds at 75th percentile of baseline distribution
Launch weekly friction review meetings
Key principle: Start with team-level observation, no targets yet. Invite feedback on whether metrics reflect reality.
Conclusion: From Measurement to Improvement
The path forward is clear: consolidate your tooling, instrument AI-aware signals, and bake remediation directly into development workflows. The teams that win in 2026 don't have the most dashboards, they have the tightest feedback loops from metrics to action.
Your next steps:
Pick 6–10 core metrics spanning delivery speed, code quality, and developer experience
Run a 2-week baseline with current tooling to identify visibility gaps
Trial unified remediation with a platform that turns metrics into automatic PR-level improvements
Stop treating metrics as reporting exercises. Start treating them as the foundation for continuous improvement—with platforms that measure, diagnose, and fix simultaneously.
Ready to see unified code health in action?Start your trial at app.codeant.ai and experience how the right platform turns tracking into improvement, automatically, at scale, across your entire SDLC.
FAQs
Can these metrics be gamed?
How do we account for AI-generated code?
Should we measure individual developers?
How do we map incidents to code changes?
What about monorepos?


