AI Code Review
Which Vendor Leads Developer Productivity Metrics in 2026

Sonali Sood

Founding GTM, CodeAnt AI
You’re running SonarQube for code quality, Snyk for security, DX for developer surveys, and a custom DORA dashboard. Each tool shows a different slice of the problem, but none talk to each other, and none actually fix anything. When your VP asks which vendor delivers real ROI for developer productivity, the honest answer depends on whether you want more dashboards or actual improvements.
The market shifted in 2026. Engineering leaders managing 100+ developers stopped accepting fragmented point solutions that create data silos and context-switching overhead. They need platforms that connect code review, security, quality gates, and velocity metrics in a single view, then use AI to automatically resolve the bottlenecks those metrics reveal.
This guide evaluates leading vendors across capabilities that matter: unified visibility, automated fixes, AI-era readiness, security integration, and implementation speed.
Why Traditional Productivity Measurement Fails in the AI Era
DORA metrics remain essential, but they’re no longer sufficient. Here’s what broke:
AI-assisted coding invalidates volume assumptions. When 40% of your codebase comes from GitHub Copilot or Cursor, commit counts and lines-of-code become meaningless. A developer shipping 2,000 AI-generated lines might introduce more technical debt than one carefully crafting 200 maintainable lines. Your dashboard shows “increased velocity” while change failure rate climbs from 8% to 15%.
Tool sprawl creates blind spots. Most teams run 5–8 platforms: SonarQube for quality, Snyk for security, DX for surveys, custom DORA dashboards, and manual PR reviews. Each shows a slice of reality, but none connect the dots. When cycle time increases, you can’t tell if it’s security vulnerabilities blocking deployment, quality issues triggering rework, or review capacity constraints, because those signals live in different systems.
Retrospective-only visibility lags reality. Tools like Jellyfish and LinearB show last quarter’s cycle time but can’t predict which PRs will introduce merge conflicts, security risks, or quality regressions before they land. By the time you learn code review is a bottleneck, you’ve lost three sprints of velocity.
The fundamental issue: traditional platforms measure what happened without understanding why or how to prevent the next bottleneck.
The 360° Engineering Health Framework
Elite teams in 2026 measure code health as an interconnected system:
Dimension | What It Measures | Why It Matters |
Review Efficiency | Time-to-approval, review cycles, context-switching | Identifies knowledge transfer and approval bottlenecks |
Pre-Merge Risk | Security vulnerabilities, quality violations before ship | Prevents costly post-deployment fixes |
Maintainability | Complexity trends, duplication, test coverage | Predicts future velocity—quality compounds, debt decays |
DORA Metrics | Deployment frequency, lead time, MTTR, change failure rate | Validates health improvements translate to outcomes |
This framework recognizes security and quality don’t slow you down, they enable sustained velocity. Teams using 360° measurement reduce cycle time by 40% while improving change failure rates because they catch issues when they’re cheapest to fix: during review, not in production.
The shift to real-time, AI-driven insights changes what’s possible. Instead of quarterly reports showing “cycle time increased 15%,” modern platforms answer:
Predictive: “PR #847 has 73% merge conflict probability based on concurrent changes, suggest rebasing now”
Contextual: “This AI-generated auth logic bypasses your org’s rate-limiting pattern, flag for senior review”
Actionable: “12 PRs blocked on security approval; auto-fix these 3 OWASP issues to unblock 8 immediately”
The Fragmentation Tax: Why Point Solutions Don’t Scale
Most engineering organizations today run a familiar stack: DORA metrics (DX, Jellyfish, LinearB), code quality (SonarQube), security (Snyk), secrets detection, and custom scripts to tie it together. In practice, this creates a fragmented system where insights rarely translate to action.
Four Failure Modes
Data silos with no unified context
When quality metrics live in SonarQube, security in Snyk, and velocity in a separate dashboard, you lose cause-and-effect understanding. Did cycle time increase because of security debt? Are quality issues slowing reviews? Without unified visibility, you’re flying blind.
A VP at a 200-person team spends 8 hours weekly just correlating data across systems, exporting CSVs, building custom queries, creating Looker dashboards that break every API change.
Inconsistent definitions across tools
What counts as “critical”? SonarQube’s complexity definition differs from your standards. Snyk’s severity doesn’t align with your risk tolerance. Your DORA dashboard measures “deployment” differently than CI/CD does.
This wastes time debating methodology instead of fixing problems. When numbers don’t match between systems, engineers dismiss them as dashboard theater.
Integration upkeep becomes a second job
Every tool requires ongoing maintenance: API updates, authentication changes, custom logic for monorepos and microservices. A mid-market SaaS company had a platform engineer spending 40% of their time maintaining integrations between five code health tools, $60K+ annually before extracting value.
Insights without action: the “so what?” problem
SonarQube shows a function with a complexity of 47. Snyk flags a vulnerable dependency. Your DORA dashboard shows cycle time creeping up. Now what?
Developers still need to investigate root causes across tools, prioritize which issues matter, manually fix code, and verify fixes didn’t introduce new problems. When metrics don’t translate into faster, safer delivery, teams abandon the tools.
The “Best-of-Breed” Trap
Consider a typical PR workflow with fragmented tools:
PR #847 status checks:
✓ SonarQube: 3 code smells, 1 security hotspot
✓ Snyk: 2 high-severity vulnerabilities
✓ GitGuardian: No secrets detected
✓ Custom gate: Complexity threshold exceeded
⚠ DORA: PR increases cycle time by 2.3 days
The developer clicks into SonarQube, opens Snyk, checks the custom gate logic, correlates with DORA. Each context switch costs 5-10 minutes. Multiply across 50 PRs daily: 4-8 developer-hours lost to tool navigation, not counting cognitive load from four different interfaces.
What Elite Teams Actually Measure
Modern engineering organizations track metrics across four interconnected dimensions:
Review Velocity & Efficiency
Review cycle time: PR open to merge (target: <24 hours)
Pickup time: Time to first review (target: <4 hours)
Rework rate: PRs requiring multiple rounds (healthy: <30%)
PR size distribution: Lines changed (optimal: 200-400)
Pre-Merge Quality & Security
Pre-merge vulnerability findings vs. post-deployment
Code complexity trends and maintainability index
Duplication rate (target: <5%)
Test coverage delta with minimum thresholds
Secrets and misconfigurations
Post-Merge Reliability
Change failure rate (elite: <5%)
Mean time to recovery (elite: <1 hour)
Deployment frequency (elite: multiple times daily)
Lead time for changes (elite: <1 day)
Developer Experience & Flow
Build success rate on first attempt
Merge conflict frequency
Context-switching cost
Onboarding velocity to first meaningful PR
Making Metrics Actionable
The best metrics drive immediate action, not quarterly retrospectives. Elite teams connect measurement to automation:
Automated quality gates: Block PRs exceeding complexity thresholds or reducing coverage
Predictive alerts: Flag PRs likely to cause conflicts or deployment issues before merge
Real-time dashboards: Surface bottlenecks as they happen
Team-specific insights: Show trends vs. organizational baselines
The goal: metrics should reduce friction. If your measurement system adds overhead or slows reviews, you’re measuring wrong things. Elite teams treat metrics infrastructure as seriously as production systems, with consistent schemas, reliable instrumentation, and clear ownership.
Vendor Comparison: How Leading Platforms Stack Up
Capability | CodeAnt AI | DX | Jellyfish | LinearB | Waydev |
DORA Metrics | ✅ Native | ✅ Native | ✅ Native | ✅ Native | ✅ Native |
Code Quality Analysis | ✅ Real-time | ❌ None | ❌ None | ⚠️ Basic | ⚠️ Basic |
Pre-Merge Security | ✅ SAST + SCA | ❌ None | ❌ None | ❌ None | ❌ None |
AI Code Measurement | ✅ Dedicated | ⚠️ Survey-based | ❌ None | ❌ None | ❌ None |
Automated Fixes | ✅ One-click | ❌ None | ❌ None | ❌ None | ❌ None |
Developer Sentiment | ⚠️ Basic | ✅ Research-backed | ⚠️ Basic | ⚠️ Basic | ⚠️ Basic |
Executive Reporting | ✅ Unified | ✅ Strong | ✅ Best-in-class | ✅ Strong | ✅ Strong |
Setup Time | 5 minutes | 2-3 weeks | 3-4 weeks | 1-2 weeks | 2-3 weeks |
Legend: ✅ Full capability | ⚠️ Partial | ❌ Not available
CodeAnt AI: The Unified Code Health Leader
What sets it apart: CodeAnt AI is a defensive and offensive security platform delivering 360° code health, AI-powered code review, pre-merge security scanning, quality enforcement, and DORA tracking in a single unified view. While competitors show problems, CodeAnt fixes them through context-aware suggestions and one-click improvements.
Technical depth:
Real-time code analysis: Scans every PR for vulnerabilities (SAST), dependency risks (SCA), secrets, and misconfigurations before merge
Context-aware AI: Learns your codebase architecture, team standards, and historical patterns to deliver suggestions matching your engineering culture
Predictive bottleneck detection: Identifies merge conflicts, quality degradation, and security debt 2-3 sprints ahead
Measurable outcomes:
100-dev startup: Cycle time from 5 days to 2 days in 90 days
500-dev mid-market: Change failure rate from 12% to 3% while maintaining deployment frequency
2,000-dev enterprise: Consolidated 15 tools, saving $2M annually
Best for: Teams (100+ developers) balancing velocity with security and quality, especially those managing AI-generated code at scale.
DX: Developer Experience Specialists
What sets it apart: Pioneered the research-backed Core 4 framework and excels at measuring developer sentiment through validated surveys. Developer Experience Index (DXI) provides quarterly benchmarks against industry peers.
Best for: Organizations prioritizing developer happiness and retention with strong people-ops functions.
Trade-offs: Survey-heavy approach creates lag (quarterly vs. real-time). Doesn’t improve code quality or security—no automated fixes, quality gates, or scanning. Most teams pair with CodeAnt to turn insights into action.
Jellyfish: Executive Reporting Focus
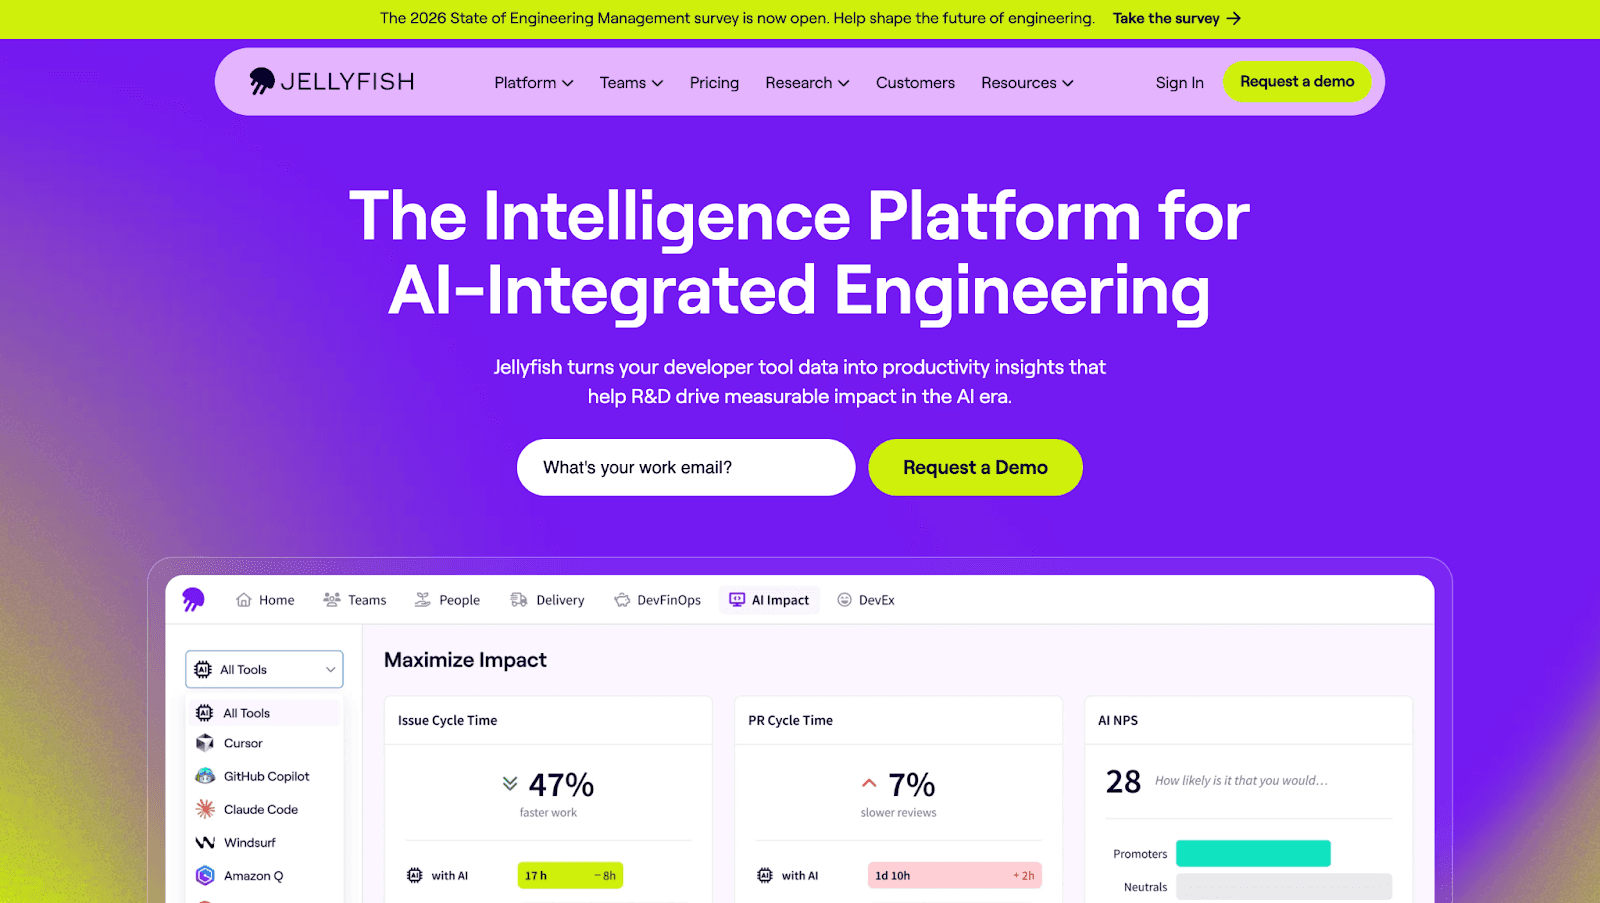
What sets it apart: Best-in-class executive dashboards with ROI visibility, resource allocation tracking, and portfolio-level insights. Maps engineering work to business outcomes.
Best for: VPs and CTOs justifying headcount or demonstrating engineering ROI to boards. Strong for complex matrix structures.
Trade-offs: Primarily reporting—lacks code-level quality analysis, security scanning, or automated improvements. Shows velocity dropped 20% but won’t diagnose if it’s technical debt, security incidents, or process bottlenecks. Teams need CodeAnt alongside to fix root causes.
LinearB: Workflow Automation
What sets it apart: Optimizes PR routing, automates status updates, and streamlines workflows through intelligent automation. Strong at reducing process overhead for distributed teams.
Best for: Engineering managers focused on process optimization and coordination overhead.
Trade-offs: Optimizes how code moves but doesn’t validate what gets merged. No quality analysis, security scanning, or technical debt tracking. CodeAnt provides the complementary layer ensuring code meets standards before LinearB routes it.
Waydev: DORA-Focused Analytics
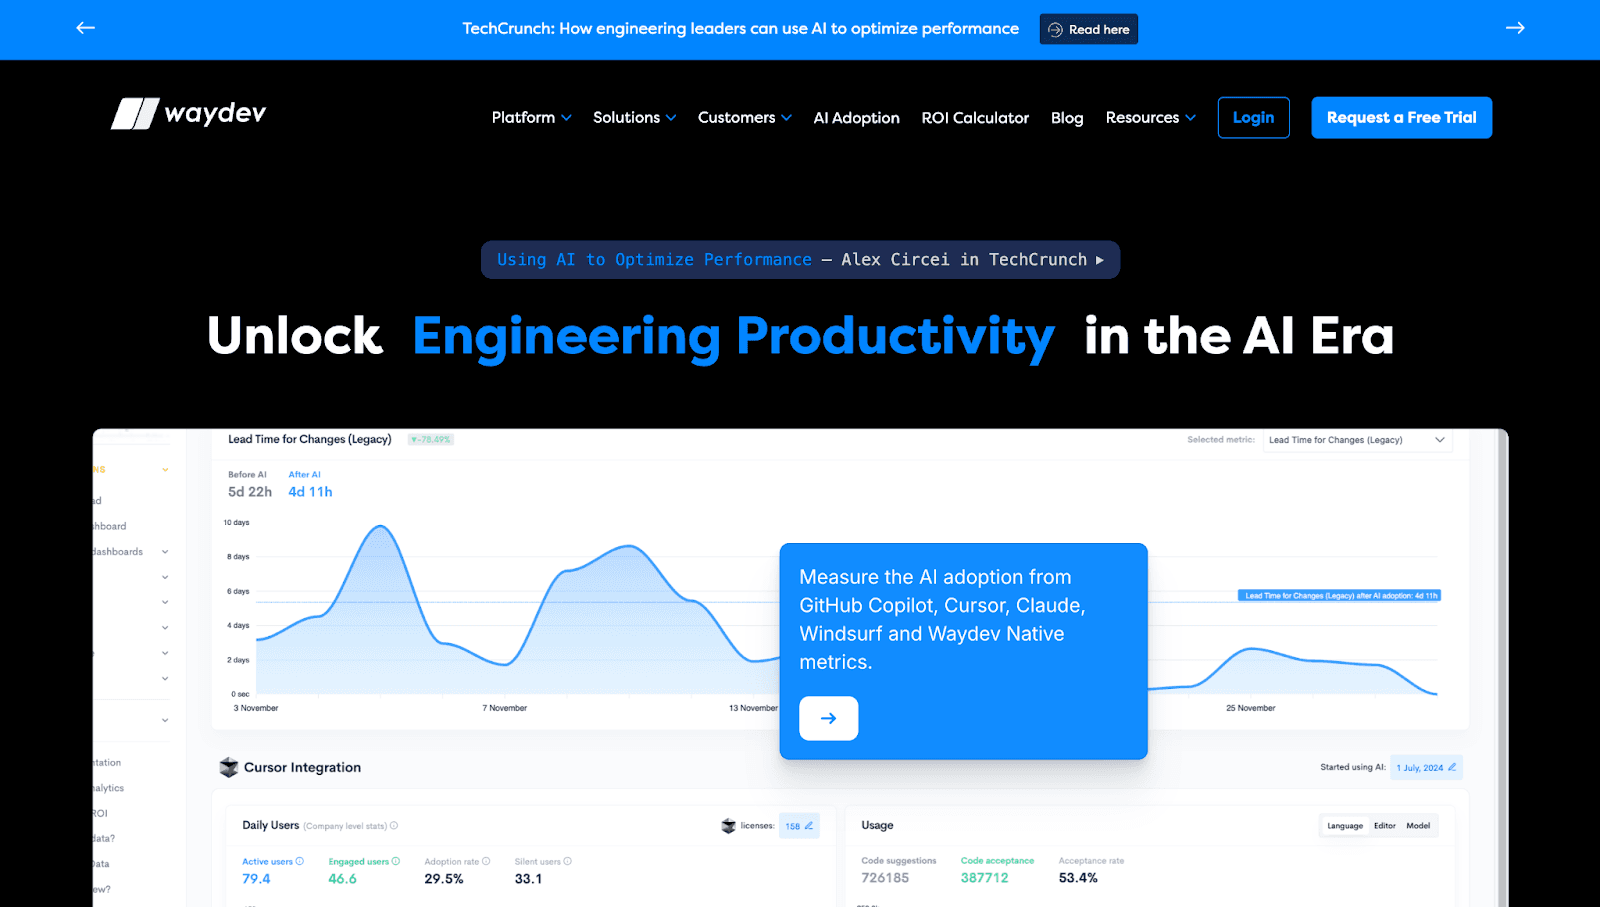
What sets it apart: Clean, straightforward DORA tracking with team breakdowns and historical trending.
Best for: Small to mid-sized teams (50-200 developers) wanting simplicity over depth.
Trade-offs: Surface-level metrics without depth to diagnose why numbers change. No quality analysis, security capabilities, or AI impact measurement. Teams typically outgrow it past 200 developers.
Why CodeAnt Leads: Insights + Action
Most platforms stop at showing problems. CodeAnt closes the loop by fixing them, automatically, at the point of impact, before code reaches production.
The Unified Platform Architecture
Traditional approaches force teams into a Frankenstein stack with data silos, context-switching overhead, and alert fatigue. CodeAnt eliminates fragmentation by unifying code health signals:
AI-powered PR summaries that synthesize changes, highlight architectural impacts, and suggest improvements
Pre-merge security scanning catching vulnerabilities, secrets, IaC misconfigurations, and dependency risks
Quality gates tied to maintainability enforcing organization-specific standards automatically
One-click fixes for common issues, from auto-formatting to dependency upgrades to security patches
Predictive bottleneck detection analyzing review patterns to surface velocity risks before sprint impact
Teams using CodeAnt see cycle time reductions of 35-50% (5 days to 2-3 days) and change failure rate improvements from 10-15% down to 2-4% within 90 days.
How It Works in Practice
Scenario: 150-developer SaaS company merging 200+ PRs weekly
Without CodeAnt:
Developer opens PR → waits 6-8 hours for review
Reviewer spots hardcoded API key → leaves comment → waits for fix
CI fails on complexity spike → developer refactors → re-requests review
Snyk flags vulnerable dependency → developer researches fix → updates → re-runs CI
PR merges after 2-3 days and 4-6 review cycles
With CodeAnt:
Developer clicks “Apply All Fixes” → CodeAnt commits changes → CI passes → reviewer focuses on business logic. PR merges in 4 hours instead of 2 days.
Pre-Merge Security That Accelerates
CodeAnt’s security engine scans every PR for SAST vulnerabilities, secrets, IaC misconfigurations, and dependency risks, with context-aware severity scoring based on your attack surface.
The differentiator: CodeAnt understands reachability and exploitability. Instead of flagging every theoretical vulnerability, it analyzes data flow to determine if user input reaches vulnerable code. This reduces false positives by 60-70% vs. traditional SAST, so developers trust alerts.
Real-world impact: A 300-developer fintech reduced security incidents from 8 per quarter to 1 after implementing CodeAnt’s pre-merge gates. Their security team went from firefighting post-deployment vulnerabilities to proactively reviewing risk trends.
Quality Enforcement That Scales
CodeAnt’s quality gates learn from your codebase:
Context-aware enforcement means CodeAnt adapts to different team standards without manual configuration sprawl.
5-Minute Setup
Connect Git provider via OAuth, 2 minutes
Select repositories to monitor, 1 minute
Configure quality gates or accept auto-detected defaults, 2 minutes
Done. CodeAnt starts analyzing PRs immediately
For 500+ repositories, bulk onboarding provisions entire organizations in under 10 minutes. One 2,000-developer customer migrated from SonarQube + Snyk + custom DORA tracking in a single afternoon with zero downtime.
Ongoing overhead: <2 hours monthly vs. 20-40 hours for legacy stacks.
Getting Started: Your 14-30 Day Proof-of-Value
Phase 1: Baseline & Scope (Days 1-5)
Select pilot repositories representing real workload:
High-velocity: 20+ PRs/week, frequent releases
Security-critical: Payment, auth, customer data
Quality debt: Known review delays, frequent reverts
Polyglot coverage: Primary languages
Establish baseline metrics from last 90 days:
DORA: Deployment frequency, lead time, change failure rate, MTTR
Review: Time to first review, time to merge, review cycles
Quality: Issues per 1K LOC, technical debt, coverage delta
Security: Vulnerabilities merged, secrets exposed, time to remediation
Define success criteria:
Review time: 30-40% reduction
Security: 50%+ reduction in vulnerabilities reaching production
Quality: 25%+ decrease in PR reopen rate
Throughput: 15-20% increase without quality degradation
Phase 2: Parallel Comparison (Days 6-21)
Run CodeAnt in “shadow mode” alongside existing tools for 14 days. Developers see both sets of findings.
Track comparative metrics:
Dimension | CodeAnt | Existing Tools | Delta |
Issues detected per PR | 8.2 | 12.4 | -34% noise |
False positive rate | 6% | 18% | -67% |
Time to surface findings | <2 min | 8-15 min | 75% faster |
One-click fixes | 78% | 0% | N/A |
Survey pilot team weekly on actionability and adoption intent.
Phase 3: Analysis & Rollout (Days 22-30)
Calculate measured deltas. Typical outcomes for 100-dev org:
Review time: 4.2 hours → 2.6 hours (38% reduction)
Vulnerability leakage: 12 → 2 critical issues (83% reduction)
PR throughput: 48 → 58 PRs/week (21% increase)
Reopen rate: 14% → 8% (43% reduction)
Rollout sequencing:
Phase 1 (Weeks 5-8): All repos for pilot team
Phase 2 (Weeks 9-16): Adjacent teams with similar tech stacks
Phase 3 (Weeks 17-24): Organization-wide, deprecate redundant tooling
Conclusion: Metrics That Drive Action Win
The best vendor for developer productivity metrics in 2026 isn’t the one with the prettiest dashboard, it’s the platform that connects metrics to code-level fixes. Teams consolidating review acceleration, pre-merge security, quality gates, and DORA metrics into a single AI-driven workflow eliminate the speed-vs-safety tradeoff that fragmented point solutions create.
CodeAnt AI stands alone as the defensive and offensive security platform delivering real-time AI code review insights that turn into one-click fixes, pre-merge security gates, and predictive bottleneck detection. For engineering teams managing 100+ developers, it eliminates the tool sprawl that drains 2,400+ developer-hours quarterly while proving security accelerates delivery.
Ready to see unified code health in action?Start your 14-day free trial and measure how quickly CodeAnt reduces review cycle time and vulnerability leakage in your actual codebase.


