AI Code Review
Best Tools for Visualizing Developer Productivity and DORA Metrics

Sonali Sood

Founding GTM, CodeAnt AI
Your team ships code fast, but you're flying blind on what's slowing you down. Is it slow reviews? Security bottlenecks? Unclear priorities? Most engineering leaders stitch together answers from Git logs, Jira boards, and CI/CD dashboards, but these fragmented views create more questions than insights.
The challenge isn't finding data, it's finding tools that turn metrics into measurable improvement. Traditional dashboards show you what happened last sprint but don't help you fix the bottlenecks causing delays. Meanwhile, tool sprawl multiplies: one platform for DORA metrics, another for code reviews, a third for security scanning, each adding overhead without showing how these dimensions connect.
This guide evaluates the top platforms that unify productivity visualization with actionable insights. You'll see how the competitive tools compare across review automation, DORA tracking, and developer experience, plus a decision framework to help you choose based on your team's scale and workflow.
The Core Problem: Fragmented Metrics Without Action
Engineering teams today drown in data while starving for insight. Your productivity story scatters across Git commits, Jira tickets, CI/CD pipelines, security scans, and incident logs. Most leaders manually correlate these sources, or rely on dashboards showing isolated metrics without context.
This fragmentation creates three critical problems:
Local optimization at the expense of system outcomes: Your team optimizes for closing Jira tickets quickly, but deployment frequency drops because rushed code creates review bottlenecks. Git shows high commit velocity while your change failure rate spikes. Each tool reports "green," yet delivery slows.
Dashboard fatigue from tool sprawl: Engineering managers juggle separate platforms for code review metrics, DORA tracking, security posture, and code quality. Context-switching between four dashboards to diagnose a single bottleneck wastes hours weekly.
Inability to connect metrics to action: You see that PR cycle time increased 40% last sprint, but was it understaffing, complex changes, inadequate coverage, or security issues blocking merges? Without unified visibility, you're guessing at correlations.
What "Good" Actually Looks Like
Effective visualization connects PR workflow + code quality + security posture + delivery outcomes into a single narrative. The best platforms don't just visualize metrics, they help you understand why metrics change and what to do about it.
Traditional Approach | Outcome-Focused Approach |
Tracks commits per developer | Tracks deployment frequency and lead time |
Measures PR merge speed in isolation | Correlates review thoroughness with change failure rate |
Reports vulnerabilities found | Shows time-to-remediation impact on release velocity |
Displays code coverage percentage | Links coverage trends to production incidents |
Ranks developers by output | Surfaces team bottlenecks and collaboration patterns |
The key distinction: Visualization without action is just surveillance. CodeAnt AI takes a different approach, visualizing bottlenecks while automatically resolving them through context-aware AI reviews. When our platform shows that 40% of PRs wait 2+ days for feedback, it's already handling routine review work so senior engineers focus on architecture and mentoring.
Evaluation Framework: Six Dimensions That Matter
We assessed each platform across criteria reflecting how engineering teams actually work:
Criteria | What We Evaluate |
Integration Depth | Native Git, CI/CD, and project management connections without brittle webhooks |
Visualization Quality | Interactive drill-down from org-level trends to individual PRs |
Actionability | Root-cause analysis and remediation workflows, not just problem identification |
Review Automation | Can it participate in reviews or only measure them? |
Security & Quality Coverage | Tracks vulnerabilities, secrets, dependencies, complexity, and debt in one place |
Implementation Overhead | Time-to-value and governance complexity |
Most tools fall into three categories:
Unified improvement platforms (CodeAnt AI): High coverage + high actionability
Analytics-only platforms (Jellyfish, Cortex): High coverage + low actionability
Point solutions (LinearB, DX, SonarQube): Low coverage + medium actionability
CodeAnt AI sits alone in the high/high quadrant, visualizing review metrics, security posture, code quality, and DORA trends while simultaneously improving them through AI-powered automation.
Top Tools Comparison
Tool | Core Strength | Key Limitation | Best For |
CodeAnt AI | Unified platform: AI reviews + security scanning + DORA tracking + quality gates. Visualizes and improves metrics automatically. | Newer entrant; smaller brand recognition vs. established analytics vendors. | Teams of 100+ devs who need comprehensive code health visibility without tool sprawl. |
LinearB | Real-time cycle time tracking with WorkerB alerts. Strong sprint forecasting and workflow automation. | Shows bottlenecks but doesn't fix them. Requires separate tools for code quality and security. | Teams focused on workflow notifications and predictive delivery analytics. |
Jellyfish | Executive-level engineering investment reporting. Maps work to business outcomes with resource allocation views. | Retrospective analytics only, no improvement mechanisms or code-level automation. | CTOs need to justify engineering spend and align teams with strategic initiatives. |
DX | Research-backed developer experience surveys with industry benchmarking. Captures sentiment and friction points. | Self-reported data; lacks objective code-level insights. No automated remediation. | Organizations prioritizing cultural improvements through sentiment tracking. |
Cortex | Internal developer portal with service catalogs and automated DORA tracking. | Rigid data model; scorecards clutter catalog. No review automation or AI-powered improvements. | Platform teams building centralized service registries for microservices architectures. |
Swarmia | Lightweight DORA + SPACE metrics with developer-friendly UI. Low setup friction. | Metrics-only platform—no code analysis, security scanning, or automated review capabilities. | Smaller teams (20–50 devs) wanting quick visibility without heavy tooling investment. |
CodeAnt AI: Unified Code Health + AI-Powered Review Automation
CodeAnt AI stands apart as the only platform that visualizes and actively improves code health metrics in real time. While other tools show where bottlenecks exist, CodeAnt AI closes the loop by automating reviews, enforcing standards, and surfacing actionable insights that directly accelerate delivery.
What Teams Actually See
Real-time dashboards surface:
Review SLA tracking: Median time-to-first-review, time-to-merge, bottlenecks by team or repository
DORA metrics correlation: Deployment frequency, lead time, change failure rate, MTTR, with drill-downs showing how review velocity impacts each metric
Security-as-productivity: Vulnerability discovery rates, time-to-remediation, and correlation with cycle time delays
Maintainability hotspots: Files with high complexity, duplication, or churn that slow reviews and increase defects
Developer 360 view: Balances velocity with well-being by tracking PR workload, review burden, and focus time
Closing the Loop: From Insight to Automated Action
1. AI-Powered PR Summaries + Suggested Diffs
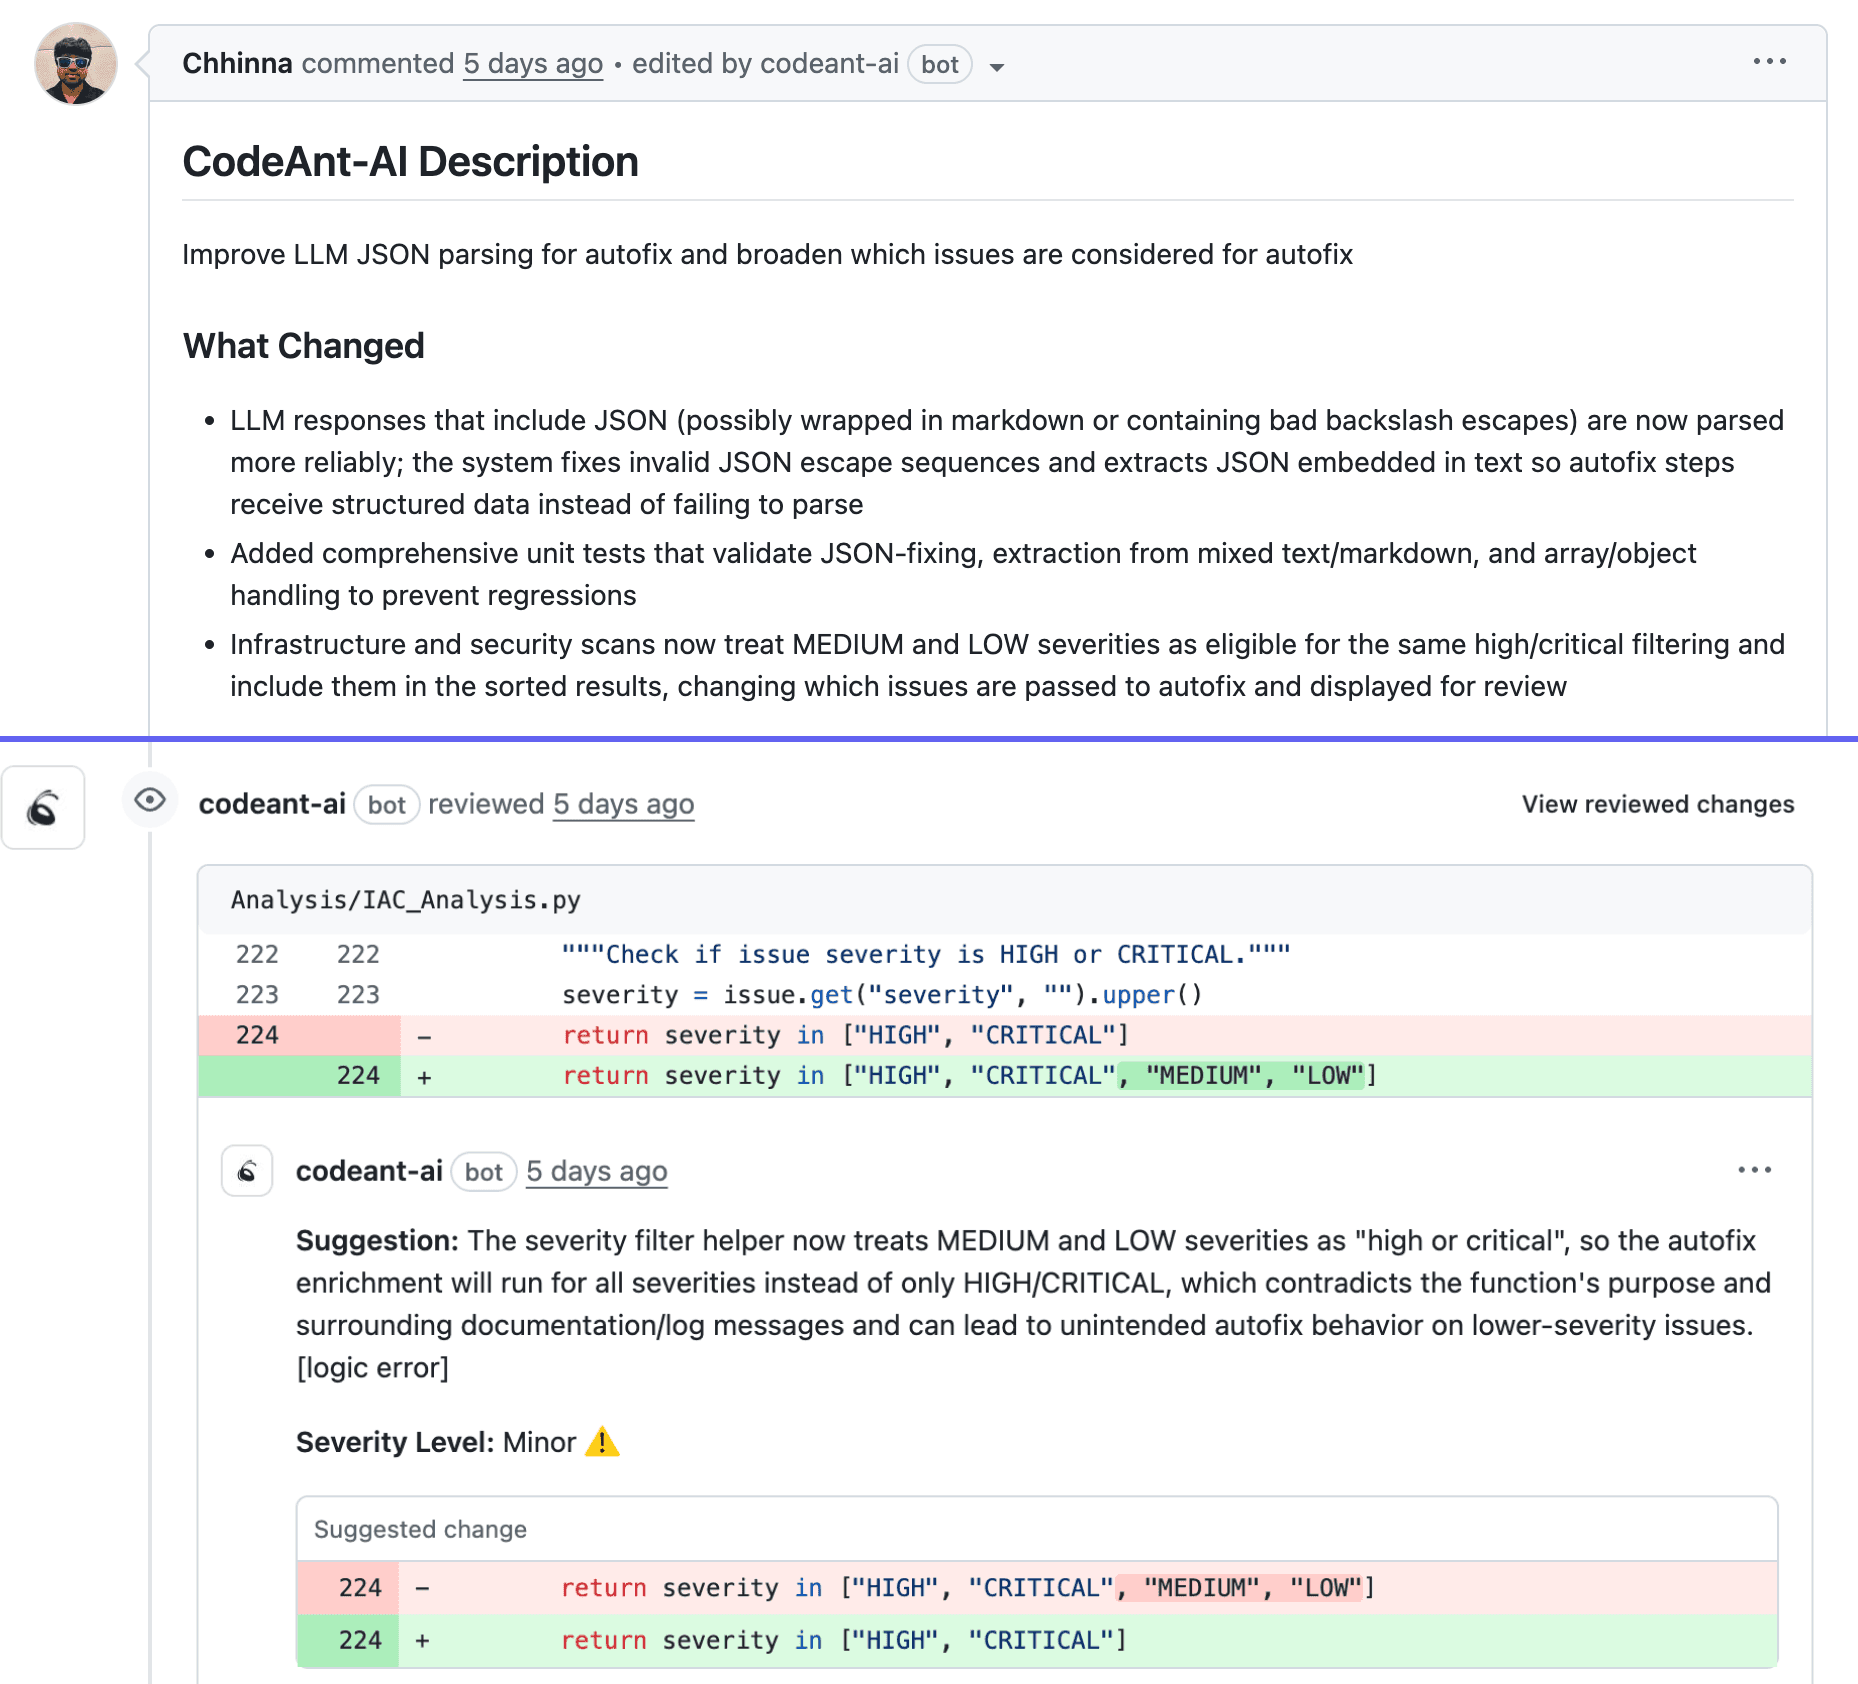
CodeAnt AI automatically:
Generates context-aware summaries explaining what changed, why, and potential impact
Suggests inline improvements for code quality, security, and maintainability
Flags violations of your organization's coding standards
This cuts first-pass review time by 60-80%. Your dashboards immediately reflect faster time-to-first-review and reduced review cycles.
2. Quality and Security Gates
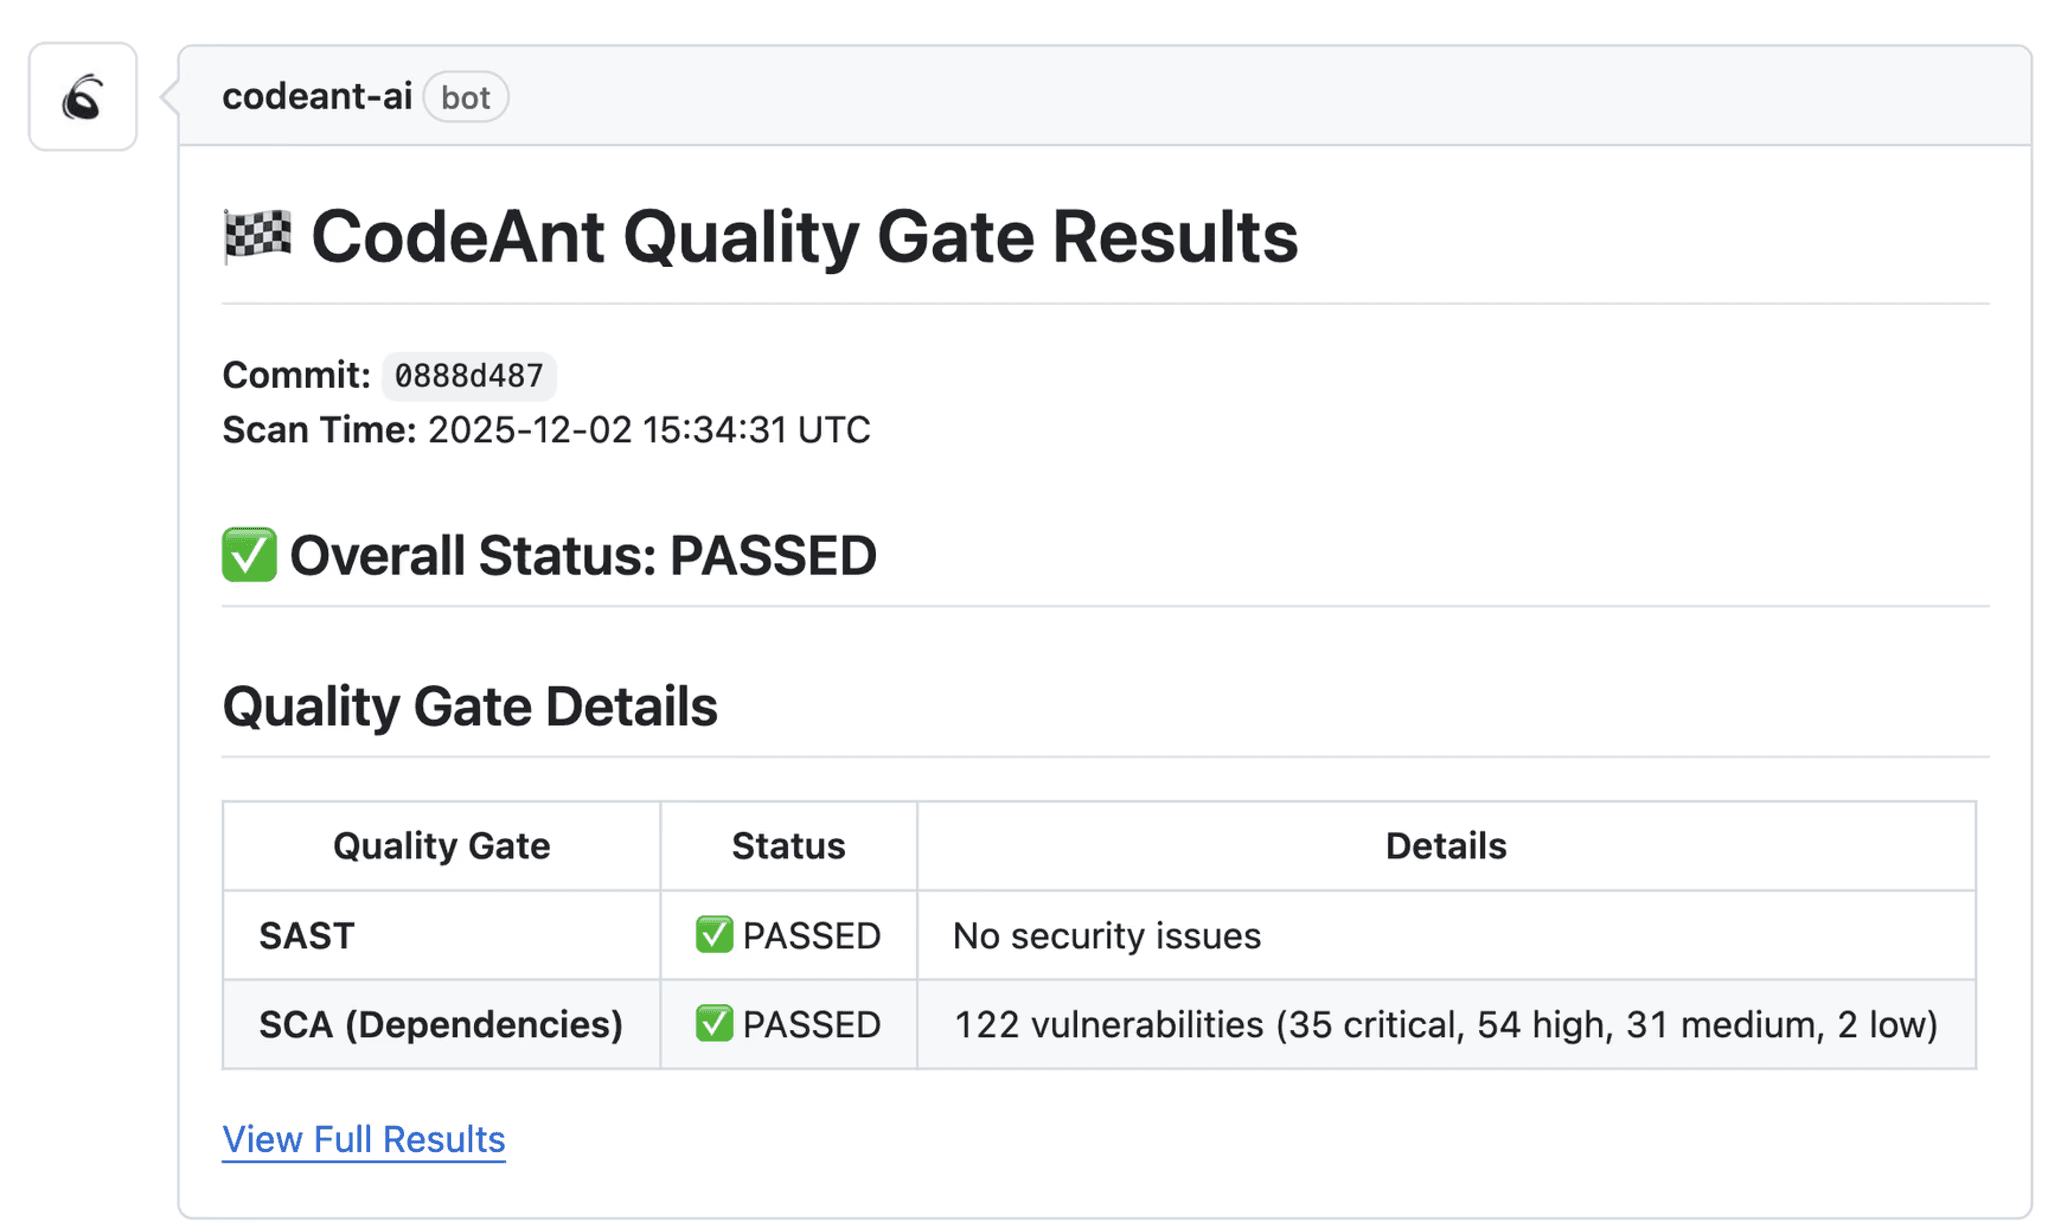
Define gates that automatically block merges when:
Critical or high-severity vulnerabilities are introduced
Code complexity exceeds team thresholds
Test coverage drops below defined levels
Secrets or credentials are detected
3. Dashboards Tying Review Speed to Deploy Frequency
Metric | Before CodeAnt AI | After 8 Weeks | Impact |
Median Time-to-First-Review | 18 hours | 2 hours | 89% reduction |
Median Time-to-Merge | 3.2 days | 0.8 days | 75% reduction |
Deployment Frequency | 2.1/week | 5.3/week | 2.5x increase |
Change Failure Rate | 12% | 8% | 33% improvement |
The dashboard shows these correlations in real time, making it easy to demonstrate ROI to leadership.
Best Fit
Ideal for:
Teams of 100+ developers scaling without proportionally increasing review overhead
Organizations prioritizing security and compliance (fintech, healthcare, enterprise SaaS)
Engineering leaders seeking consolidation to replace 3-4 point solutions
Distributed or remote teams where async review workflows are critical
LinearB: Workflow Analytics + Automation
LinearB excels at workflow observability and coaching, tracking PRs through every lifecycle stage and alerting teams when metrics drift.
What LinearB does well:
Cycle time decomposition: Breaks down PR lifecycle into granular phases (coding time, pickup time, review time, deploy time)
WorkerB notifications: Automatically pings developers when PRs sit idle or reviewers are overloaded
Team benchmarking: Compares metrics against industry standards
Sprint forecasting: Predicts delivery timelines and flags at-risk commitments
Where it falls short:
No code review automation: You still need humans to perform reviews and suggest fixes
Security and quality gaps: Doesn't scan for vulnerabilities or validate test coverage
Reactive, not preventive: Alerts fire after bottlenecks form
Best for: Process optimization projects and distributed teams needing async review coordination.
Jellyfish: Engineering Investment and Business Alignment
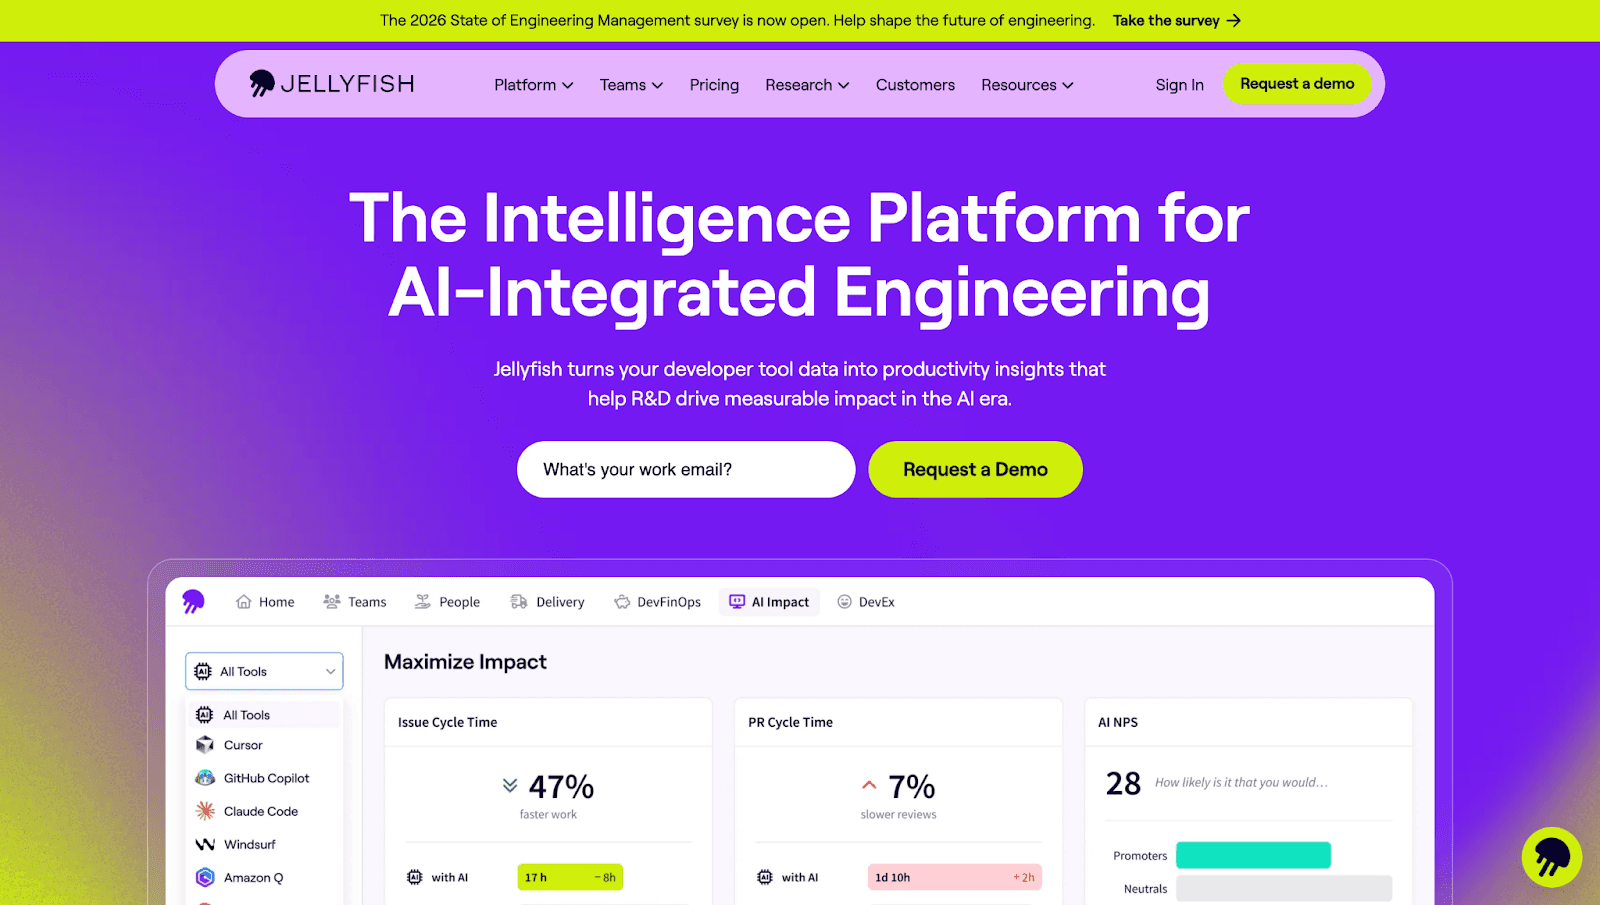
Jellyfish translates engineering work into executive language, cost, allocation, and business value. If your CTO needs to justify headcount or show how engineering investment maps to strategic initiatives, Jellyfish delivers board-ready dashboards.
What Jellyfish does well:
Executive-level reporting: Shows where engineering time goes (features vs. technical debt vs. unplanned work)
Portfolio planning: Retrospective analysis for quarterly planning and rebalancing
Cross-functional alignment: Tags work to strategic themes for stakeholder communication
Where it falls short:
Retrospective only: Tells you what happened but offers no improvement mechanism
Weak PR-level insights: Doesn't drill into why reviews are slow or which code patterns create bottlenecks
Limited developer value: Built for managers and executives, not engineers doing the work
Best for: Organizations with 200+ developers where engineering leadership needs to justify spend and communicate capacity constraints to non-technical stakeholders.
Additional Tools Worth Considering
Swarmia delivers clean, team-focused dashboards visualizing cycle time and work distribution. Excels at identifying where reviews stall but offers no mechanism to resolve them.
DX provides research-backed developer experience surveys with industry benchmarking. Captures qualitative signals metrics miss, but self-reported data lacks code-level causality.
Cortex organizes microservices through service catalogs and automated DORA tracking. Strong for platform engineering teams but rigid data model and no review automation limit impact.
SonarQube remains the gold standard for code quality visualization, complexity, duplication, coverage, and technical debt tracking. Shows what's wrong but doesn't help fix it or connect to review velocity.
Decision Framework: How to Choose
Step 1: Identify Your Primary Constraint
Slow code reviews → You need visibility into PR cycle time and a way to reduce it. Metrics-only tools show the problem; CodeAnt AI solves it with AI-powered reviews.
Quality regressions → You're tracking change failure rate but incidents keep happening. You need enforcement at the PR level, not just measurement.
Security backlog growth → Dashboards showing vulnerability counts won't help. You need automated triage, fix suggestions, and tracking that connects security work to velocity.
Unclear throughput → You need unified DORA metrics showing why throughput changed, not just that it changed.
Step 2: Calculate Total Cost of Ownership
Point solution stack:
Review metrics (LinearB, Swarmia): ~$15-25/dev/month
Security scanner (Snyk, SonarQube): ~$20-40/dev/month
Code quality platform (Code Climate): ~$15-30/dev/month
Total: $50-95/dev/month + integration overhead + context-switching costs
Unified platform (CodeAnt AI):
All-in-one: Review automation + security + quality + DORA metrics
Typical pricing: $40-60/dev/month with volume discounts
Consolidation savings: 30-40% lower TCO + single integration + unified insights
Decision Model
START: What's your primary goal?
Implementation Blueprint: Rolling Out Metrics Without Breaking Trust
Start Team-Level, Not Individual
Launch with team-level aggregates that surface bottlenecks without singling out individuals:
Review cycle time by repository or squad
Deployment frequency trends at the team level
WIP distribution showing capacity constraints
Quality gate pass rates by service
CodeAnt AI defaults to this team-first view, showing where reviews bottleneck (e.g., "PRs touching authentication wait 3x longer") without exposing who causes delays.
Publish Clear Definitions
Before instrumenting anything, document exactly what you're tracking and why:
Tie Metrics to Working Agreements
Integrate metrics into team-negotiated standards:
Working Agreement | Metric | Automation Trigger |
"PRs reviewed within 24hrs" | Review cycle time SLA | Slack reminder after 18hrs |
"Max 3 PRs in-flight per dev" | WIP limit | Block new PR creation when limit hit |
"Security scans pass before merge" | Quality gate compliance | Auto-comment on PRs with vulnerabilities |
CodeAnt AI operationalizes these by connecting metrics to automated remediation, when cycle time spikes, the AI handles routine feedback immediately.
Rollout Timeline
Weeks 1-4 (Crawl): Deploy team-level dashboards for 1-2 pilot squads. Gather feedback in retros.
Weeks 5-8 (Walk): Expand to all teams. Add opt-in self-serve views. Tie 1-2 metrics to working agreements.
Weeks 9-12 (Run): Enable automated remediation. Measure impact on DORA metrics. Iterate.
Real-World Impact: Two Scenarios
Scenario 1: Scaling Without Sacrificing Velocity
A Series B SaaS company grew from 50 to 150 developers. Review cycle time ballooned from 8 hours to 3.5 days. Senior engineers spent 40% of their week on review, leaving little time for architecture.
After implementing CodeAnt AI:
Metric | Before | After 8 Weeks | Change |
Review cycle time | 3.5 days | 14 hours | -80% |
Deployment frequency | 5/week | 12.5/week | +150% |
Senior engineer review load | 40% | 18% | -55% |
Change failure rate | 8.2% | 6.1% | -26% |
The AI handled 60% of common issues, style violations, missing tests, security anti-patterns, freeing senior engineers for architectural decisions.
Scenario 2: Turning Incidents into Prevention
A fintech platform traced a 2-hour outage to a rushed code review, a critical PR was merged in 10 minutes with zero comments to meet a release deadline.
Post-incident changes:
Complexity-based review requirements with minimum 2 reviewers for critical paths
AI pre-review flagging security risks and edge cases
Mandatory 30-minute "soak time" for high-risk PRs
Real-time risk scoring (1-10) based on files changed and complexity
Results over two quarters:
Metric | Baseline | After Implementation | Change |
Change failure rate | 11.4% | 7.9% | -31% |
Incidents from rushed reviews | 6 | 1 | -83% |
PRs merged < 15 min | 22% | 4% | -82% |
AI-flagged issues caught pre-merge | 0 | 340 | — |
Conclusion: Consolidate, Visualize, Close the Loop
Visualization without action is just prettier noise. The best tools don't stop at dashboards, they connect insights to improvements that reduce cycle time, strengthen security, and keep teams moving.
Most platforms show you the problem. Only CodeAnt AI solves it with context-aware AI that learns your team's patterns, enforces standards, and cuts review time by 80% while improving deployment frequency.
Your next steps:
Baseline 3-5 metrics: PR pickup time, time-to-merge, deployment frequency, change failure rate
Run an 8-week pilot with 2-3 high-velocity teams
Measure the delta: Track improvements in cycle time and security resolution—not just dashboard adoption
Connect visibility to action: Choose platforms that show and fix bottlenecks
Ready to unify productivity dashboards with AI review automation, security scanning, and quality improvements, without the tool sprawl?Run a 2-week baseline and see how teams with 100+ developers ship faster, safer code with measurable improvements in DORA metrics and developer experience.
FAQs
Are metrics surveillance or support?
What's a good PR pickup time?
How do you prevent gaming?
Can you use DORA metrics without overfitting?
What’s the minimum dashboard set for a new program?


