AI Code Review
DORA Metrics and Code Health: A Complete Guide to Developer Productivity

Sonali Sood

Founding GTM, CodeAnt AI
Engineering teams track deployment frequency and lead time religiously, yet still wonder why velocity keeps declining. The disconnect often comes from measuring outputs without understanding the underlying conditions that produce them.
DORA metrics tell you how fast you’re delivering software. Code health tells you whether you can sustain that pace. This guide covers how these two measurement approaches work together, which metrics actually matter, and practical strategies for improving both without turning your dashboard into a surveillance system.
What is Developer Productivity
Developer productivity is about how effectively engineering teams deliver valuable software—not just how much code they write. It combines speed, quality, and sustainable output. A developer who ships clean, maintainable code is more productive than one who churns out buggy features that create months of follow-up work.
The tricky part? Software development is knowledge work. The most impactful contributions are often invisible: mentoring a teammate, designing an elegant architecture, or catching a critical bug during code review.
What are DORA Metrics
DORA metrics come from the DevOps Research and Assessment program, which studied thousands of engineering teams to figure out what separates high performers from everyone else. These four metrics have become the industry standard for measuring software delivery performance.
The metrics fall into two buckets: throughput (how fast you deliver) and stability (how reliably you deliver). Elite teams excel at both. They ship frequently without sacrificing quality.
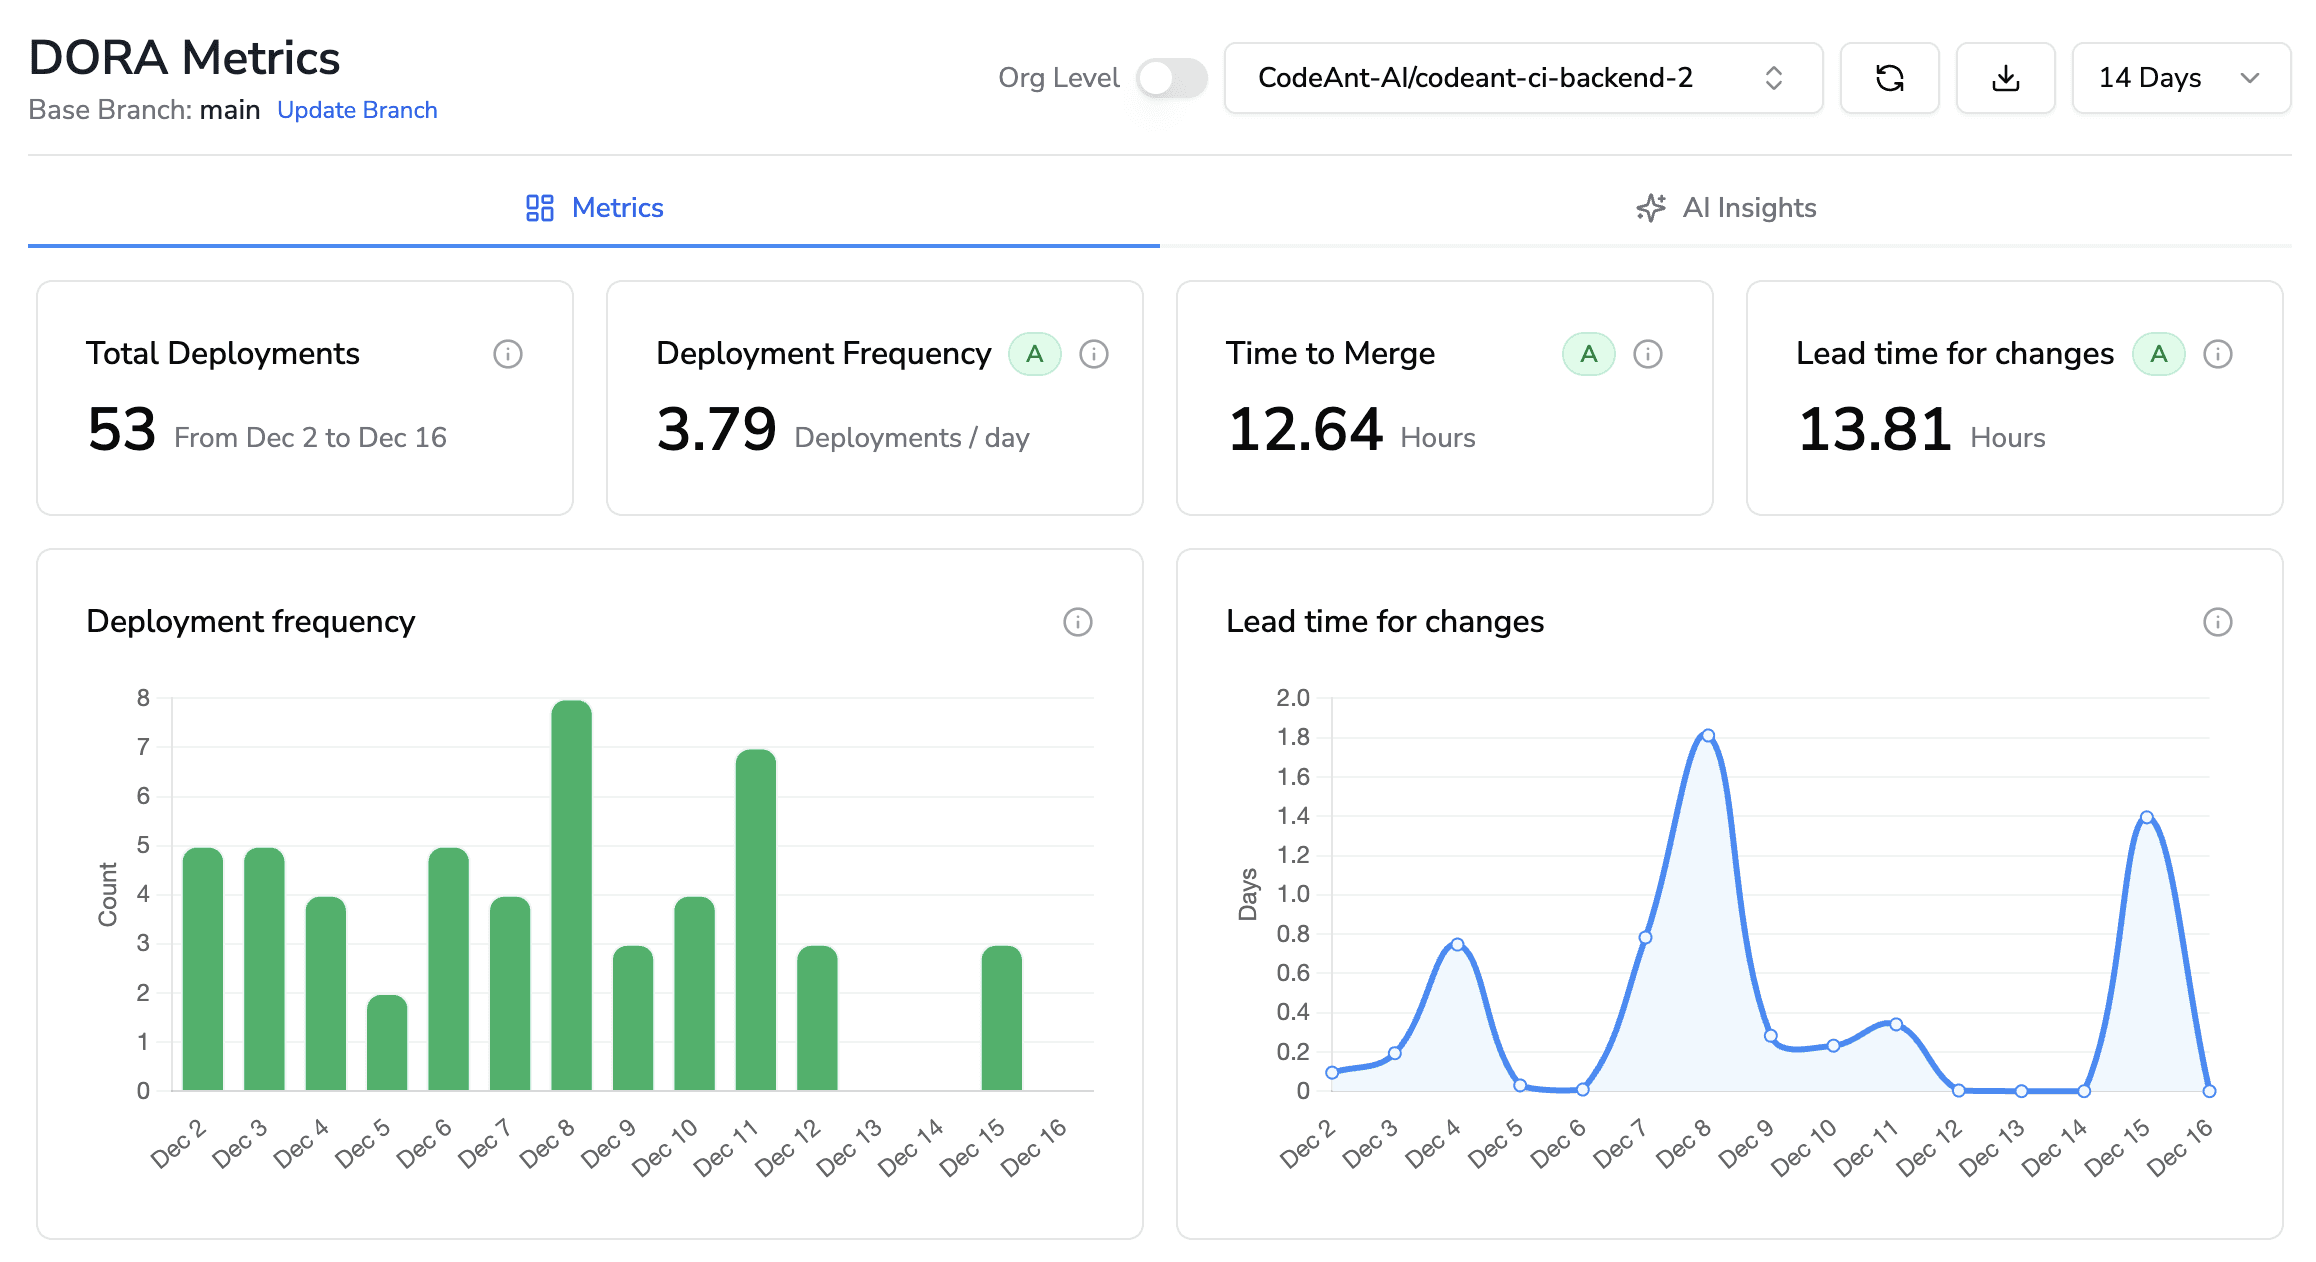
Deployment frequency
Deployment frequency tracks how often your team releases code to production. Higher frequency usually means smaller batch sizes, which translates to less risk per release and faster feedback loops.
Teams that deploy multiple times per day operate very differently from those releasing monthly. They’ve invested in automation, testing, and code health practices that make frequent releases safe.
Lead time for changes
Lead time measures the clock from when a developer commits code to when it’s running in production. This metric reveals bottlenecks in your pipeline—slow CI builds, lengthy review queues, or manual deployment gates.
Shorter lead times mean developers see the impact of their work faster. That improves both motivation and the ability to course-correct quickly.
Change failure rate
Change failure rate captures the percentage of deployments that cause production incidents, rollbacks, or hotfixes. This metric balances the speed metrics. You can deploy constantly, but if half your releases break something, you’re not actually moving fast.
A healthy change failure rate indicates strong testing practices, good code review, and well-maintained code.
Mean time to recovery
Mean time to recovery (MTTR) measures how quickly your team restores service after an incident. Even the best teams have failures. What matters is how fast you bounce back.
Low MTTR requires readable code, good observability, and documented systems. When something breaks at 2 AM, you want the on-call engineer to understand the codebase quickly.
Metric | What it measures | Why it matters |
Deployment frequency | How often code reaches production | Indicates batch size and release confidence |
Lead time for changes | Time from commit to production | Reveals pipeline efficiency and bottlenecks |
Change failure rate | Percentage of releases causing issues | Balances speed with stability |
Mean time to recovery | Time to restore service after incidents | Reflects operational resilience |
What is Code Health
Code health describes the overall maintainability, readability, and structural integrity of your codebase. Healthy code enables fast, confident changes. Unhealthy code creates friction in everything your team does.
Think of code health as the foundation that DORA metrics sit on. You can’t sustain high deployment frequency if every change requires navigating a maze of technical debt.
Maintainability
Maintainable code can be modified without introducing bugs or requiring archaeology expeditions through the codebase. Clear structure, consistent patterns, and good documentation all contribute to maintainability.
Code complexity
Cyclomatic complexity measures how many independent paths exist through a piece of code. High complexity means more test cases needed, more cognitive load for reviewers, and more places for bugs to hide.
Code duplication
Duplicated code multiplies your maintenance burden. Fix a bug in one place, and you’ve probably left the same bug lurking in three other copies. Duplication also inflates your codebase, making everything harder to navigate.
Test coverage
Test coverage indicates what percentage of your code is exercised by automated tests. Adequate coverage gives teams confidence to refactor and improve code without fear of breaking unknown functionality.
How DORA Metrics and Code Health Work Together
Here’s the connection many teams miss: DORA metrics measure outcomes, while code health measures the conditions that enable or hinder those outcomes. Poor DORA performance is often a symptom of poor code health underneath.
When your codebase is healthy, improvements to DORA metrics come naturally. When it’s not, you’re fighting uphill.
How code quality affects deployment frequency
Clean, modular code enables smaller, safer releases. When changes are isolated and predictable, teams can deploy confidently without extensive manual testing or change review boards.
Teams with healthy codebases often deploy individual features or fixes independently. Teams with tangled code batch changes together because touching anything feels risky.
How technical debt increases lead time
Technical debt acts like friction on every change. Developers spend time navigating complexity, working around fragile code, and fixing unrelated breakages instead of delivering features.
A change that takes an hour in a healthy codebase might take a day in one burdened with debt—and that’s before code review even starts.
How code health reduces change failure rate
Well-tested, well-structured code catches issues before production. Automated quality checks, enforced standards, and comprehensive test suites act as safety nets throughout the development process.
When code is readable and well-organized, reviewers can actually understand what they’re approving. Rubber-stamp reviews happen when code is too complex to reason about.
How maintainable code speeds recovery
When incidents happen, readable code enables faster diagnosis. Engineers can trace problems, understand dependencies, and implement fixes without first spending hours figuring out what the code does.
Healthy code → Higher deployment frequency: Smaller, safer changes ship faster
Technical debt → Longer lead times: Complexity creates friction in every commit
Quality enforcement → Lower failure rates: Issues get caught before reaching production
Maintainability → Faster recovery: Clear code enables rapid debugging
Why Developer Productivity is Difficult to Measure
Software development resists simple measurement because it’s creative knowledge work with intangible outputs. A developer might spend three days thinking through a problem, then write fifty lines of code that solve it elegantly. Another might write five hundred lines in the same time that create ongoing maintenance headaches.
Knowledge work is non-linear: A breakthrough insight may take days of invisible thinking
Context matters: The same task varies dramatically in difficulty across different codebases
Quality is lagging: Shortcuts today create problems that surface months later
Single metrics can also be gamed. Optimize for deployment frequency alone, and teams might ship incomplete features. Focus only on change failure rate, and releases slow to a crawl.
How Not to Measure Developer Productivity
Some metrics seem intuitive but actually incentivize counterproductive behavior. Understanding why they fail helps teams avoid common measurement traps.
Lines of code
More code isn’t better code. This metric rewards verbose solutions over elegant ones and penalizes developers who delete unnecessary code or refactor for simplicity.
Number of commits
Commit counts encourage artificially splitting work into tiny pieces or avoiding necessary large refactors. Neither behavior improves actual productivity.
Hours worked
Time spent measures input, not output. This metric penalizes efficient developers and rewards those who appear busy regardless of what they accomplish.
Story points completed
Story points are estimation tools, not productivity measures. When used for evaluation, they inflate over time as teams learn to game the system.
Which Metrics Track Developer Productivity and Code Health
Effective measurement combines outcome metrics with leading indicators. DORA metrics tell you how you’re performing right now. Code health metrics help predict where you’re headed.
Throughput metrics
Deployment frequency, lead time, and developer velocity measure how quickly value moves from idea to production. These metrics reveal whether your delivery pipeline enables or constrains your team.
Stability metrics
Change failure rate, MTTR, and incident frequency measure the reliability of your delivery. High throughput means nothing if releases constantly break.
Code quality metrics
Maintainability index, complexity scores, and duplication percentage indicate the health of your codebase. These leading indicators predict future velocity—rising complexity today means slower delivery tomorrow.
Technical debt metrics
Debt ratio, code smells, and aging issues track accumulated maintenance burden. Monitoring debt prevents the gradual velocity degradation that catches teams by surprise.
Security metrics
Vulnerability density, secrets exposure, and dependency risks impact both stability and velocity. Security issues discovered late in the cycle are expensive to fix and can halt releases entirely.
Metric category | Example metrics | What they predict |
Throughput | Deployment frequency, lead time | Delivery speed and pipeline efficiency |
Stability | Change failure rate, MTTR | Release reliability and operational resilience |
Code quality | Complexity, duplication, maintainability | Future development velocity |
Technical debt | Debt ratio, code smells | Risk of velocity degradation |
Security | Vulnerability density, dependency risks | Potential release blockers and incidents |
DORA Metrics Benchmarks by Performance Tier
DORA research categorizes teams into performance tiers based on their metrics. Understanding where your team falls helps set realistic improvement goals.
Elite performers
Elite teams deploy on-demand—often multiple times per day—with lead times measured in hours and near-zero failure rates. They practice trunk-based development, maintain extensive automation, and prioritize code health as a continuous concern.
High performers
High performers deploy frequently with lead times under a week and quick recovery from failures. They have mature practices but may retain some manual gates or batch certain types of changes.
Medium performers
Medium performers follow regular release cycles—weekly or monthly—with lead times measured in weeks. Common patterns include batch releases, some manual testing phases, and moderate technical debt accumulation.
Low performers
Low performers release infrequently, often with painful, high-risk deployments. Lead times stretch to months, and recovery from incidents takes days. High technical debt, manual processes, and siloed knowledge typically contribute to these challenges.
How to Improve Developer Productivity Using DORA Metrics and Code Health
Improvement requires addressing both the metrics and the underlying code health conditions. Each approach connects specific actions to measurable outcomes.
1. Automate code reviews to reduce lead time
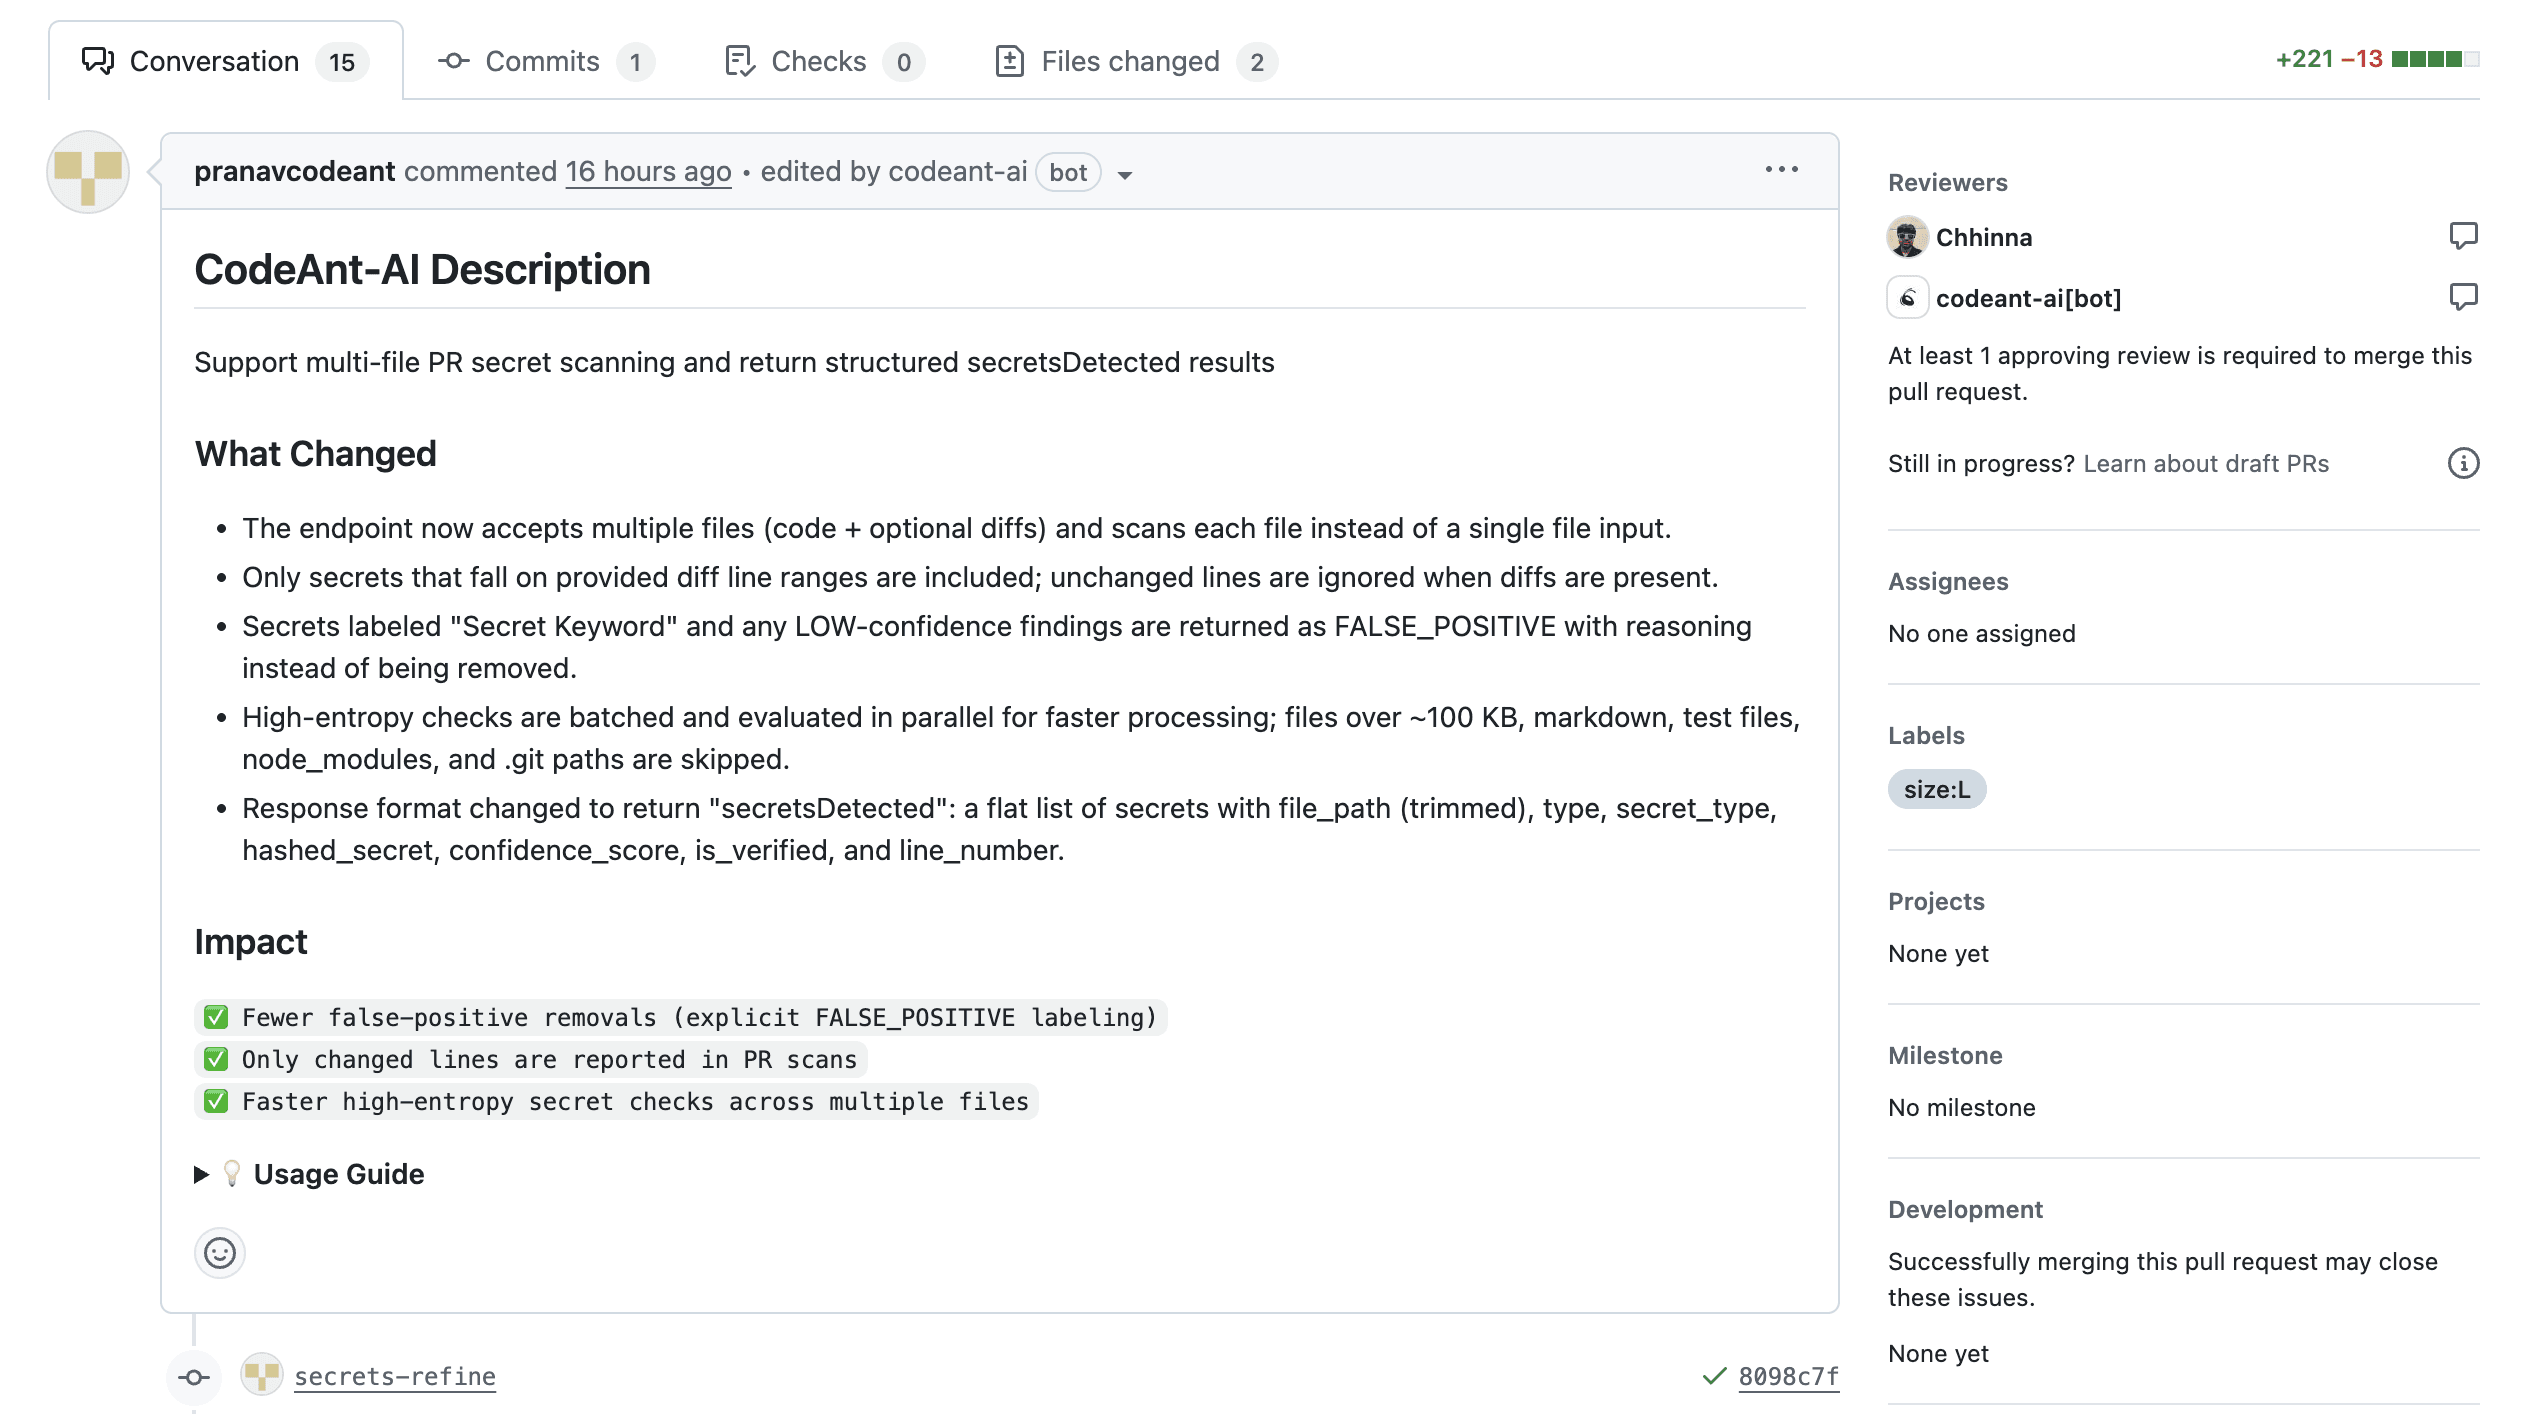
Automated code review catches common issues instantly, freeing human reviewers to focus on architecture and design decisions. AI-powered tools like CodeAnt AI can enforce standards consistently across every pull request, eliminating the bottleneck of waiting for reviewer availability.
2. Reduce technical debt continuously
Allocating regular time for debt reduction prevents the gradual velocity degradation that accumulates when teams only ship features. Track debt systematically and prioritize based on impact to delivery speed.
3. Integrate security scanning into the development workflow
Shift-left security catches vulnerabilities before they reach production, preventing both incidents and costly late-stage fixes. Continuous scanning throughout the development lifecycle keeps security from becoming a release blocker.
4. Establish organization-wide code health standards
Consistent standards reduce cognitive load when developers move between projects. Automated enforcement ensures compliance without manual overhead or inconsistent review feedback.
5. Track all metrics in a unified dashboard
Fragmented tooling creates blind spots and makes it difficult to see how code health decisions impact delivery performance. A unified platform connecting code review, security, quality, and DORA metrics enables data-driven decisions.
Tip: Start by establishing baselines for your current DORA metrics and code health indicators. Improvement is easier to demonstrate—and celebrate—when you have clear before-and-after data.
How to Use Productivity Metrics Without Creating Surveillance Culture
Metrics programs fail without developer buy-in. The goal is team improvement, not individual judgment.
Measure teams, not individuals: Aggregate metrics prevent harmful competition and gaming
Share dashboards openly: Transparency builds trust and shared ownership of outcomes
Focus on trends, not snapshots: Improvement trajectory matters more than absolute values
Connect metrics to outcomes: Help teams understand why each metric matters for their goals
When developers see metrics as tools that help remove friction from their work, they become advocates rather than resisters.
Why Engineering Teams Need a Unified Code Health Platform
Juggling separate tools for code review, security scanning, quality analysis, and DORA metrics creates fragmented visibility and constant context-switching. Teams end up with data in silos, making it nearly impossible to see how a code health decision impacts delivery performance.
A unified platform brings these capabilities together, showing the connections between code quality, security posture, and delivery metrics in a single view. When you can see that rising complexity in a specific service correlates with increasing lead time, you can make informed decisions about where to invest in improvement.
Start a free trial of the CodeAnt AI defensive and offensive security platform to see how unified visibility transforms engineering decision-making.
FAQs
How often should engineering teams review DORA metrics and code health data?
Can small engineering teams benefit from tracking DORA metrics?
What tools integrate DORA metrics with code health tracking?
How do engineering leaders get developer buy-in for productivity metrics?
Should DORA metrics be tied to individual developer performance reviews?


