AI Code Review
Why Traditional Code Review Tools Miss Runtime Behavior Insights in 2026

Sonali Sood

Founding GTM, CodeAnt AI
Your code review passed. Every check was green. The PR merged without a single comment. Then, three days later, the service crashed under load, a memory leak that no reviewer caught because no reviewer could have caught it.
Traditional code review tools analyze code as text, not as running software. They parse diffs, flag patterns, and enforce style rules. What they cannot do is observe how your code behaves when it actually executes, handling real inputs, managing resources under pressure, or responding when external services fail. This article breaks down exactly why static analysis misses runtime issues, what kinds of bugs slip through, and how teams can close the gap without abandoning the tools that already work.
What Are Runtime Behavior Insights
Traditional code review tools miss runtime behavior insights because they analyze code without executing it. When you open a pull request, your review tool reads the diff, checks syntax, and flags known patterns. What it cannot do is observe how that code actually behaves when it runs, how it handles real user inputs, manages memory under load, or responds when an external API times out.
Runtime behavior refers to everything your code does during execution: data flow, timing, resource consumption, and interactions with databases, queues, and third-party services. Static analysis reads the recipe. Runtime analysis tastes the dish.
Here's the core distinction:
Static analysis: Examines code structure and patterns without execution
Runtime analysis: Observes actual behavior during execution, timing, memory, and external interactions
Runtime behavior insights: Actionable signals from execution that reveal bugs invisible in code review
When your team reviews a PR, you're looking at a diff. You might catch a typo or a missing null check. What you won't catch is how that code behaves with 10,000 concurrent users hitting it at once.
Why Static Analysis Tools Cannot Detect Runtime Issues
Static analysis tools parse source code into an abstract syntax tree (AST), then apply pattern-matching rules to flag violations. The code never executes during this process. That's both the strength and the limitation.
How Static Analysis Works
When you run a static analyzer, it reads your source files as text. It builds a structural representation, variables, functions, control flow—and compares that structure against a library of known patterns. If something matches a "bad pattern," it flags it.
This approach is fast and scalable. It catches many issues early. However, it operates entirely on code "at rest."
What Static Tools Catch
Static analysis excels at certain categories:
Syntax errors and typos
Code style violations
Known vulnerability patterns (SAST)
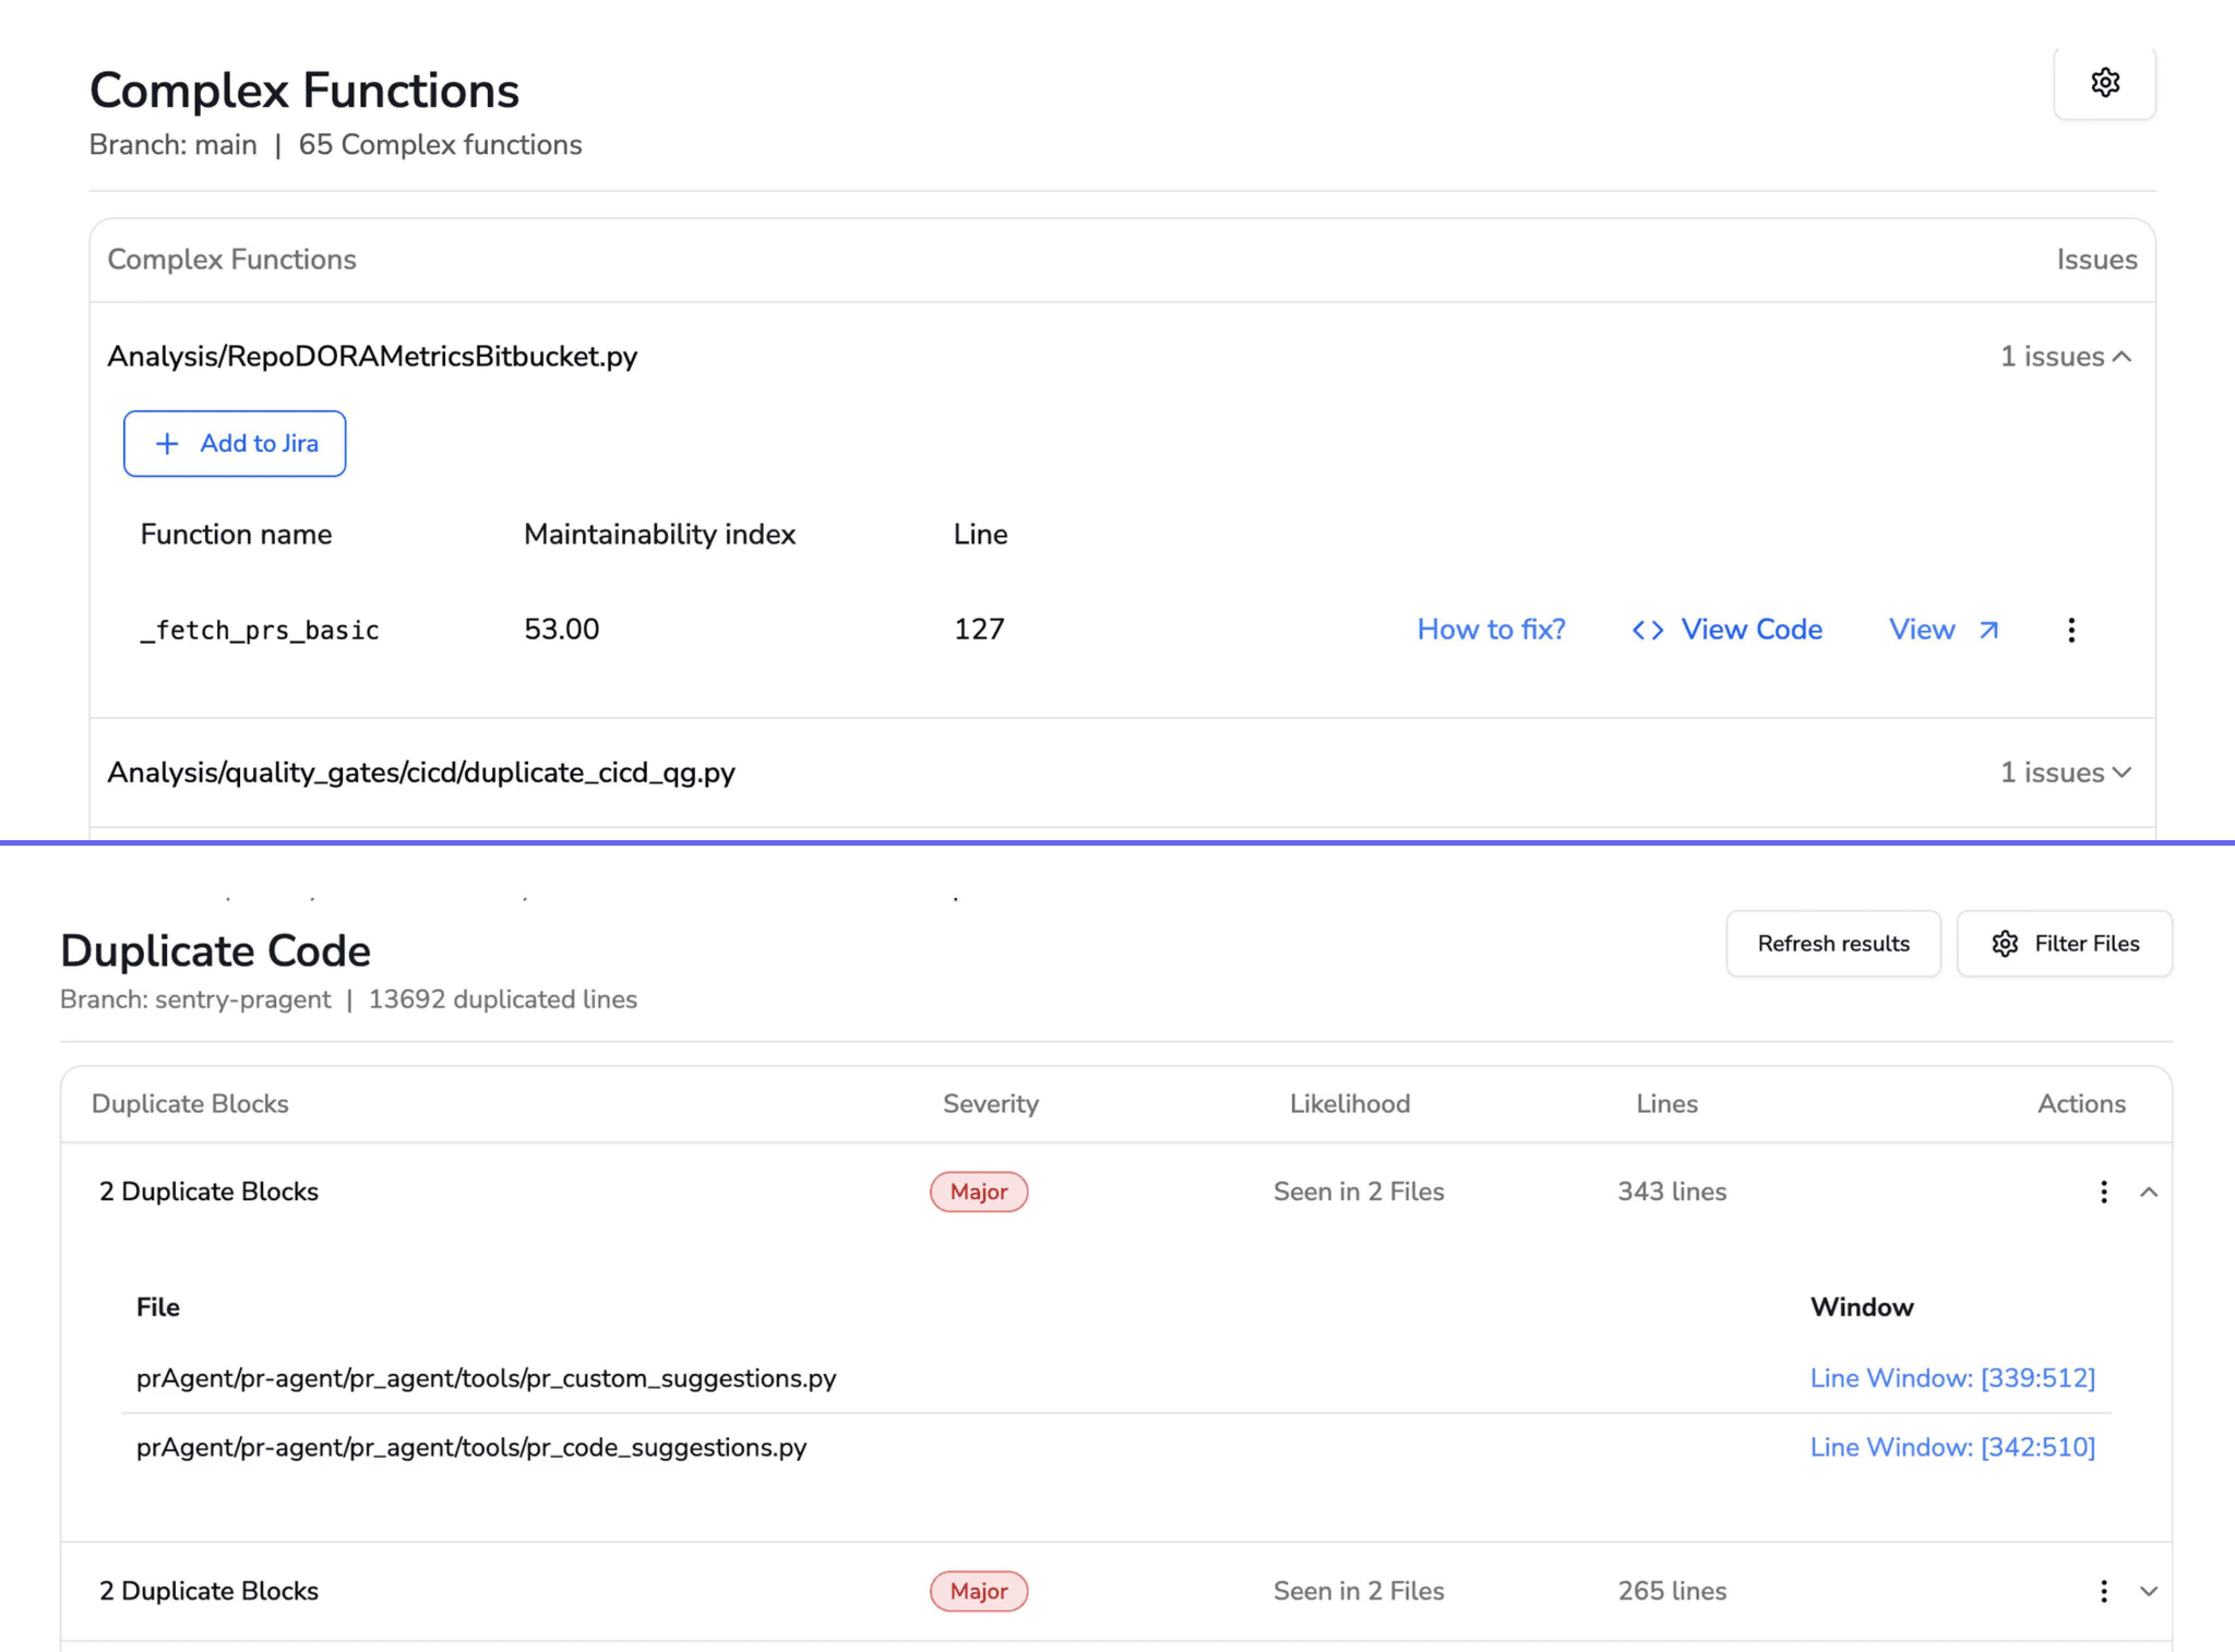
Complexity and duplication
Dependency risks with known CVEs
All valuable. Yet all represent only part of the picture.
The Limitation of Analyzing Code Without Execution
Without execution, static tools cannot observe real data inputs, external service responses, concurrency timing, or resource consumption. They see code as written, not code as run.
Consider a function that queries a database. Static analysis can verify the SQL syntax and flag potential injection risks. It cannot tell you that the query times out under production load or returns unexpected nulls from a third-party API.
Aspect | Static Analysis | Runtime Analysis |
Execution required | No | Yes |
Speed | Fast, runs on every commit | Slower, requires test or production environment |
Coverage | All code paths (theoretically) | Only executed paths |
Detects | Syntax, patterns, known vulnerabilities | Memory leaks, race conditions, performance issues |
Runtime Behaviors That Static Code Review Misses
So what kinds of bugs slip through even the most thorough static review? Let's get specific.
Memory Leaks and Resource Exhaustion
Memory leaks only manifest when code runs repeatedly under load. Static analysis can spot object allocation patterns, but it cannot simulate garbage collection behavior or track memory growth over time. A function might look clean in review yet exhaust memory after a few thousand invocations.
Race Conditions and Concurrency Bugs
Race conditions depend on thread timing during execution. Two threads accessing shared state might work fine in testing and fail unpredictably in production. Static tools see thread creation code. They don't see the timing-dependent failures that emerge at runtime.
API Contract Violations
External services change behavior, return unexpected formats, or time out. Your code might handle the happy path perfectly, but what happens when a third-party API returns a 503? Static analysis cannot predict external service behavior.
State Management Failures
Complex application state emerges from user interactions over time. Static tools see state initialization, not state evolution. A bug that only appears after a specific sequence of user actions won't show up in a diff review.
Performance Regressions Under Load
Code might perform well in isolation but degrade with concurrent users. Only runtime monitoring reveals bottlenecks—slow database queries, inefficient loops, or resource contention that static analysis cannot detect.
Consequences of Missing Runtime Issues in Code Review
What happens when runtime issues slip through? The impact extends beyond individual bugs.
Production Incidents From Approved Pull Requests
Here's a scenario you might recognize: code passes review, merges, deploys, then causes an outage. Everyone followed the process, yet the bug reached production anyway. The review process gave false confidence.
Over time, this erodes trust in code review itself. Teams start to wonder: what's the point if bugs still get through?
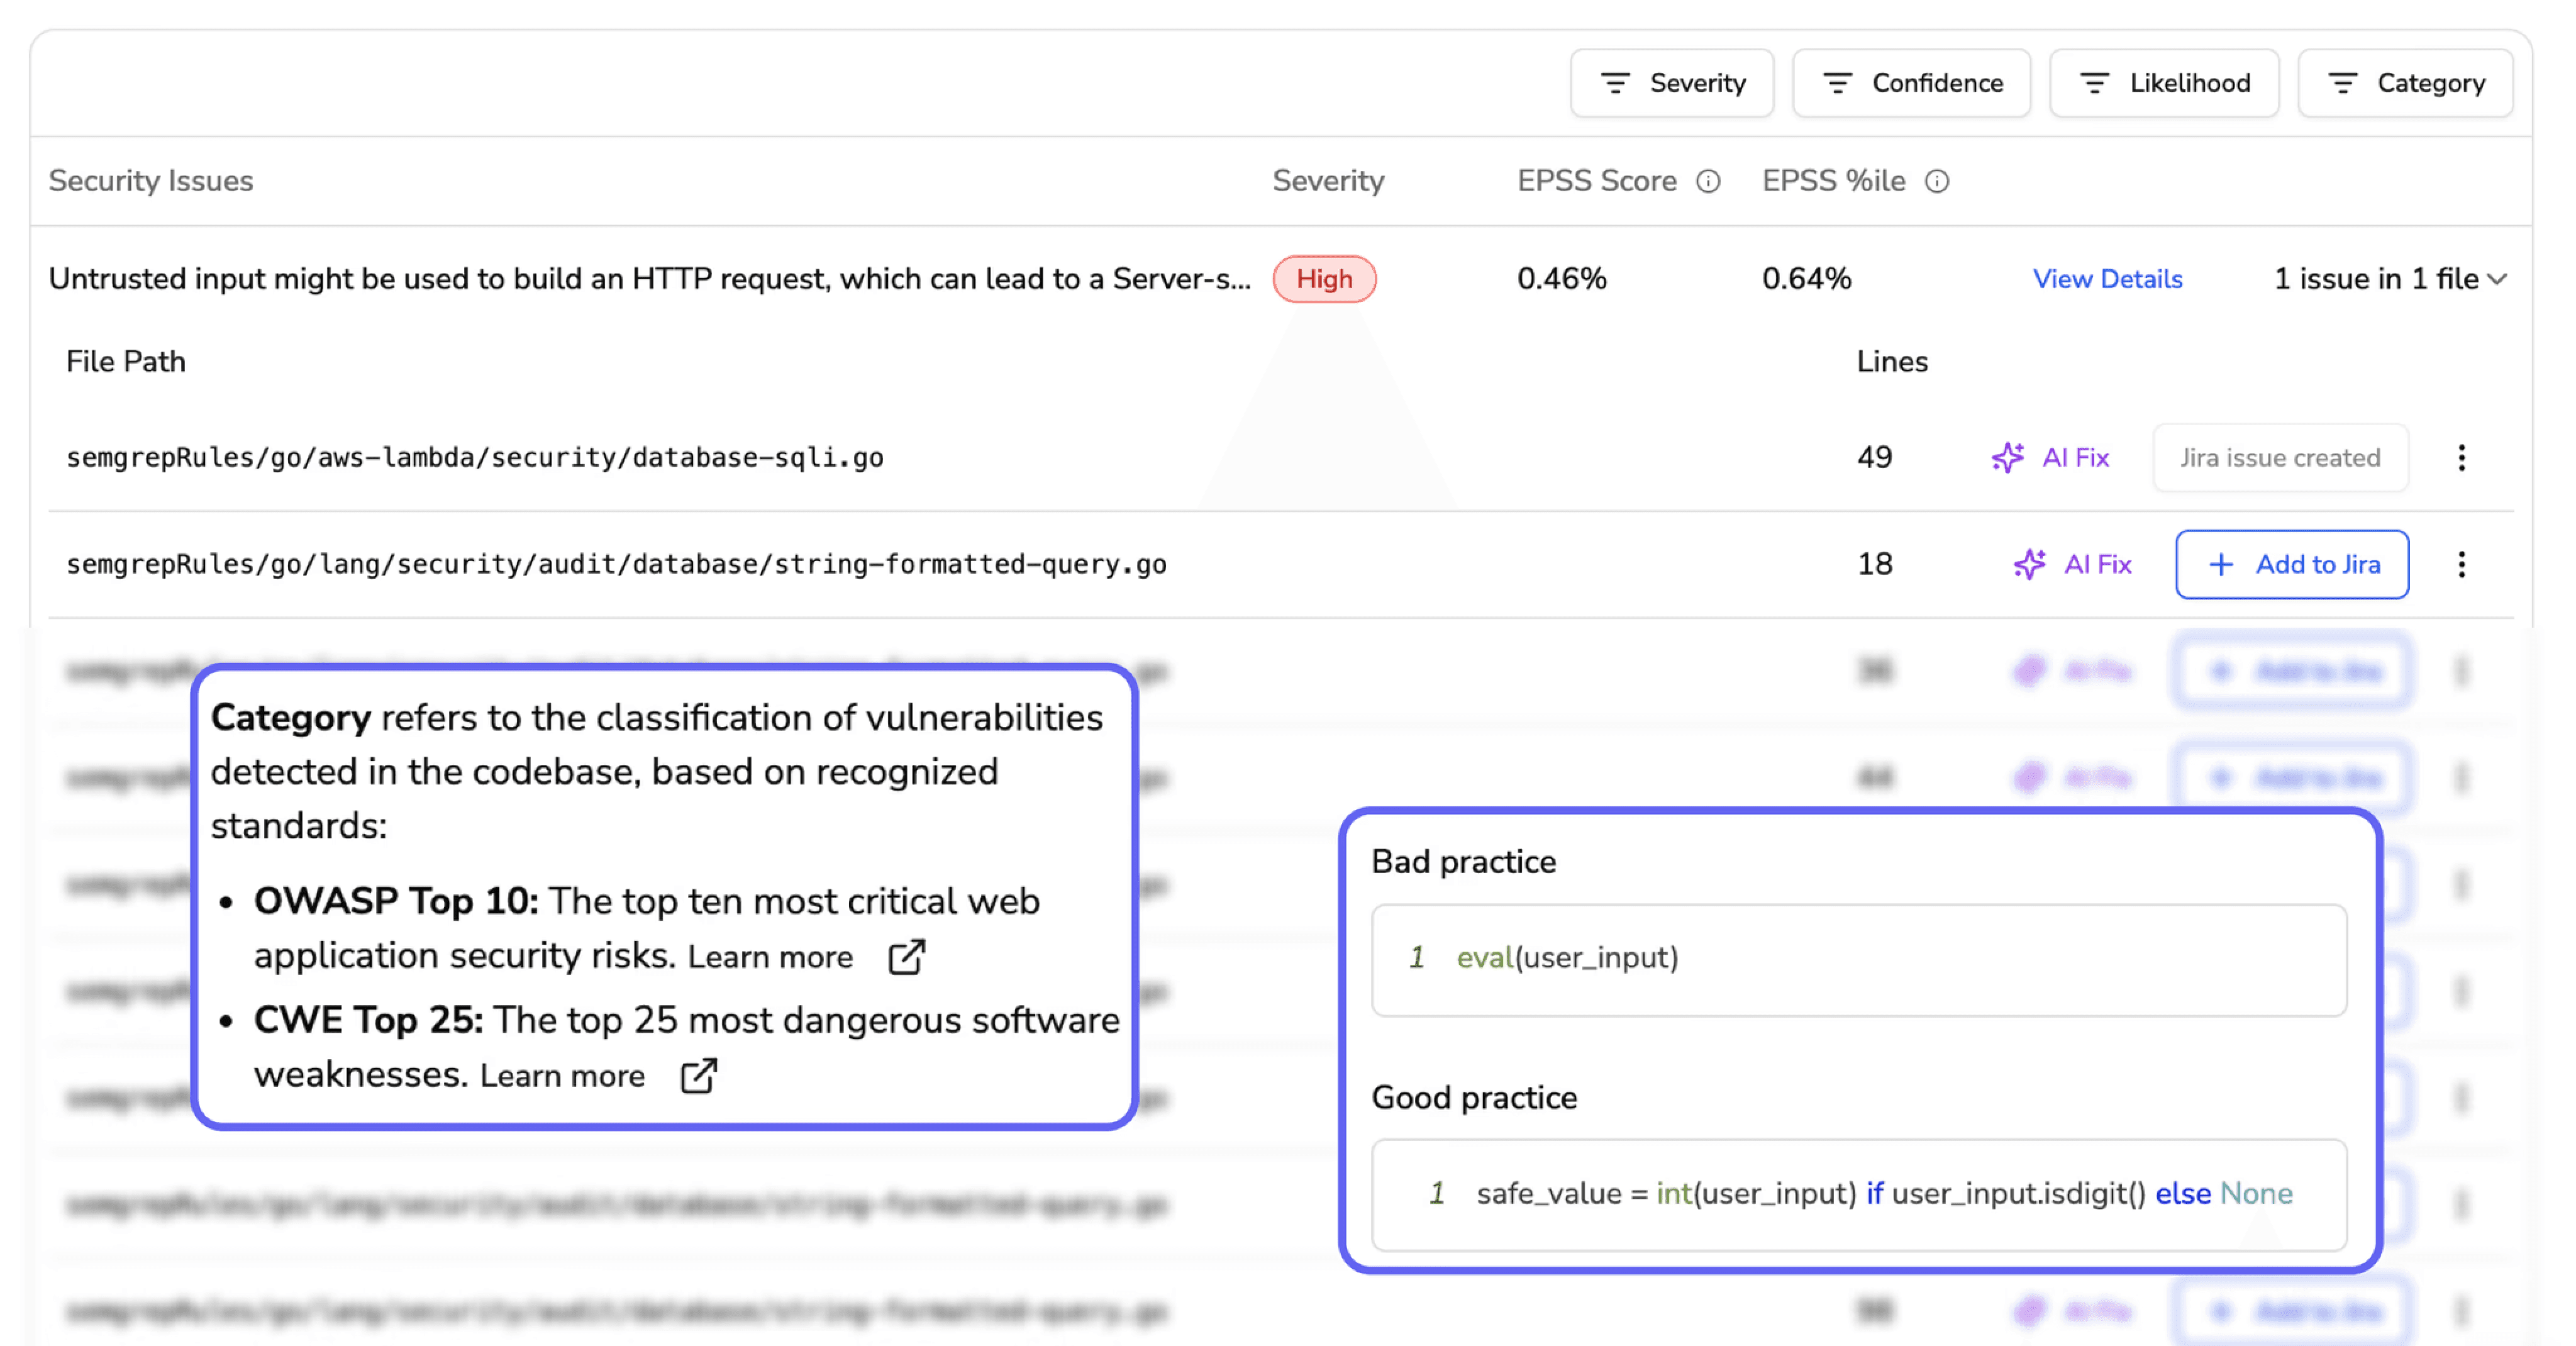
Security Vulnerabilities Discovered Post-Deployment
Some security issues only appear with real user input. Injection attacks, authentication bypasses, and privilege escalation often require runtime context to manifest. Static Application Security Testing (SAST) catches known patterns, but novel attack vectors emerge from actual usage.
Developer Productivity Lost to Debugging
Time spent investigating production bugs that bypassed review creates reactive firefighting. Developers context-switch from building features to debugging incidents. This drains productivity and frustrates teams who thought they'd already reviewed that code.
Why AI Code Review Falls Short on Runtime Visibility
You might assume AI-powered code review solves this problem. After all, AI can understand context and learn patterns. Unfortunately, even AI code review tools still operate on static code representations.
Pattern Matching Without Execution Context
AI models analyze code text and learned patterns. They don't execute code or access production telemetry. The input is still static. A sophisticated AI reviewer might catch more subtle issues than a rule-based tool, but it's still reading the recipe, not tasting the dish.
Training Data Gaps Around Runtime Behavior
AI models train on code repositories, not on APM logs, error traces, or production metrics. They lack the data to predict runtime failures. If a model has never seen examples of a specific memory leak pattern in production, it won't flag similar code in your PR.
False Negatives That Create Dangerous Confidence
When AI approves code that later fails at runtime, teams might trust the tool less—or worse, trust it blindly. A green checkmark from an AI reviewer doesn't guarantee production stability.
Tip: AI code review works best when combined with runtime monitoring. Use AI for fast, early feedback on code quality and security patterns, then validate with integration tests and production observability.
Best Practices for Closing the Runtime Visibility Gap
How do you bridge this gap? The answer isn't abandoning static analysis. It's layering complementary approaches.
1. Combine Static Analysis With Runtime Monitoring
Use static analysis for early feedback and runtime monitoring (APM, observability) for production insights. Neither alone is sufficient. Static tools catch issues before merge. Runtime tools catch issues that only appear in production.
2. Shift Testing Left Without Ignoring Production Signals
Early testing matters, but production signals—error rates, latency, logs—provide feedback that no test environment can fully replicate. Build feedback loops that surface production insights to developers.
3. Use AI That Learns From Your Codebase
Generic AI models miss organization-specific patterns. Tools that learn your team's coding standards, architectural decisions, and historical defects provide more relevant feedback. CodeAnt AI, for example, enforces org-specific standards and learns from your codebase over time.
4. Track Escaped Defect Rate as a Review Metric
Escaped defect rate measures bugs that pass review and reach production. Tracking this metric reveals whether your reviews catch real issues or provide false confidence. If your escaped defect rate is high, your review process has blind spots.
How to Integrate Runtime Feedback Into Code Review Workflows
Let's get practical. How do teams actually connect runtime data to their review process?
Embedding Runtime Checks in CI/CD Pipelines
Add integration tests, smoke tests, and performance benchmarks to your CI/CD pipeline. These simulate runtime conditions before merge:
Integration tests: Validate interactions between components
Smoke tests: Confirm critical paths work after deployment
Performance benchmarks: Detect regressions before they reach production
CodeAnt AI generates sequence diagrams for every PR, capturing the core runtime flow introduced or modified by the change.
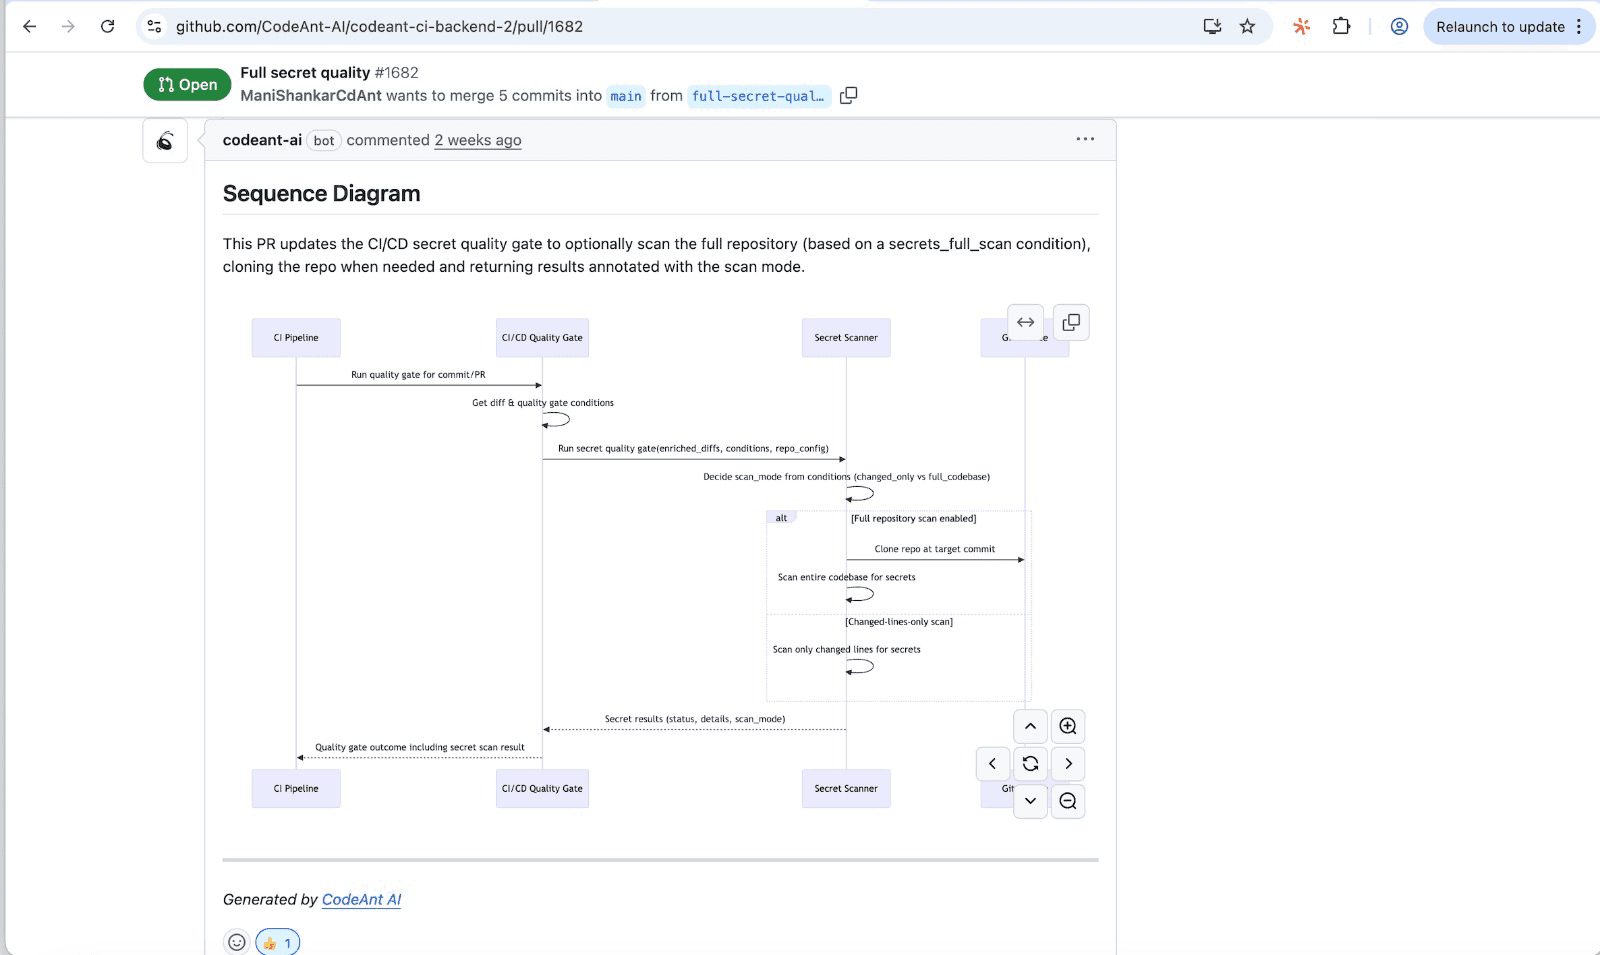
Reviewers get a one-shot, high-signal glance at what the PR actually does—which modules interact, in what order, and where the key decision points happen.
Surfacing Production Insights in Pull Requests
Link observability tools (APM, logging platforms) to pull requests. When a reviewer opens a PR, they see relevant production context for the code they're reviewing. Did this service have recent errors? What's the current latency?
Creating Feedback Loops Between Incidents and Reviews
Post-incident analysis traces bugs back to the originating PR. Use this data to improve future reviews and identify patterns static tools miss. Over time, your team learns which types of issues escape review—and adjusts accordingly.
Building a Complete Code Health Strategy Beyond Static Tools
Runtime visibility isn't a separate concern. It's part of a unified code health strategy. The most effective teams don't juggle disconnected point solutions. They bring code review, security scanning, quality metrics, and continuous feedback into a single view.
CodeAnt AI approaches code health as a continuous, end-to-end concern. The platform combines AI-driven code reviews, security scanning, quality metrics, and developer productivity insights in one place. Rather than forcing teams to context-switch between tools, it provides a unified view of code health across the development lifecycle.
Ready to close the runtime visibility gap?Learn more in depth from our experts.
FAQs
What is the difference between static analysis and runtime analysis?
Can static analysis tools ever detect runtime issues?
How do escaped defects impact developer productivity?
What metrics help teams track code review effectiveness?
Why do some security vulnerabilities only appear at runtime?


