AI Code Review
The Complete Guide to Sequence Diagram Notation

Sonali Sood

Founding GTM, CodeAnt AI
You're staring at a sequence diagram in a design doc, and it's covered in arrows pointing every direction, dashed lines, boxes with cryptic labels, and rectangles you're not sure how to interpret. The notation looks like it should be intuitive, but without knowing what each symbol means, you're just guessing.
Sequence diagrams are one of the most practical tools in software engineering for visualizing how objects interact over time. This guide breaks down every label, arrow, and fragment you'll encounter, so you can read, create, and review sequence diagrams with confidence.
What is a Sequence Diagram in UML?
A sequence diagram is a type of UML (Unified Modeling Language) interaction diagram that shows how objects communicate with each other over time. Unlike class diagrams that show static structure, sequence diagrams capture dynamic behavior—the actual back-and-forth between components as a process unfolds.
The layout is straightforward. Objects sit horizontally across the top, and time flows downward. Every arrow represents a message passed between objects, and where that arrow sits vertically tells you exactly when it happens in the sequence.
Three characteristics define sequence diagrams:
Time-ordered: Interactions flow from top to bottom
Message-focused: Arrows show communication between objects
Behavioral: Captures what happens at runtime, not just what exists
When to Use Sequence Diagrams in Software Engineering
Sequence diagrams work best when you're trying to understand or explain how different parts of a system talk to each other. They're particularly helpful during design reviews, API documentation, and debugging complex flows.
Common scenarios where sequence diagrams add value:
Documenting how a user request travels through microservices
Mapping authentication flows between clients, auth servers, and protected resources
Visualizing request-response patterns during API design
Onboarding new team members to existing system behavior
You might wonder—do you really need a diagram for every interaction? Not necessarily. Sequence diagrams shine for complex flows involving multiple participants. Simple CRUD operations usually don't warrant one.
Essential UML Sequence Diagram Symbols and Notation
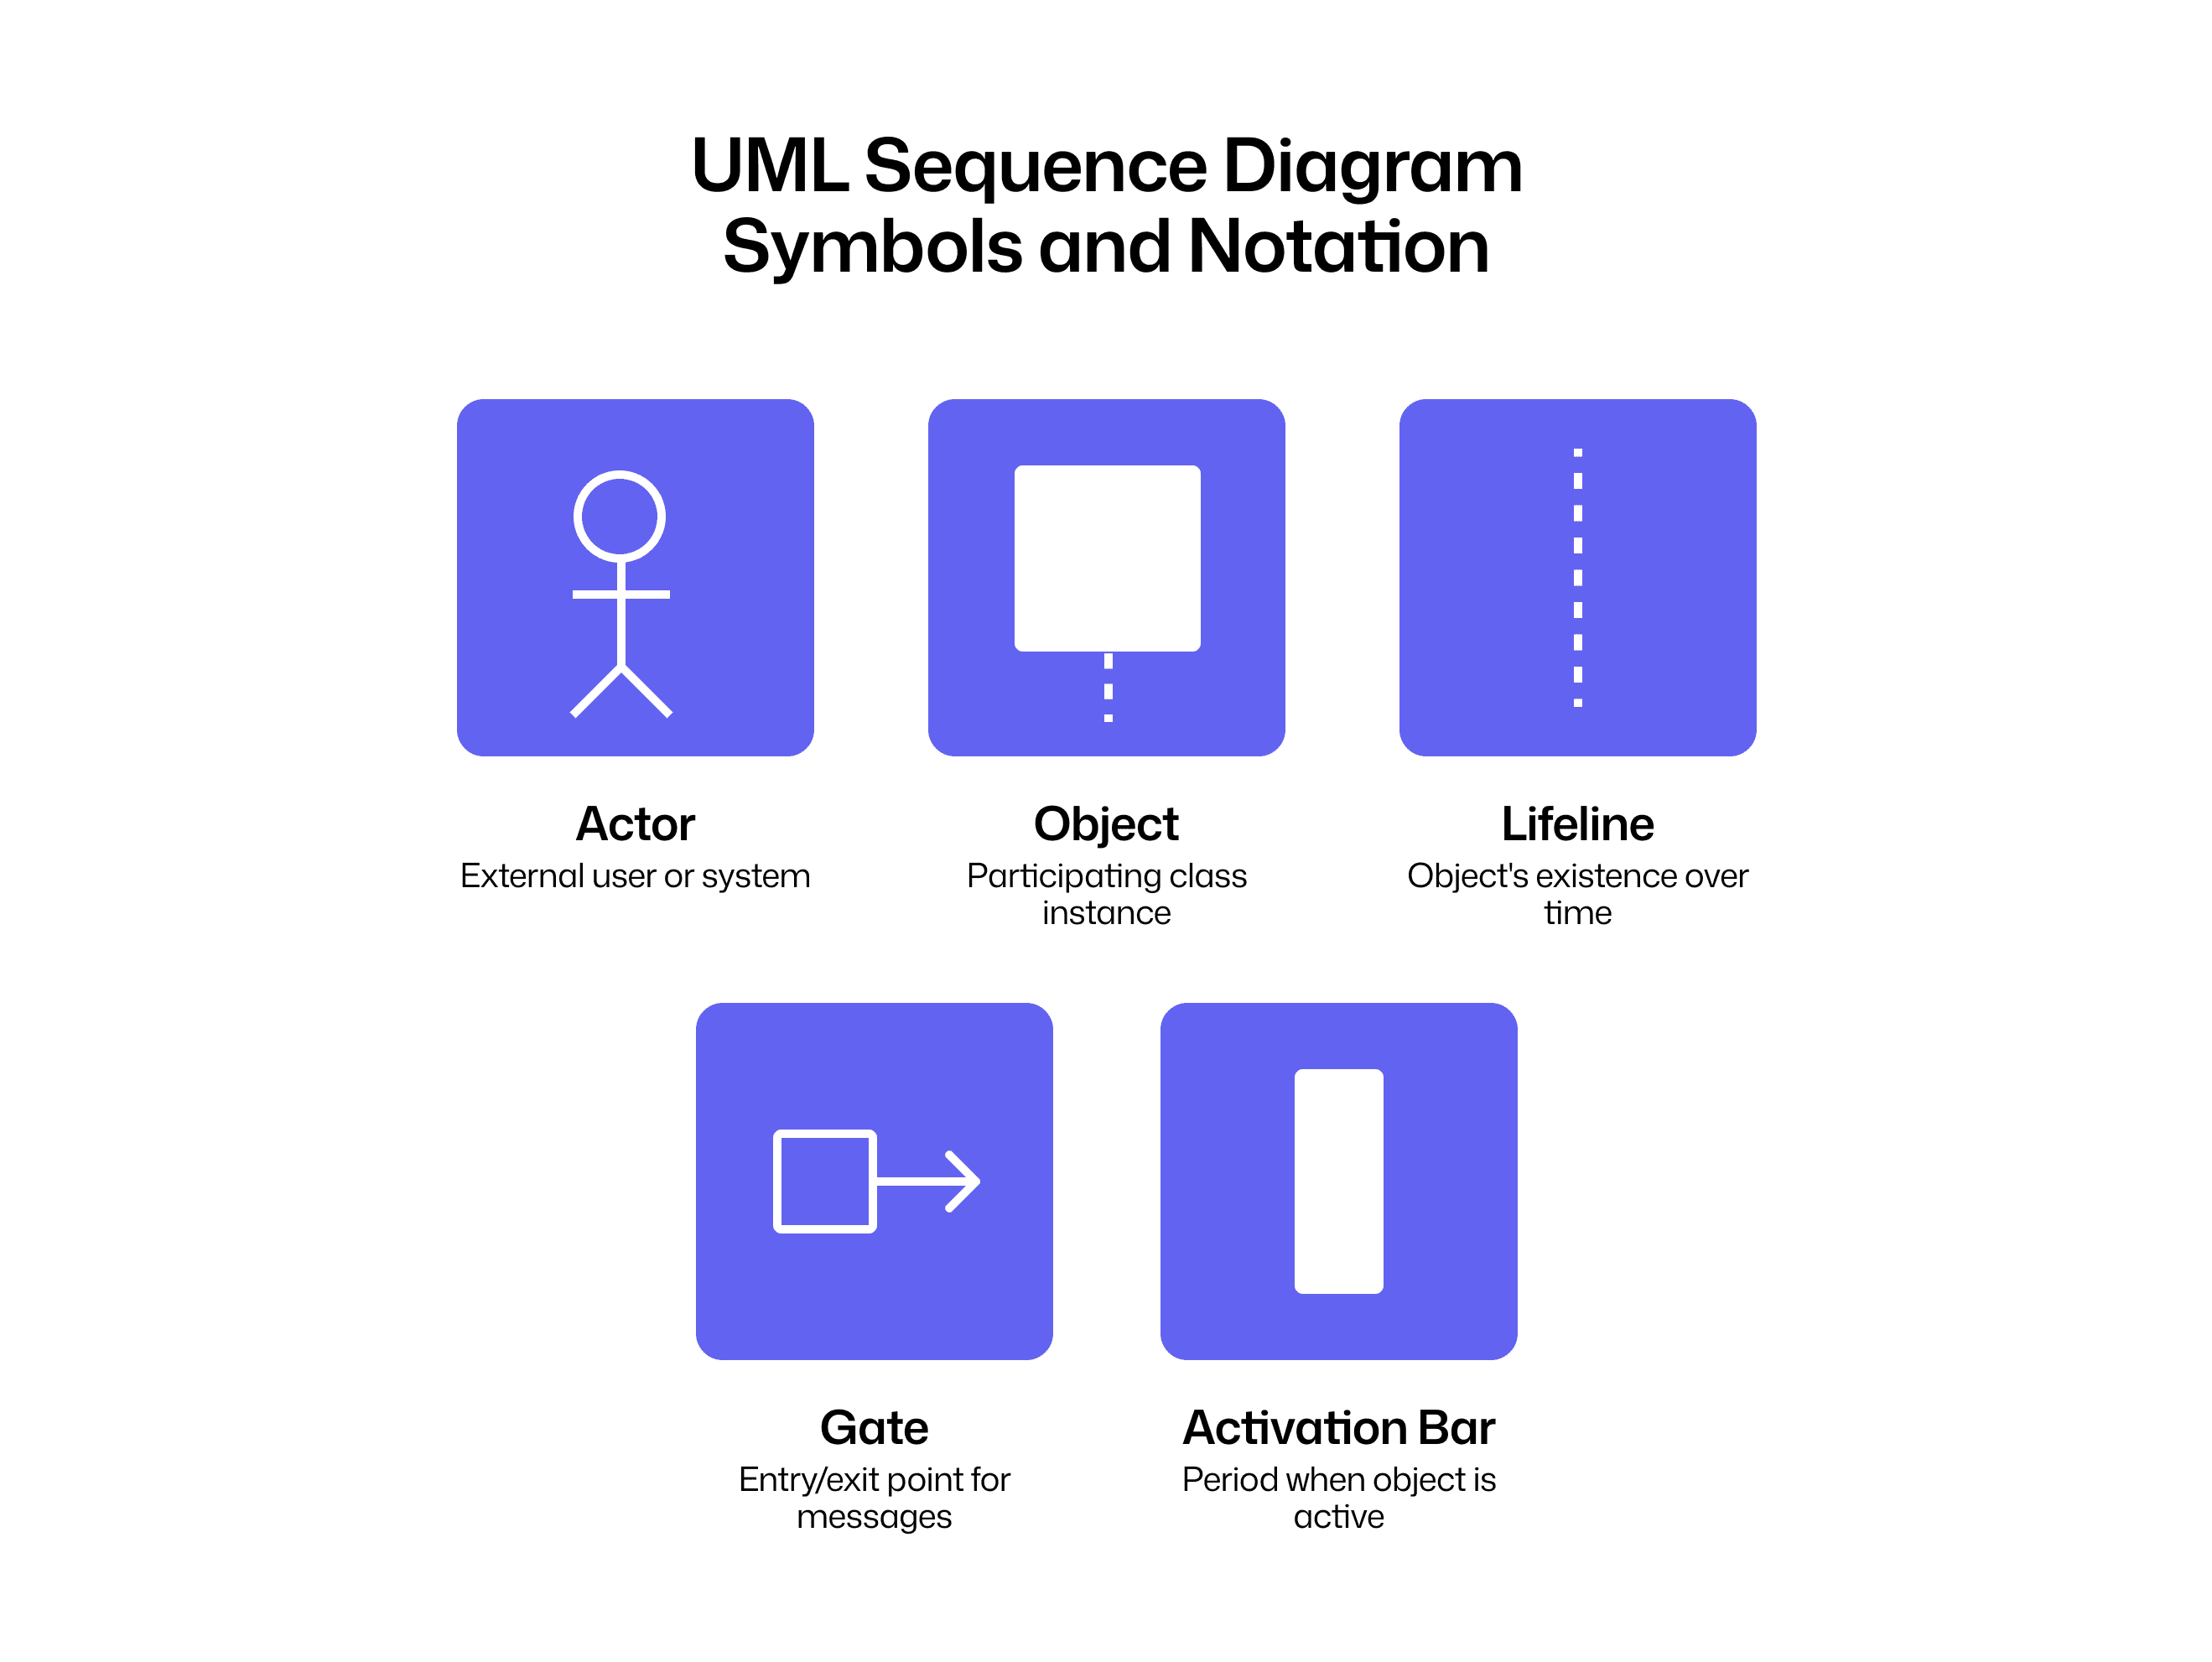
Every sequence diagram uses a standard set of visual elements. Understanding what each symbol means is the foundation for reading and creating effective diagrams.
Symbol | Visual Representation | Meaning |
Actor | Stick figure | External user or system |
Object | Rectangle on lifeline | Participating class instance |
Lifeline | Dashed vertical line | Object's existence over time |
Activation bar | Thin rectangle on lifeline | Period when object is active |
Gate | Point on interaction frame | Entry/exit point for messages |
Actors and Objects
Actors represent external entities—users, external systems, or anything outside your system boundary. Objects are internal class instances that participate in the interaction. Each sits atop its own lifeline, arranged horizontally across the diagram.
Lifelines
The lifeline is a dashed vertical line extending downward from each participant. Time flows from top to bottom along this line. When you see a message arrow pointing to a lifeline, that object is receiving communication at that moment in the sequence.
Activation Bars and Execution Occurrences
Activation bars (also called execution occurrences) are thin rectangles overlaid on lifelines. They indicate when an object is actively performing an action or waiting for a response. The bar starts when the object receives a message and ends when it finishes processing.
Gates and Interaction Boundaries
Gates are named entry and exit points on interaction frames. They connect messages that cross diagram boundaries—useful when referencing another diagram or showing communication with external systems not fully modeled in the current view.
Sequence Diagram Message Types and Arrow Notation
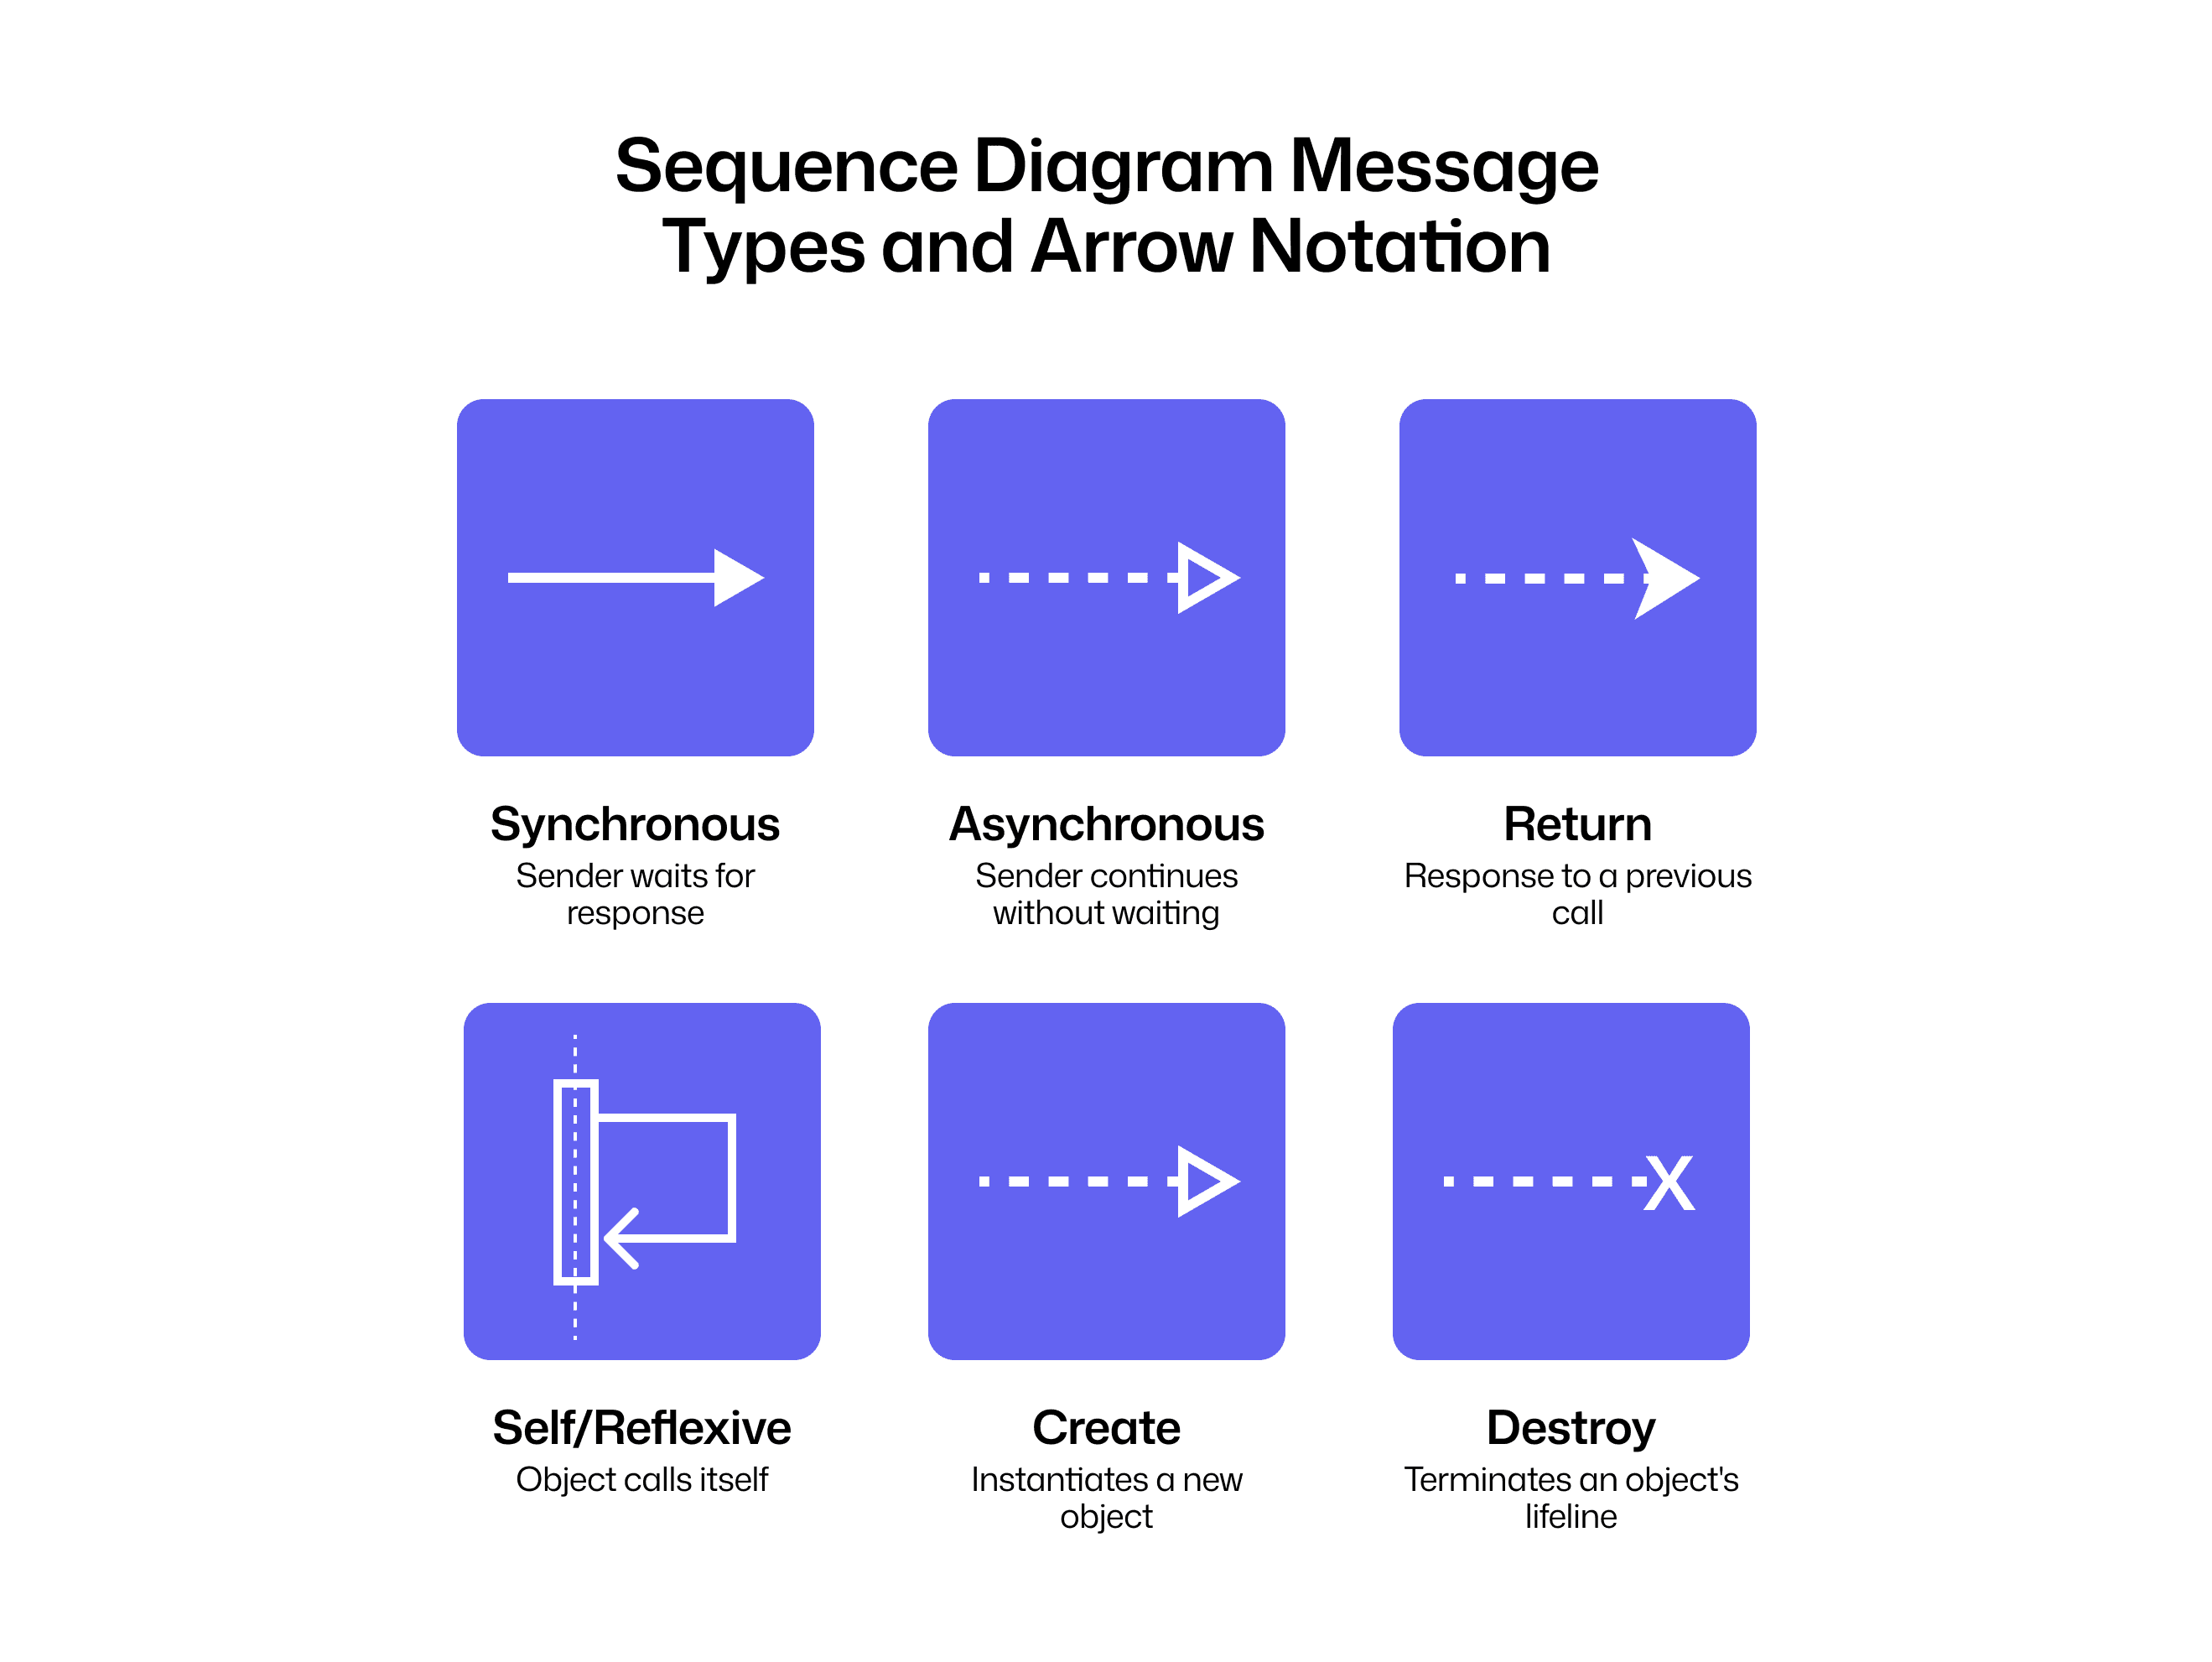
Arrows are the verbs of a sequence diagram. They represent messages passed between lifelines, and the arrow style tells you exactly what type of communication is happening.
Arrow Style | Name | Meaning |
Solid line, filled arrowhead | Synchronous | Sender waits for response |
Solid line, open arrowhead | Asynchronous | Sender continues without waiting |
Dashed line, open arrowhead | Return | Response to a previous call |
Solid arrow to same lifeline | Self/Reflexive | Object calls itself |
Dashed arrow to new object | Create | Instantiates a new object |
Arrow ending in X | Destroy | Terminates an object's lifeline |
Synchronous Messages
A synchronous message appears as a solid line with a filled arrowhead. The sender blocks until the receiver completes processing and returns. This is the most common message type, it maps directly to standard method calls in most programming languages.
Asynchronous Messages
An asynchronous message uses a solid line with an open arrowhead. The sender fires the message and continues execution immediately, without waiting. You'll see asynchronous messages in event-driven architectures, message queues, and callback patterns.
Return Messages
A return message is a dashed line with an open arrowhead pointing back to the original caller. It represents the response flowing back after a synchronous call. While optional in some notations, including return messages makes diagrams much clearer.
Self Messages and Reflexive Calls
Self messages are arrows that loop back to the same lifeline. Self messages represent an object invoking its own method, common when an object performs internal processing or validation before continuing the interaction.
Create Messages
A create message is a dashed arrow pointing to a new object rectangle. It shows object instantiation during the interaction. The new object's lifeline begins at the point where the create message arrives.
Destroy Messages
A destroy message ends with an X symbol at the bottom of a lifeline. It indicates the object is terminated and no longer available for further communication. Destroy messages appear when modeling resource cleanup or session termination.
Lost and Found Messages
Lost messages are arrows ending in a black circle, sent but never received. Found messages start from a black circle, received from an unknown source. Both handle edge cases where you're modeling partial system views or error scenarios.
Combined Fragments for Loops and Conditional Logic
Combined fragments are rectangular frames that group messages under specific conditions. They add control flow to otherwise linear diagrams, letting you model branching, iteration, and parallel execution.
Common fragment operators:
alt: Models if-else branching with multiple conditions
opt: Models optional execution (single condition)
loop: Repeats messages while a condition holds
break: Exits the enclosing fragment when condition is true
par: Runs multiple message flows in parallel
ref: References another sequence diagram
Alt Fragment for If-Else Conditions
The alt operator models if-else logic. Guard conditions appear in square brackets like [balance >= amount], and horizontal dashed lines separate the alternative paths. Only one path executes based on which guard evaluates to true.
Opt Fragment for Optional Sequences
The opt fragment is a simplified alt with only one condition. The enclosed messages execute only if the guard is true—otherwise, the entire fragment is skipped.
Loop Fragment for Iterations
The loop operator repeats the messages inside it while its guard condition holds. You can include optional min/max bounds like loop(1,5) to specify iteration limits.
Break Fragment for Exceptions
The break fragment provides an early exit from an enclosing fragment. When its guard is true, the remaining messages in the enclosing fragment are skipped. Break fragments are useful for modeling error handling and exception flows.
Par Fragment for Parallel Execution
The par fragment divides the frame into regions that execute concurrently. Message order within each region is preserved, but the regions can interleave. Use par when modeling multi-threaded operations or parallel API calls.
Ref Fragment for Reusable Diagram References
The ref fragment acts as a pointer to another interaction diagram. Ref fragments keep diagrams modular and avoid duplication—especially valuable when the same sub-sequence appears in multiple flows.
How to Create a Sequence Diagram Step by Step
Building a sequence diagram follows a logical progression. Here's a practical walkthrough.
1. Identify the scenario or use case
Each diagram captures one specific interaction. Start by defining the scope: "user logs in," "order is placed," or "payment is processed." Trying to model too much in a single diagram leads to confusion.
2. Define all participants and objects
List the actors, systems, and objects involved. Place them horizontally across the top of the diagram, typically ordered from left to right based on when they first participate.
3. Map the message sequence and flow
Draw arrows in chronological order from top to bottom. Label each arrow with the method or action name. Be specific, validateCredentials() is more useful than process.
4. Add activation bars and returns
Show when each object is actively processing by adding activation bars. Add return arrows for synchronous calls to make the response flow explicit.
5. Apply fragments for complex logic
Wrap conditional or repeating message groups in the appropriate combined fragment. Use alt for branching, loop for iteration, and opt for optional steps.
6. Review and validate your diagram
Walk through the diagram with stakeholders to confirm it matches expected system behavior. Check that every synchronous call has a corresponding return.
Sequence Diagram Best Practices for Clear Documentation
Creating readable, maintainable diagrams takes practice. A few guidelines help avoid common pitfalls.
Focus each diagram on a single scenario
Avoid cramming multiple use cases into one diagram. Split complex flows into separate diagrams and use ref fragments to connect them.
Use consistent naming conventions
Apply the same naming style across all messages and participants. If your codebase uses camelCase, your diagrams follow the same pattern.
Maintain logical vertical ordering
Arrange participants from left to right in the order they first interact. Keep the message flow progressing downward without unnecessary crossings.
Limit participants to improve readability
Too many lifelines create visual clutter. If you have more than seven or eight participants, consider splitting the diagram or abstracting some components.
Document guard conditions explicitly
Write clear boolean expressions in square brackets. [balance >= amount] is far more useful than [valid].
Common Sequence Diagram Mistakes and How to Fix Them
Even experienced developers make errors when creating sequence diagrams. Knowing what to watch for helps you create cleaner diagrams.
Missing return messages: Always show responses for synchronous calls
Unclear activation bars: Ensure bars start and end at the correct message points
Overloaded diagrams: Break large diagrams into smaller, focused ones
Ambiguous message labels: Use descriptive method names, not vague labels like "process"
Ignoring error paths: Include
altfragments for exception handling
How Sequence Diagrams Support Faster Code Reviews
Sequence diagrams connect directly to the code review process. When reviewers can see the intended interaction flow before reading code, they understand context faster and catch design issues earlier.
For every pull request, a well-crafted sequence diagram captures the core runtime flow introduced or modified by the change. Reviewers get a quick, high-signal glance at what the PR actually does—which modules interact, in what order, and where the key decision points happen.
Teams using AI-powered code review tools like CodeAnt AI can automate pull request analysis while sequence diagrams provide the design context. The combination helps reviewers identify what changed, where it propagates, and what could break.
Ready to accelerate your code reviews?Book your 1:1 with our experts today!
FAQs
What is the difference between a sequence diagram and a communication diagram?
How do you indicate data structures in sequence charts?
What does the dotted arrow represent versus a solid arrow?
What is the difference between a system sequence diagram and a detailed sequence diagram?
How do sequence diagrams connect to actual code implementation?


