AI Code Review
How to Use Sequence Diagrams for Side Effect Detection

Sonali Sood

Founding GTM, CodeAnt AI
A function called validateOrder() that quietly updates inventory counts. A "read-only" API endpoint that fires analytics events to three external services. These are side effects, state changes that happen outside a function's obvious scope, and they're responsible for some of the most frustrating bugs in production.
Sequence diagrams expose these hidden behaviors by visualizing exactly which objects communicate, in what order, and what state changes along the way. This guide covers how to read sequence diagrams for side effect detection, the patterns that signal risk, and a repeatable process for catching unintended consequences before they ship.
Why Side Effects Hide in Complex Code Interactions
Sequence diagrams reveal hidden side effects by visualizing the temporal order and interaction flow between components in a system. When you read code line by line, you see individual method calls. What you don't see is how those calls ripple across objects, modify shared state, or trigger unexpected downstream changes.
A side effect occurs when code modifies state outside its local scope. Think of a function that updates a database or fires an event, even though its name suggests it only reads data. In systems with dozens of interacting services, unintended consequences become nearly impossible to spot through code reading alone.
Here's where side effects typically hide:
Shared mutable state: Multiple objects modify the same data, and the order of modifications matters
Implicit dependencies: A function relies on external state not passed as a parameter
Callback chains: Asynchronous operations trigger unexpected downstream changes
Observer patterns: A single state change notifies multiple listeners, each with its own behavior
The problem compounds as systems grow. A single API call might touch five services, update three databases, and publish two events. All of that remains invisible from the calling code.
What Are Sequence Diagrams and How Do They Reveal Hidden Risks
A sequence diagram is a type of UML interaction diagram that shows how objects communicate over time. Unlike static class diagrams, sequence diagrams capture the dynamic behavior of your system: who calls whom, in what order, and what happens as a result.
Sequence diagrams reveal hidden risks by making implicit interactions explicit. When you draw out every message between components, you can't hide behind assumptions about how data flows.
Visual Mapping of Object Interactions
Each object appears as a vertical lifeline running down the page. This layout immediately shows which components participate in an interaction. You might discover that a "simple" user registration flow actually touches authentication, billing, email, and analytics services. That's four potential sources of side effects you didn't expect.
Tracing Message Flows Between Components
Horizontal arrows represent messages: method calls, API requests, or events. Following the arrows reveals the complete path data travels through your system. You'll often find calls to objects you didn't expect, especially in legacy codebases where dependencies have accumulated over time.
Capturing State Changes Over Time
Reading a sequence diagram from top to bottom shows chronological order. This timeline dimension clarifies when state changes occur relative to other operations. A race condition that's invisible in code becomes obvious when you see two parallel arrows competing for the same resource.
Sequence Diagram Components That Expose Side Effects

Understanding the notation helps you read diagrams effectively. Here's what each element reveals:
Component | Visual Representation | What It Reveals |
Lifeline | Vertical dashed line | Objects participating in interaction |
Activation bar | Narrow rectangle on lifeline | When an object is actively processing |
Synchronous message | Solid arrow with filled head | Blocking call that waits for response |
Asynchronous message | Solid arrow with open head | Non-blocking call that continues without waiting |
Return message | Dashed arrow | Response data flowing back |
Combined fragment | Labeled rectangle (opt, alt, loop) | Conditional or repeated execution |
Lifelines and Object Activation Bars
A lifeline represents an object's existence during the interaction. The activation bar, a thin rectangle on the lifeline, shows when that object holds control. Long activation bars might indicate blocking operations that could cause timeouts or deadlocks.
Synchronous and Asynchronous Messages
Synchronous messages block the sender until receiving a response. Asynchronous messages fire and forget. Async messages often hide side effects because the sender moves on before consequences occur. You might not realize a background job is modifying data until something breaks.
Return Messages and Response Handling
Dashed arrows show return values flowing back to callers. Return values reveal what data propagates through your system. Sometimes a return value triggers additional operations in the caller, creating side effects that aren't obvious from the original method signature.
Combined Fragments for Conditional Logic
Combined fragments use labels like opt (optional), alt (alternative), loop, and break to show conditional or iterative behavior. Combined fragments expose hidden execution paths where side effects only occur under specific conditions. Those are exactly the scenarios that slip through testing.
How to Identify Risky State Transitions
A state transition is a change in an object's data or condition. Some transitions are expected. Others signal potential problems.
Spotting State Mutations Across Multiple Objects
Look for messages that cause receiving objects to modify their internal state. When a single initiating action triggers state changes in multiple objects, you've found a potential side effect risk. The more objects that change, the harder it becomes to reason about system behavior.
Tracing Cascading Changes from Single Actions
Follow the chain reaction. One message triggers another, which triggers another. Map this cascade to understand how far a single action's effects extend. In microservices architectures, a cascade might cross service boundaries. Each hop adds latency and failure risk.
Mapping Error Propagation Paths
What happens when operations fail? Sequence diagrams with alt fragments can show error handling paths. Trace error paths to identify scenarios where errors propagate unexpectedly or leave the system in an inconsistent state.
Common Side Effect Patterns in Sequence Diagrams
Once you know what to look for, certain patterns become recognizable warning signs.
Unintended Database Modifications
A method named getUser() that actually updates a "last accessed" timestamp. A validation function that logs to a database. Look for messages flowing to persistence layers from operations that appear read-only.
Hidden External Service Dependencies
Diagrams often reveal calls to external APIs, third-party services, or other microservices that aren't obvious from the calling code. Each external dependency creates coupling and potential failure points. External dependencies become especially problematic when buried deep in a call chain.
Race Conditions in Async Operations
Parallel async messages drawn at the same vertical level can cause race conditions. The diagram reveals when two operations might compete for the same resource. If both messages modify shared state, the outcome depends on timing. That's a classic source of intermittent bugs.
Circular Dependencies Between Components
Watch for loops where Object A calls Object B, which eventually calls back to Object A. Circular dependencies create complex state management challenges. A circular dependency often means state can change unexpectedly during what appears to be a straightforward operation.
Step-by-Step Process for Detecting Side Effects
Here's a repeatable process you can apply to any interaction you want to analyze.
1. Map the Primary Interaction Flow
Start with the happy path. Identify the initiating actor and draw the sequence of messages required to complete the main operation. Don't worry about edge cases yet. Just capture what's supposed to happen.
2. Identify All State-Changing Messages
Mark every message that modifies data: database writes, cache updates, property changes, event publications. Use color or annotations to highlight state-changing messages. This step often reveals more state changes than you expected.
3. Trace Secondary Effects from Each Change
For each state-changing message, ask: "What else does this trigger?" Follow observers, event handlers, webhooks, and callbacks. Secondary effects are where hidden side effects live.
4. Highlight Risk Points and Dependencies
Annotate the diagram with risk markers. Flag shared state access, external dependencies, conditional logic, and async operations. Risk annotations become a checklist for code review.
5. Validate Against Expected System Behavior
Compare the complete diagram against requirements. Any message or state change not explicitly required is a potential unintended side effect. Question whether each interaction is intentional.
Using Sequence Diagrams in Code Review
Sequence diagrams become powerful when integrated into your review workflow.
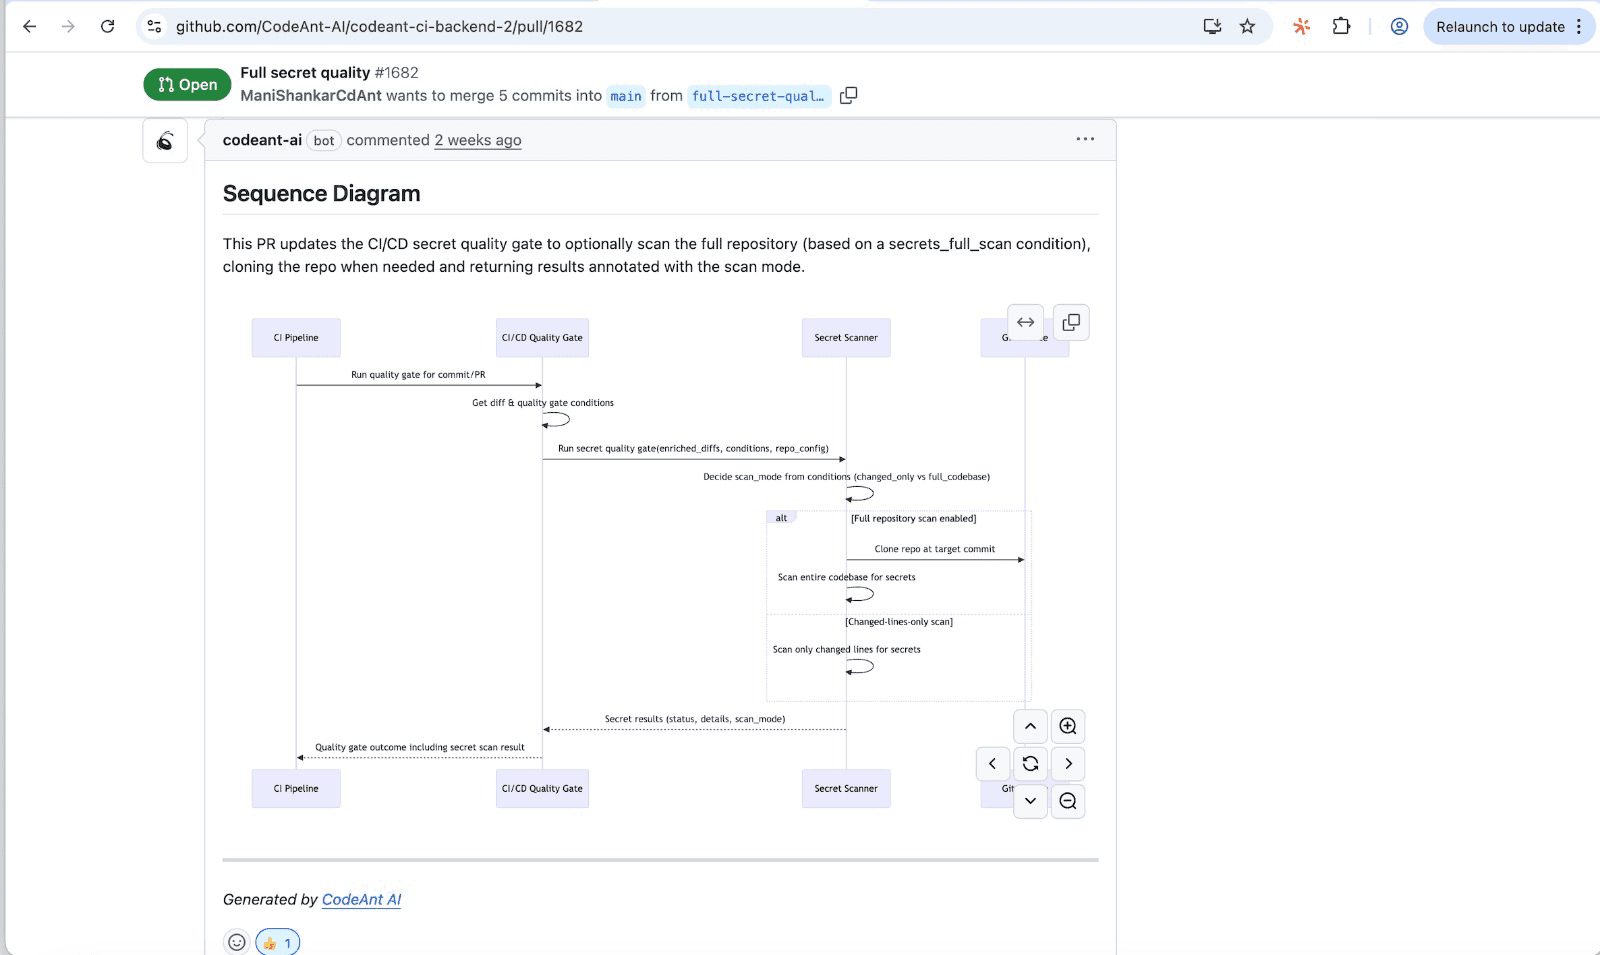
Visualizing Pull Request Impact
Creating a sequence diagram for a PR's changed code paths reveals the true scope of changes. A "small" PR that modifies a shared utility function might affect dozens of interaction flows. The diagram makes this impact visible to reviewers who aren't familiar with every affected component.
Communicating Risk to Reviewers
Instead of writing lengthy PR descriptions explaining complex interactions, attach a diagram. Reviewers can immediately see what changed, where it propagates, and what could break. This shared visual language speeds up reviews and reduces misunderstandings.
Documenting Decisions for Future Maintainability
Stored sequence diagrams become living documentation. Future developers can understand why certain interactions exist and what side effects to watch for when modifying code. Unlike comments that rot, diagrams tied to specific flows remain relevant.
Limitations of Manual Sequence Diagram Analysis
Manual diagramming has real drawbacks worth acknowledging.
Time-Intensive Creation Process
Creating accurate sequence diagrams requires reading code, understanding control flow, and drawing the diagram. For complex interactions, this can take hours. Fast-moving teams often skip diagramming because the overhead feels too high.
Diagrams Become Outdated Quickly
As code evolves, manually created diagrams drift from reality. Without continuous updates, outdated diagrams mislead rather than help. Outdated documentation is sometimes worse than no documentation.
Difficulty Scaling Across Large Codebases
Manual analysis doesn't scale. Large systems have thousands of interaction paths. No team can diagram all of them by hand. Even if they could, maintaining all of those diagrams would be a full-time job.
Automate Side Effect Detection Across Your Codebase
The principles behind sequence diagram analysis, tracing interactions, identifying state changes, and flagging risks, can be automated.
AI-Powered Code Analysis for Hidden Risks
AI-driven code analysis tools trace interaction flows, identify state-changing operations, and flag potential side effects during code review. CodeAnt AI analyzes every pull request automatically, surfacing hidden risks without requiring manual diagram creation. The platform understands your codebase's patterns and highlights when a change might cause unintended consequences.
Continuous Monitoring in Your Development Workflow
Continuous, automated analysis integrated into CI/CD pipelines catches side effects before they reach production. Every PR gets analyzed. Every risky transition gets flagged. Your team gets the benefits of sequence diagram thinking without the manual overhead.
FAQs
What is the difference between sequence diagrams and collaboration diagrams for detecting side effects?
How detailed should a sequence diagram be to reveal hidden risks effectively?
Can sequence diagrams help detect side effects in microservices architectures?
How do sequence diagrams compare to static analysis for finding side effects?
How do teams scale side effect detection without manually drawing diagrams?


