AI Code Review
How to Add Static Code Analysis to Azure DevOps Pipelines

Sonali Sood

Founding GTM, CodeAnt AI
Your Azure DevOps pipeline catches syntax errors just fine, but the security vulnerability that ships to production? The code smell that compounds into a three-day refactor? Those slip through because traditional static analysis tools drown your team in false positives while missing the issues that actually matter. When 40-60% of flagged issues turn out to be noise, developers stop trusting the tools entirely.
What are static code analysis tools in Azure DevOps? They're automated code scanners that examine your source code without executing it, identifying potential security vulnerabilities, quality issues, and standards violations directly within your CI/CD workflow. But here's the problem: most static analysis tools use rule-based pattern matching that can't distinguish between actual vulnerabilities and safe code patterns in your specific framework context.
This guide breaks down how to implement static analysis that developers actually trust in Azure DevOps, from YAML configuration and branch policies to the AI-powered approaches that understand code context the way senior developers do. You'll learn why traditional tools struggle, how to set up enforceable quality gates without blocking velocity, and what separates noise-generating scanners from platforms that accelerate your workflow while improving security posture.
Why Traditional Static Analysis Fails in Azure DevOps
Static analysis in Azure DevOps should catch real issues before merge, SQL injection vulnerabilities, hardcoded secrets, authentication bypasses. Instead, most tools generate 15-20 findings per PR, forcing developers to spend 30 minutes investigating only to discover 12 are false positives. After a few weeks of this, teams disable the checks or ignore them entirely.
The Root Problem: Pattern Matching Without Context
Traditional SAST tools follow a three-stage process unchanged for two decades:
Parse code into Abstract Syntax Trees (AST): Break down source files into hierarchical representations of code structure
Match patterns against rule sets: Compare AST patterns against thousands of predefined rules derived from OWASP Top 10, CWE, and language anti-patterns
Report issues: Surface findings via PR comments, pipeline failures, or work item creation
This approach provides comprehensive coverage but lacks contextual understanding. The engine can't distinguish between a vulnerable query built from unsanitized user input and a safe query using validated parameters. Result: 40-60% false positive rates that create alert fatigue and slow pipeline throughput.
Real-world example: Traditional tools flag this as SQL injection:
But FromSqlInterpolated automatically parameterizes the query, it's safe. The tool sees string interpolation in a SQL context and flags it, regardless of framework protections. This is the pattern across every modern framework: React's auto-escaping, .NET Core's built-in XSS protection, Spring Boot's security configurations, all flagged as vulnerabilities because rule engines can't understand framework semantics.
False Positives Kill Developer Trust
The adoption curve for traditional static analysis follows a predictable pattern:
Timeline | Developer Behavior | Impact |
Week 1-2 | High engagement, thorough investigation | Every false positive erodes credibility |
Week 3-6 | Pattern-matching "known false positives" | Teams create suppression files, disable rules |
Month 2-3 | Bypass quality gates, ignore findings | Tool becomes compliance checkbox only |
Month 4+ | Analysis runs but PRs merge regardless | Security posture returns to baseline |
For Azure DevOps teams managing 100+ developers, this means your $50K/year SAST investment becomes shelfware within a quarter. The tool runs, reports generate, dashboards show coverage, but actual code health doesn't improve because developers don't trust the signal.
Configuration Overhead at Scale
Enterprise static analysis tools require weeks of setup and ongoing maintenance:
Infrastructure: Self-hosted servers, databases, caching layers, agent configuration
Rule tuning: Language-specific profiles, framework-aware adjustments, baseline creation for legacy code
Tool sprawl: Separate dashboards for SAST, SCA, secrets detection, each requiring its own integration
Administration: 1-2 dedicated "tool admins" managing configurations, triaging false positives, fielding developer complaints
Traditional tools force you to choose: strict enforcement with high false positives that block velocity, or loose configuration that misses real vulnerabilities. Neither option is acceptable at scale.
Implementing Static Analysis in Azure DevOps: The Practical Guide
Successful implementation isn't about flipping a switch, it's about building developer trust while incrementally improving code health. Here's how to integrate analysis that delivers value from day one. But before that check out this Azure DevOps in-depth pipeline explained here.
Azure Pipeline Integration: YAML Configuration
Static analysis integrates into Azure DevOps through pipeline tasks that trigger during PR validation or scheduled scans. Here's the basic pattern:
Key decisions:
Incremental vs. full scanning: Run full scans nightly on
main, incremental scans on PRs. This keeps PR validation under 2 minutes while maintaining comprehensive coverage.Hosted vs. self-hosted agents: Microsoft-hosted agents work for most teams with cloud-based tools. Self-hosted agents are necessary only for air-gapped environments or codebases that can't leave your network.
Parallel execution: For monorepos, split analysis by service or language using matrix strategies to reduce total pipeline time.
Branch Policies and Quality Gates
Azure DevOps branch policies enforce code quality by requiring successful analysis before merge. Configure these under Project Settings → Repositories → Branch Policies:
Progressive enforcement strategy:
Week 1-2: Advisory only: Analysis runs, decorates PRs with comments, never blocks merges
Week 3-4: Block critical issues: Enforce gates for high-severity vulnerabilities (SQL injection, secrets, auth bypasses)
Week 5+: Full enforcement: Expand to quality issues with exemption workflows for edge cases
Quality gate best practices:
Set absolute thresholds ("critical issues < 5") not relative ones ("no new issues")
Separate blocking checks (security) from advisory (code smells)
Configure 12-24 hour expiration to force re-validation after upstream changes
Use build expiration to prevent stale analysis from blocking active PRs
PR Decoration: Surfacing Findings Where Developers Work
The difference between ignored tools and adopted platforms comes down to friction. Inline PR decoration matters because developers see findings exactly where they already work, no context switching to external dashboards.
Effective PR decoration includes:
Inline code annotations: Comments on specific lines showing what needs attention and why
Severity-based filtering: Critical/high issues block merges, medium/low generate warnings
Framework-specific explanations: Not just "SQL injection detected" but "Input from Request.Query flows to database without parameterization"
Auto-dismiss resolved findings: When developers fix issues and push updates, corresponding comments automatically close
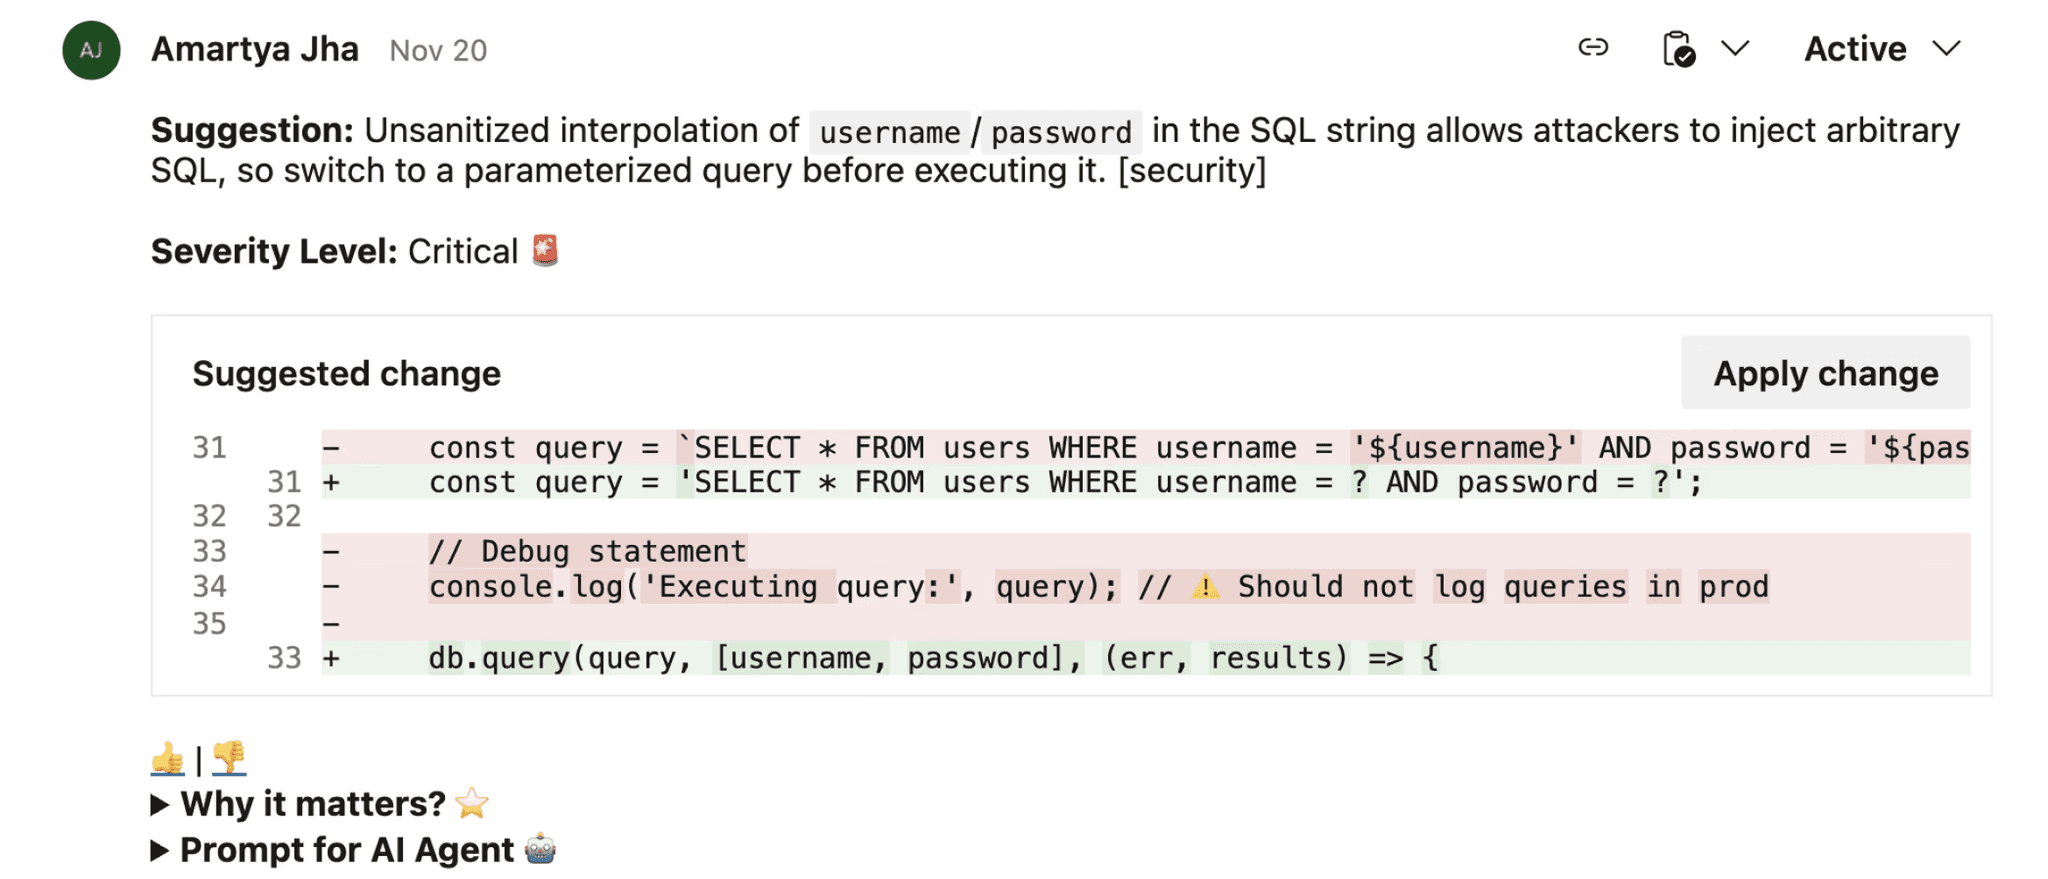
CodeAnt AI's Azure DevOps integration generates AI-powered fix suggestions directly in PR comments, allowing developers to apply remediation with one click rather than researching solutions.
Handling Monorepos and Multi-Service Architectures
For organizations with 10+ services in a single repository, path-based filtering prevents wasting time analyzing unaffected code:
Monorepo optimization strategies:
Automatic dependency detection: Tools should scan changed files plus their dependencies, not the entire repo
Service-level policies: Different quality gates for customer-facing APIs vs. internal services
Parallel analysis jobs: Run separate scans per service simultaneously, aggregate results
CodeAnt AI automatically detects cross-service dependencies and scans only affected components, reducing PR validation from 20+ minutes to under 2 seconds for typical changes.
How AI-Powered Analysis Changes the Game
Context-aware AI analysis solves the fundamental limitations of rule-based engines by understanding code the way senior developers do, recognizing framework patterns, business logic intent, and architectural context.
Semantic Understanding Reduces False Positives by 60-80%
Instead of matching syntax patterns, AI models trained on billions of lines of code recognize that this is safe:
The AI understands:
Route constraint validates
userIdas integer at framework levelFromSqlRawwith integer parameters can't be exploited via injectionThis is a common, safe pattern in ASP.NET Core applications
Traditional tools flag this universally. AI-powered analysis recognizes the context and marks it safe, reducing noise by 60-80% while maintaining security rigor.
Framework-Aware Analysis Catches What Rules Miss
CodeAnt's AI understands modern framework conventions across 30+ languages:
ASP.NET Core: Recognizes
[ValidateAntiForgeryToken], model binding validation, built-in XSS protectionReact: Distinguishes between safe JSX auto-escaping and actual
dangerouslySetInnerHTMLrisksSpring Boot: Understands
@PreAuthorize, security configurations, parameterized JPA queriesNode.js: Recognizes Express middleware patterns, async error handling, secure session management
This framework intelligence means findings are actionable from day one, no weeks of rule tuning or suppression file maintenance.
Automated Remediation: AI-Generated Fixes in PRs
The gap between detecting issues and fixing them is where traditional tools lose developers. CodeAnt AI closes this loop by generating framework-specific fixes directly in pull requests:
Each fix includes:
Clear explanation of why the issue matters (vulnerability type, business impact)
Framework-specific remediation respecting your codebase patterns
Unified diff showing exactly what changes
One-click application, no context switching, no manual rewrites
Measurable impact: Teams using CodeAnt report 80% faster code reviews and 3x reduction in mean time to remediation (MTTR) compared to detection-only tools.
Unified Code Health Across SAST, SCA, Secrets, and Quality
Rather than juggling separate tools for security scanning, dependency analysis, secrets detection, and code quality, each with its own dashboard and alert stream, AI-powered platforms consolidate these capabilities:
Capability | Traditional Approach | AI-Powered (CodeAnt) |
Coverage | Separate tools (SonarQube, Snyk, GitGuardian) | Unified SAST + SCA + secrets + quality |
False Positives | 40-60% | <15% (60% reduction) |
Setup Time | 2-4 weeks | 10 minutes (Marketplace install) |
Remediation | Manual developer effort | AI-generated, one-click fixes |
Azure DevOps Integration | Generic CI/CD plugins | Native PR decoration, work item linking |
This consolidation eliminates tool sprawl while providing engineering leaders a single view of code health, technical debt trends, and security posture across the entire organization.
Making It Work: Configuration and Scale
Choosing the right static analysis approach for your Azure DevOps organization requires matching technical capabilities to your scale, compliance requirements, and developer workflow.
Decision Framework
Language and framework coverage: Verify the tool deeply understands your stack (not just parses it). If you're running .NET Core microservices, React frontends, and Python data pipelines, generic pattern matching won't cut it. You need a semantic understanding of framework protections and idioms.
Repository scale and performance: Will analysis add 2 minutes or 20 minutes to your pipeline? For organizations with 500+ repositories and 50+ daily deployments, this compounds. Self-hosted tools require dedicated infrastructure and capacity planning. Cloud-native platforms like CodeAnt scale automatically with your workload.
Compliance requirements: Regulatory mandates often dictate deployment model. Verify your chosen tool provides audit trails, policy enforcement, and standards coverage (OWASP, CWE, PCI DSS, SOC 2) that satisfy your compliance framework.
Developer experience: The best tool is the one developers actually use. Evaluate PR decoration quality, remediation support, and noise level. If the false positive rate exceeds 30%, developers will ignore alerts, regardless of how comprehensive the scanning is.
Total cost of ownership: Look beyond licensing to infrastructure, administration, and opportunity cost. Self-hosted SonarQube typically costs $80K-120K annually for a 200-developer org (licensing + infrastructure + 0.5 FTE admin). Cloud-native platforms eliminate infrastructure and admin overhead with transparent per-developer pricing.
Staged Rollout for 100+ Developer Organizations
Phase 1: Pilot (Weeks 1-4)
Select 2-3 high-impact repositories with known quality issues
Configure baseline security checks (OWASP Top 10, secrets detection)
Measure current review time, vulnerability MTTR, false positive rate
Daily check-ins with pilot team to address friction
Phase 2: Expand (Weeks 5-8)
Scale to 15-20 repositories covering business-critical services
Refine policies based on pilot learnings, promote high-confidence findings to blocking
Enable automated remediation for one-click fixes
Integrate with branch policies on main/production branches
Phase 3: Organization-Wide (Weeks 9-16)
Extend to all repositories with standardized policy templates
Define baseline rules for all teams plus specialized policies for API services, infrastructure code
Automate onboarding using Azure DevOps APIs
Establish governance with monthly reviews of false positive trends and productivity metrics
Measuring Success: Metrics That Matter
Track these metrics to prove ROI and guide iteration:
False positive rate: Target <15%. Calculate as
(False Positives / Total Findings) × 100. Sample flagged issues weekly to determine accuracy. If you're exceeding 30%, your tool generates too much noise.PR cycle time: Measure time from PR creation to merge. CodeAnt customers report 75% reduction in review time because AI handles routine checks while humans focus on architecture and business logic.
Mean time to remediation (MTTR): How quickly teams close vulnerabilities. Traditional tools average 7-14 days (research + fix + test). AI-powered platforms with automated fixes average 1-3 days.
Percentage of PRs with findings: If 90% of PRs trigger alerts, you've misconfigured severity thresholds. Aim for 20-35% flagged with actionable issues—enough to catch problems without creating alert fatigue.
Escaped defects: Measure
(Bugs Caught by Analysis Type / Total Production Bugs) × 100. If your pipeline scans only catch 30% of eventual production issues, you're missing coverage or your tool can't detect logic-level flaws.Developer adoption: Track PR engagement with analysis comments. Low adoption signals the tool creates more friction than value, time to reevaluate.
CodeAnt's analytics dashboard tracks these automatically, eliminating manual metric collection and providing trendlines across your entire Azure DevOps organization.
Troubleshooting Common Issues
Pipeline Performance Degradation
Symptom: Analysis that initially ran in 2-3 minutes now takes 15+ minutes, blocking PR merges.
Fixes:
Configure incremental analysis to scan only changed files
Cache dependencies (
node_modules,.m2,packages)Use dedicated analysis agents or Azure-hosted agents with sufficient capacity
Consider AI-powered platforms like CodeAnt that complete analysis in under 2 minutes even for 500K+ LOC
Missing PR Annotations
Symptom: Analysis runs successfully but findings don't appear as PR comments.
Fixes:
Enable "Status check" in branch policies (Repos → Branches → Branch Policies)
Grant build service "Contribute to pull requests" permission
Verify tool-specific decoration plugins are installed and match Azure DevOps version
Check task logs for HTTP 403/429 errors indicating permission or rate limit issues
Inconsistent Results Between Agents
Symptom: Same commit produces different findings depending on which agent runs the job.
Fixes:
Pin tool versions in pipeline YAML to prevent version drift
Standardize environment variables (
JAVA_HOME,PATH) using pipeline variablesUse Azure-hosted agents with identical images or containerize analysis with Docker
Monorepo Path Filtering
Symptom: Changes to one service trigger full analysis of all services.
Fixes:
Use path filters in trigger configuration to scope analysis
Leverage tools that understand dependency graphs and scan only affected components
Consider matrix strategy with parallel jobs per service
Baseline Noise During Onboarding
Symptom: First scan produces 10,000+ findings, overwhelming the team.
Fixes:
Configure baseline scan that marks existing issues as accepted technical debt
Start with security-focused profiles (OWASP, CWE Top 25), expand gradually
Focus on critical/high issues first, defer low-priority findings
Use CodeAnt's automatic prioritization based on exploitability and business context
Conclusion: Build a Low-Noise, High-Signal Analysis Loop
Static code analysis in Azure DevOps succeeds when it accelerates rather than blocks developer velocity. The mechanics are straightforward, integrate at PR validation, enforce quality gates on critical issues, measure outcomes, but the results depend entirely on whether your tooling understands context or just applies rules blindly.
Key takeaways:
Traditional rule-based engines generate 40-60% false positives, training developers to ignore all findings
AI-powered platforms like CodeAnt reduce noise by 60% through semantic understanding of framework patterns and business logic
Start with soft gates in pilot repositories, prove value through faster reviews and caught vulnerabilities, then expand enforcement
Track false positive rate, PR cycle time, MTTR, and developer adoption to measure actual impact
Your next steps:
Install analysis at PR validation stage where feedback is most valuable
Set quality gates for critical vulnerabilities only, not every rule violation
Measure signal vs. noise weekly. If your team ignores alerts, your tool is failing
Iterate based on real outcomes: adjust policies, refine rules, prioritize fixes that reduce production incidents
Ready to see low-noise, high-signal analysis in your Azure DevOps environment? Start your 14-day free trial to evaluate CodeAnt's AI-powered platform, or book a 1:1 with our experts to see PR decoration and automated remediation workflows live.
FAQs
How do I prevent static analysis from blocking legitimate PRs with false positives?
What's the difference between AST-based analysis and AI-powered code review?
Should I run static analysis on every commit or just PRs?
How do I measure if static analysis is actually improving code quality?
Can static analysis tools understand custom frameworks or internal libraries?


