AI Code Review
18 Best Code & Test Coverage Tools for Dev Teams in 2026

Sonali Sood

Founding GTM, CodeAnt AI
You've probably seen the number: 82% test coverage.
And thought, Nice. We're covered.
But here's the thing, high coverage doesn't always mean high confidence.
You could be hitting a bunch of lines with zero meaningful assertions. Or worse, missing critical paths entirely while your report still looks green.
So, how do you actually use code coverage tools the right way?
It starts with picking the right tool, one that fits your stack, your team's workflow, and the level of visibility you really need.
Whether you're a solo dev trying to keep your JS test suite honest or a fast-moving team looking to ship safely across languages and CI/CD pipelines, coverage tooling should help you catch risk, not just color bars green.
This guide breaks down the best code/test coverage tools across 5 real-world categories:
AI-First code review & coverage tools
General-purpose, polyglot coverage tools
Language-specific coverage tools
CI/CD & dev feedback integrations
Full-stack insights & SCA platforms
Each tool is explained with one goal: helping you figure out what actually works, not just what's popular.
Let's dive in.
Code & Test Coverage Tools (Read This Before the Deep Dive)
Before we jump into the tool-by-tool breakdowns, use this table to map tools to your stack, PR workflow, and CI/CD, so you catch untested risk paths instead of just painting bars green. Skim the picks, spot the trade-offs, then dive into the detailed reviews that follow.
How to use this table:
Match by Best For to your team’s reality (solo, polyglot, enterprise).
Check Pick it if… for the clearest fit signal.
Scan Watch out for… to avoid surprises in setup or scale.
Note Pricing to shortlist what you can trial today.
Tool | Best For | Pick it if… | Watch out for… | Pricing |
CodeAnt AI | Scaling teams needing AI + coverage | You want AI review + coverage insights in one place | Limited on-prem options | Free trial, Paid from $10/user/mo |
Qodo AI | Devs using AI agents in IDE | You want test gen + doc-aware context | Higher-tier plans unlock most features | Free plan, Paid from $30/user/mo |
Snyk Code | Security-driven engineering teams | You need instant vulnerability + coverage detection | Can feel heavy in large repos | Free plan, Paid from $25/user/mo |
Codecov | Polyglot coverage in CI/CD | You want simple coverage reports in PRs | Basic dashboard without AI insights | Free plan, Paid from $10/user/mo |
Coveralls | Open-source & small teams | You need free public repo coverage | Limited analytics vs modern tools | Free for OSS, Paid from $12/user/mo |
Jacoco | Java projects | You want lightweight JVM coverage | Lacks GUI, setup-heavy | Free (Open-source) |
Cobertura | Legacy Java teams | You need XML/HTML reports fast | Not actively maintained | Free (Open-source) |
Istanbul (nyc) | Node.js projects | You need robust JS/TS coverage | Some overhead in large repos | Free (Open-source) |
Jest Coverage | Frontend & React apps | You use Jest already for testing | Basic vs full coverage suites | Free (Open-source) |
Mocha + NYC | Flexible JS teams | You want custom test runner + coverage | More config than Jest | Free (Open-source) |
JUnit + Jacoco | Java enterprise | You’re running CI/CD pipelines with JUnit | No cross-language support | Free (Open-source) |
Pytest + Coverage.py | Python teams | You want detailed branch/line coverage | Reports need extra plugins | Free (Open-source) |
Nose2 + Coverage.py | Legacy Python projects | Migrating from Nose, still need coverage | Limited compared to Pytest | Free (Open-source) |
Go Coverage | Go developers | You want native go test coverage | Basic HTML output | Free (built-in) |
dotCover (JetBrains) | .NET teams | You’re already using Rider/ReSharper | Paid-only, JetBrains lock-in | Paid from $249/year |
OpenCover | .NET OSS teams | You need open-source coverage | Windows-only, CLI-heavy | Free (Open-source) |
Kover (JetBrains) | Kotlin projects | Integrated into IntelliJ ecosystem | Early-stage vs Jacoco | Free (with IntelliJ) |
SonarQube Coverage | Enterprises | You want coverage + quality gates in one | Setup overhead, heavy infra | Free (Community), Paid Enterprise |
The table above gives you a “fit check” at a glance. In the sections that follow, we go deeper on each tool, what it does best, where it falls short, and when it’s worth adopting. Use the quick blurbs under each heading as a speed-read before diving into pros/cons.
AI-First Code Review & Coverage
1. CodeAnt.ai
CodeAnt AI is like having an extra pair of eyes on every pull request, only faster and never tired. It automatically reviews your code, flags issues (from security risks to sloppy patterns), and even suggests one-click fixes right inside your PR. No jumping tabs, no setup drama.

CodeAnt AI Pros:
Hooks into GitHub, GitLab, Bitbucket, and Azure DevOps in two clicks, self-hosted or cloud, doesn't matter.
Gives targeted, line-level feedback and lets you fix things instantly.
Knows what it's reading; it parses your whole codebase using ASTs, not just surface-level checks.
Comes ready with SOC 2 and HIPAA compliance if your team's serious about security.
Runs inside VS Code, JetBrains, your CI/CD... wherever you live.
Works with:
Any language, any repo host, any IDE, any pipeline. It's meant to fit into whatever setup you already have.
Best for:
Teams trying to pull in quality without scaling headcount. Also great if you're trying to scale requests, especially if you're working with AI-generated code or need airtight security practices.
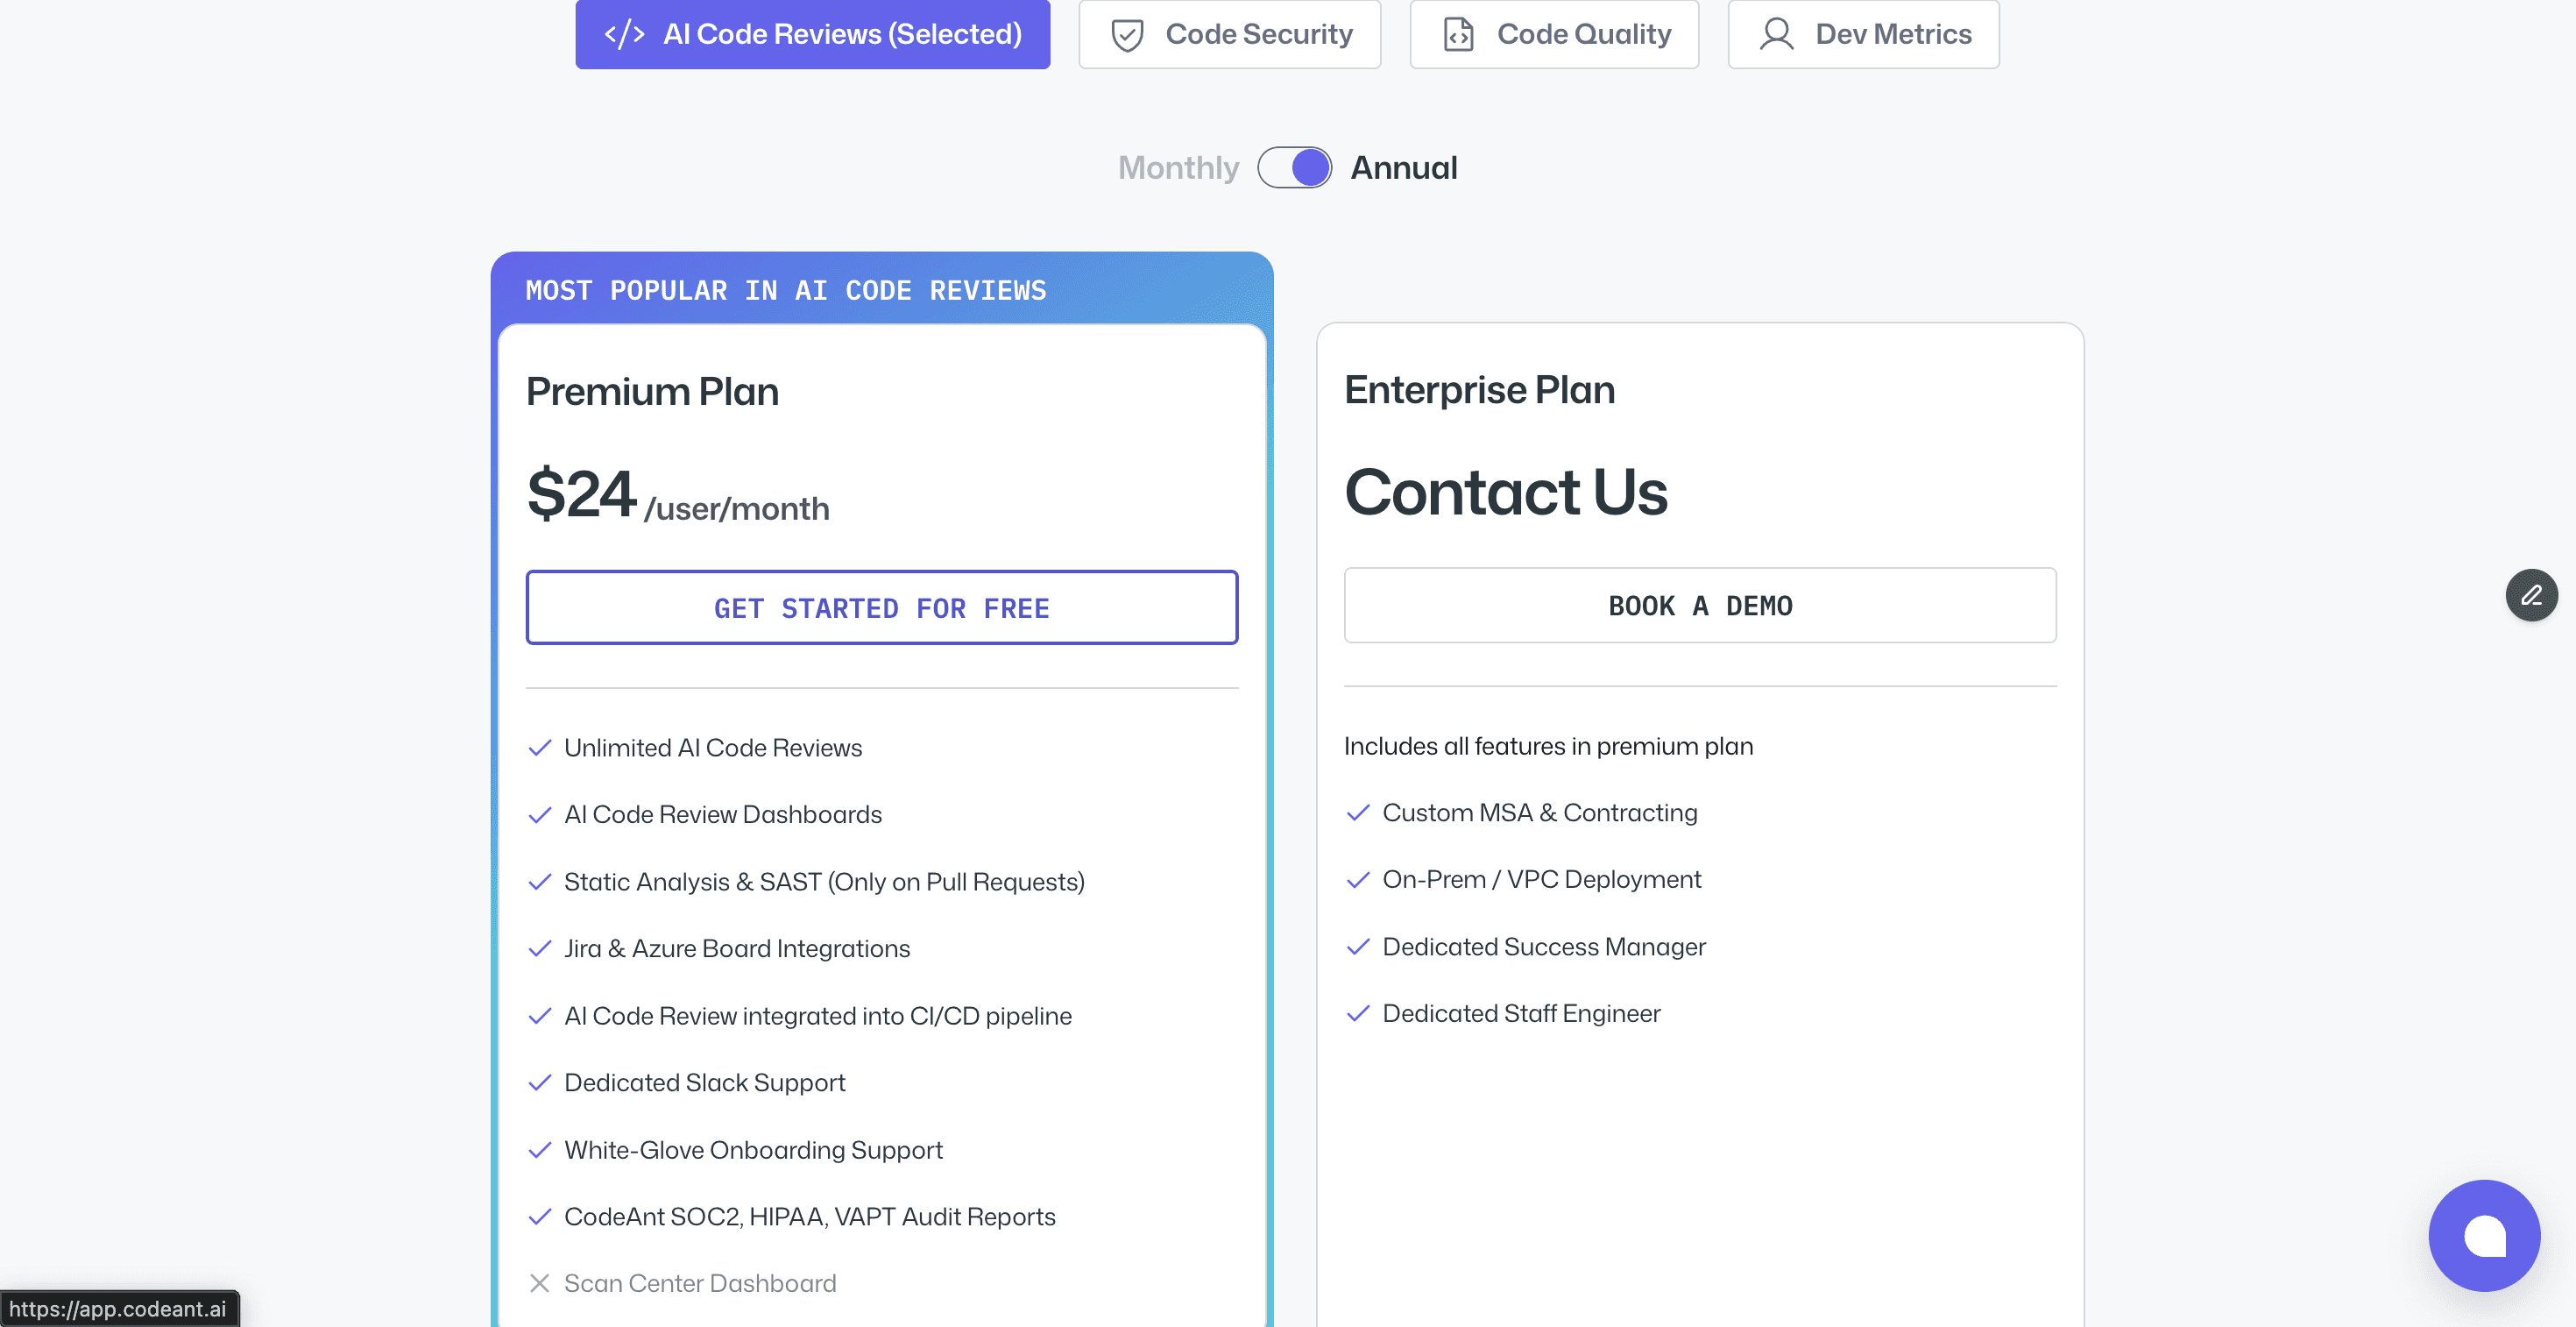
Pricing:
14-day free trial, no credit card required.
After that, AI Code Reviews: $10/user/month [Basic Plan], Premium Plan starting from $20/user/month.
Code Quality: Starting from $150/10 devs/month.
Code Security: Starting from $150/10 devs/month.
2. Qodo AI (formerly Codium AI)
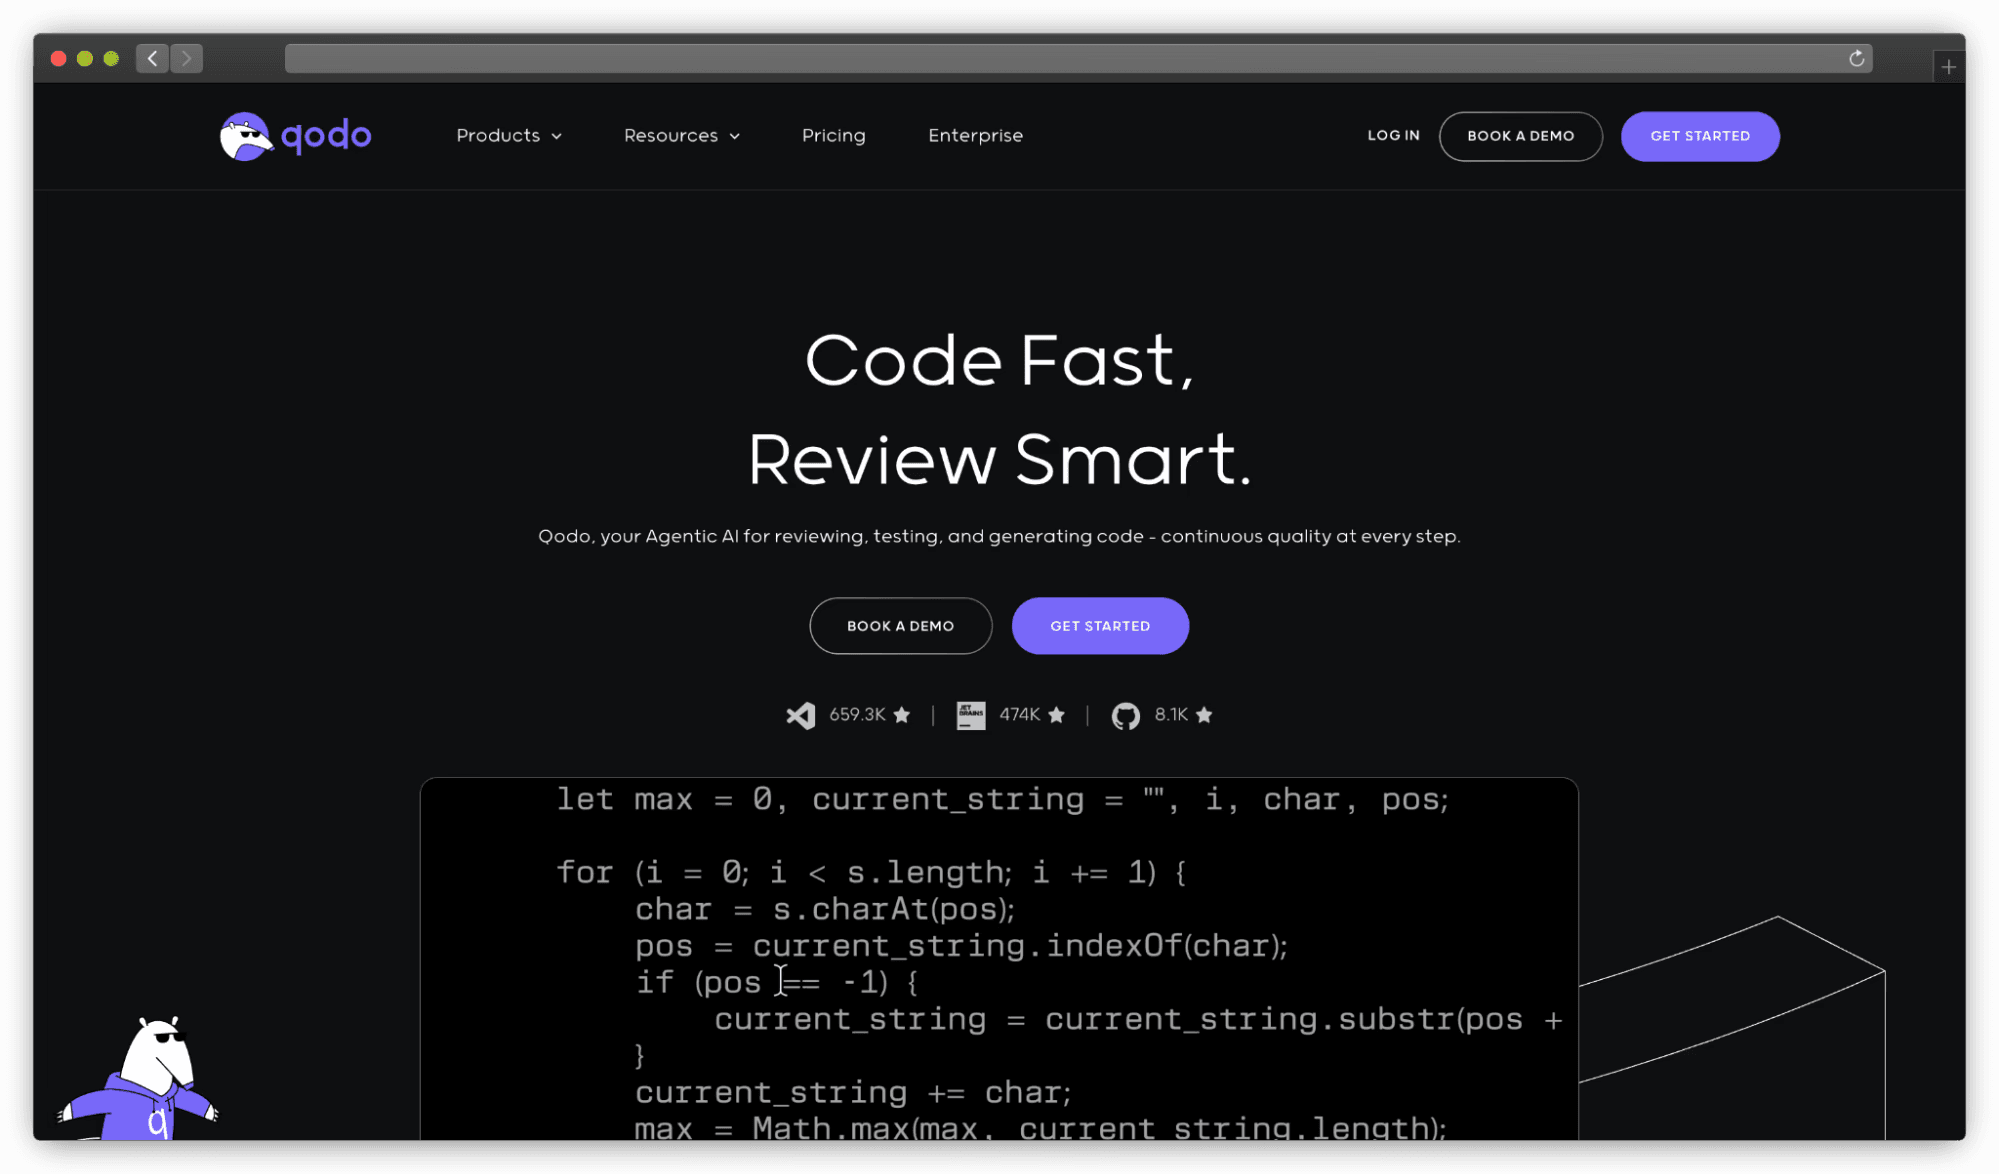
Qodo AI is like your AI co-pilot for writing, testing, and reviewing code, with an awareness of how your project works. It doesn't just generate boilerplate. It understands your codebase, applies your team's best practices, and helps create high-quality tests that actually reflect real-world behavior.
Pros:
Understands context deeply using RAG (Retrieval Augmented Generation), so its suggestions stay relevant.
Builds out comprehensive test suites, from happy paths to weird edge cases.
Works directly in your IDE with interactive commands like /test, /explain, /enhance, etc.
Supports AI agents that can take action on your prompts, from code generation to auto-fixes.
Lets you connect your own data sources and tools to improve how the agent works.
Fully integrated with GitHub, GitLab, Bitbucket, Azure, and project tools like Jira, Slack, and Linear.
Enterprise plan allows repo-wide AI with full context access.
Cons:
Getting the most out of agentic and deep custom rules has a learning curve.
Like all AI tools, it can occasionally produce off-mark suggestions.
Advanced features require solid team buy-in to work smoothly.
Works with:
VS Code, JetBrains IDEs, GitHub, GitLab, Bitbucket, Azure DevOps, Jira, Slack, Asana, Trello, ClickUp.
Best for:
Teams that want to use AI baked into your dev flow, and not just occasionally. If you're building fast, working with complex codebases, or want smart help writing, testing, a strong pick.
Pricing:
Free Developer Plan (250 messages/month, community support)
Teams: $30/user/month (annual) or $38/month (monthly)
Enterprise: $45/user/month with advanced dashboarding, SSO, and on-prem/self-hosted deployment options.

3. Snyk Code
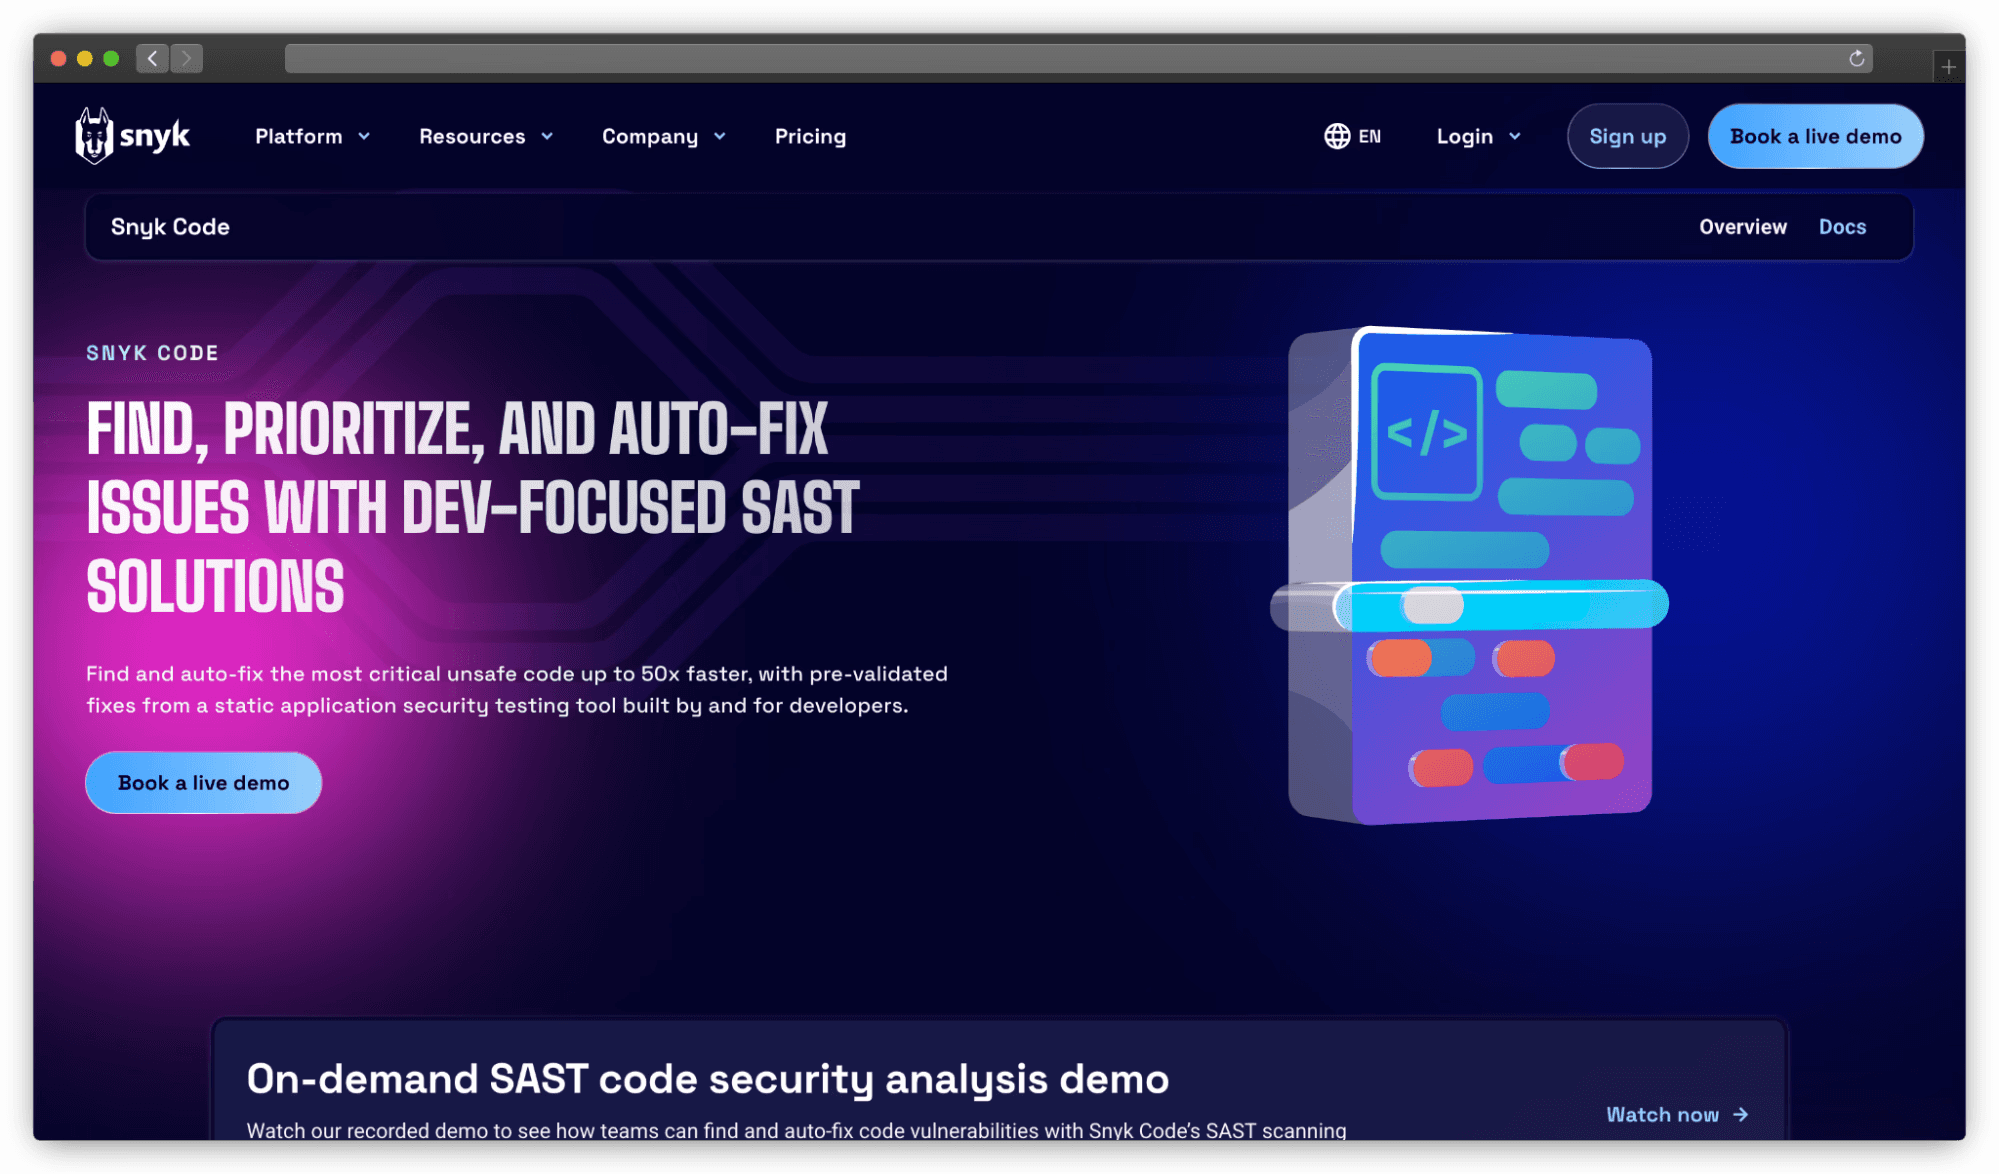
Snyk Code (powered by DeepCode AI) is built for developers who want security checks to just happen, without breaking their flow. It scans your code while you're working, flags risks instantly, and even auto-fixes the easy stuff.
Pros:
Real-time feedback in your IDE, no waiting for builds.
Focuses on high-risk, high-priority issues by using deep code context.
A hybrid AI + human-in-the-loop engine helps cut down on false positives.
Built on a massive data set: 25 M+ code flows + curated open-source knowledge.
Self-hosted option available, with constraint-based analysis for speed and accuracy.
Integrates directly into pull requests and CI pipelines as a quality/security gate.
Cons:
A deep feature set might take some time to fully configure.
Integrating across large custom CI setups can take work.
Pricing details aren't public for Team and Enterprise plans.
Works with:
Over 14 languages and frameworks, GitHub, Bitbucket, major IDEs (JetBrains, VS Code), CircleCI, Jenkins, GitHub Actions, Azure Pipelines, Jira.
Best for:
Security-conscious dev teams that want vulnerabilities caught early, in the editor, not in production. Especially useful for teams writing or reviewing AI-generated code.
Pricing:
Free: 100 scans/month + real-time IDE feedback
Team: $25/month.
Enterprise: Custom pricing, includes advanced auto-fix capabilities in IDEs.
General-Purpose, Polyglot Coverage
4. Codecov
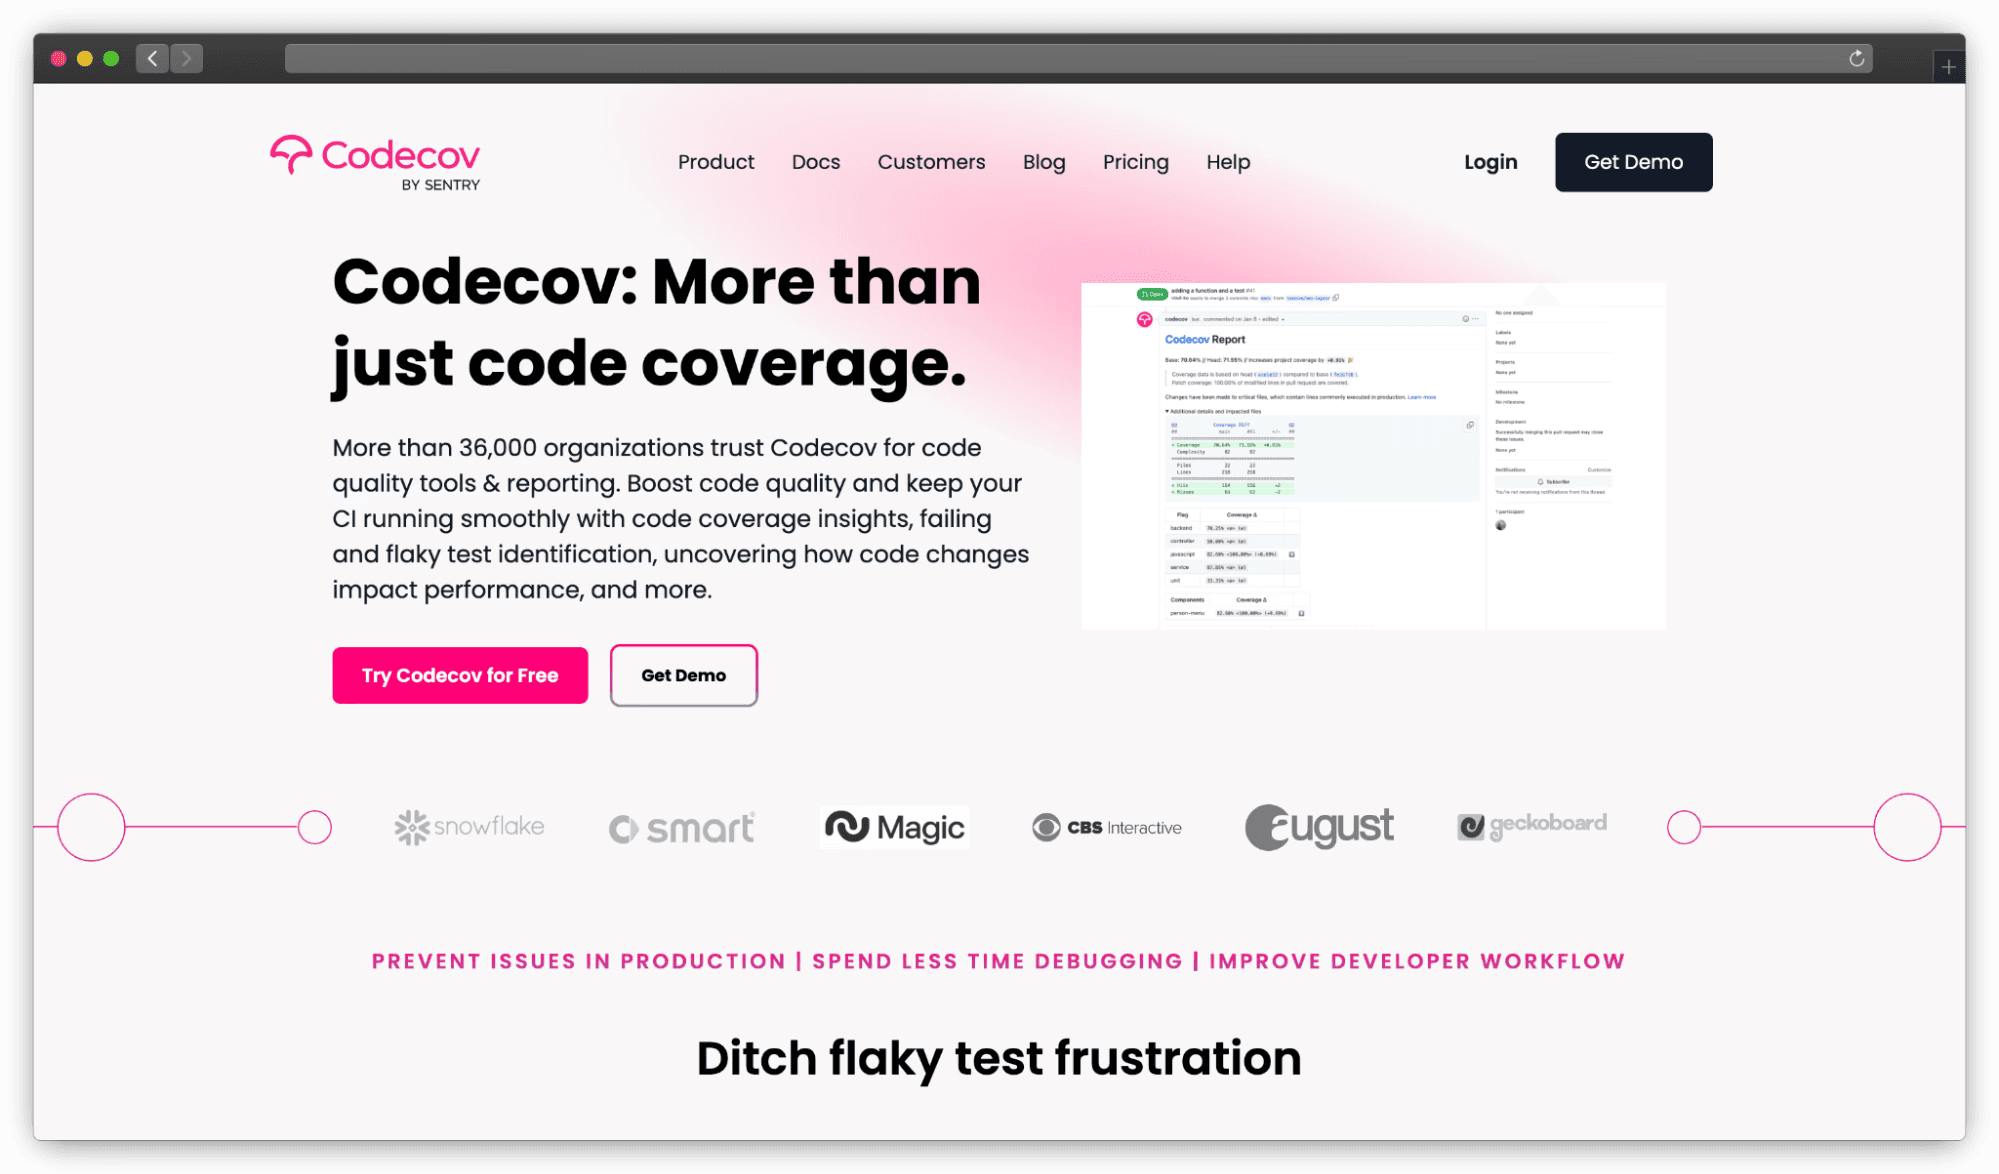
Codecov helps teams understand what their tests are actually covering, and more importantly, what they're not. It works across stacks, languages, and CI systems, giving you real-time PR feedback and long-term visibility into test suite health.
Pros:
Highlights exactly which lines failed which tests, no more guesswork.
Re-run flaky tests instantly using copy-pasteable names and stack traces.
PR comments show coverage deltas, so you can spot risky merges fast.
Customize what coverage matters, like set bundles for diff %, file changes, etc.
JS teams get bonus features like bundle size tracking and drift detection.
Supports nearly every language, CI tool, and repo host.
Cons:
The depth of configuration might be a lot for first-time users.
Advanced features like carryforward flags and flaky test detection are gated behind paid tiers.
Works with:
Languages like Python, JS, Go, C++, Kotlin, Swift, etc. CI platforms like GitHub Actions, GitLab CI, Jenkins, CircleCI, Bitrise. Repo hosts like GitHub, Bitbucket, and GitLab.
Best for:
Polyglot teams that want to use coverage as a guardrail, not just a number. Also great for keeping long-term tabs on flaky tests or bloated bundles.
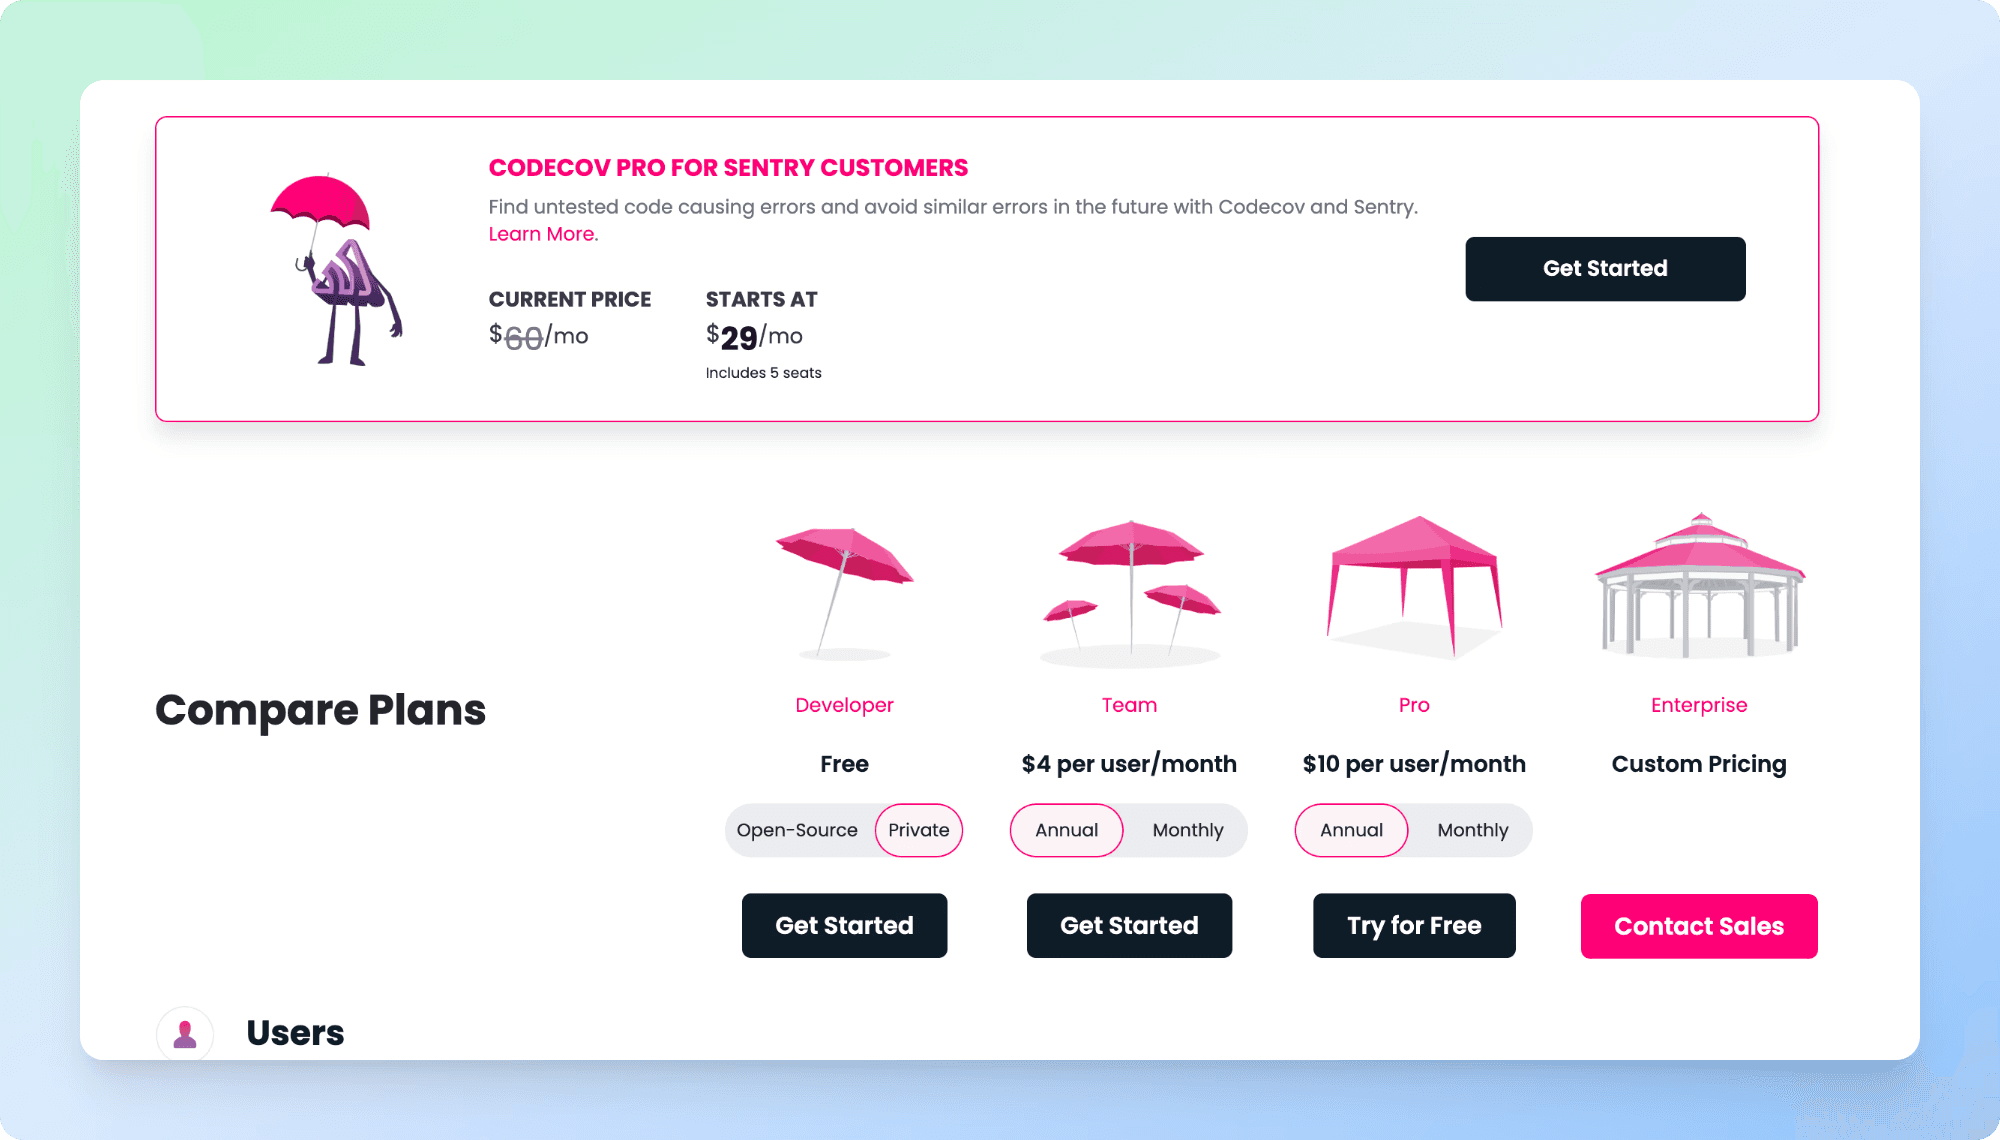
Pricing:
Free Developer Plan (public repos + 250 private uploads)
Team: $4/user/month (annual)
Pro: $10/user/month (annual)
Enterprise: Custom pricing, includes dedicated infrastructure, onboarding support, and SLAs.
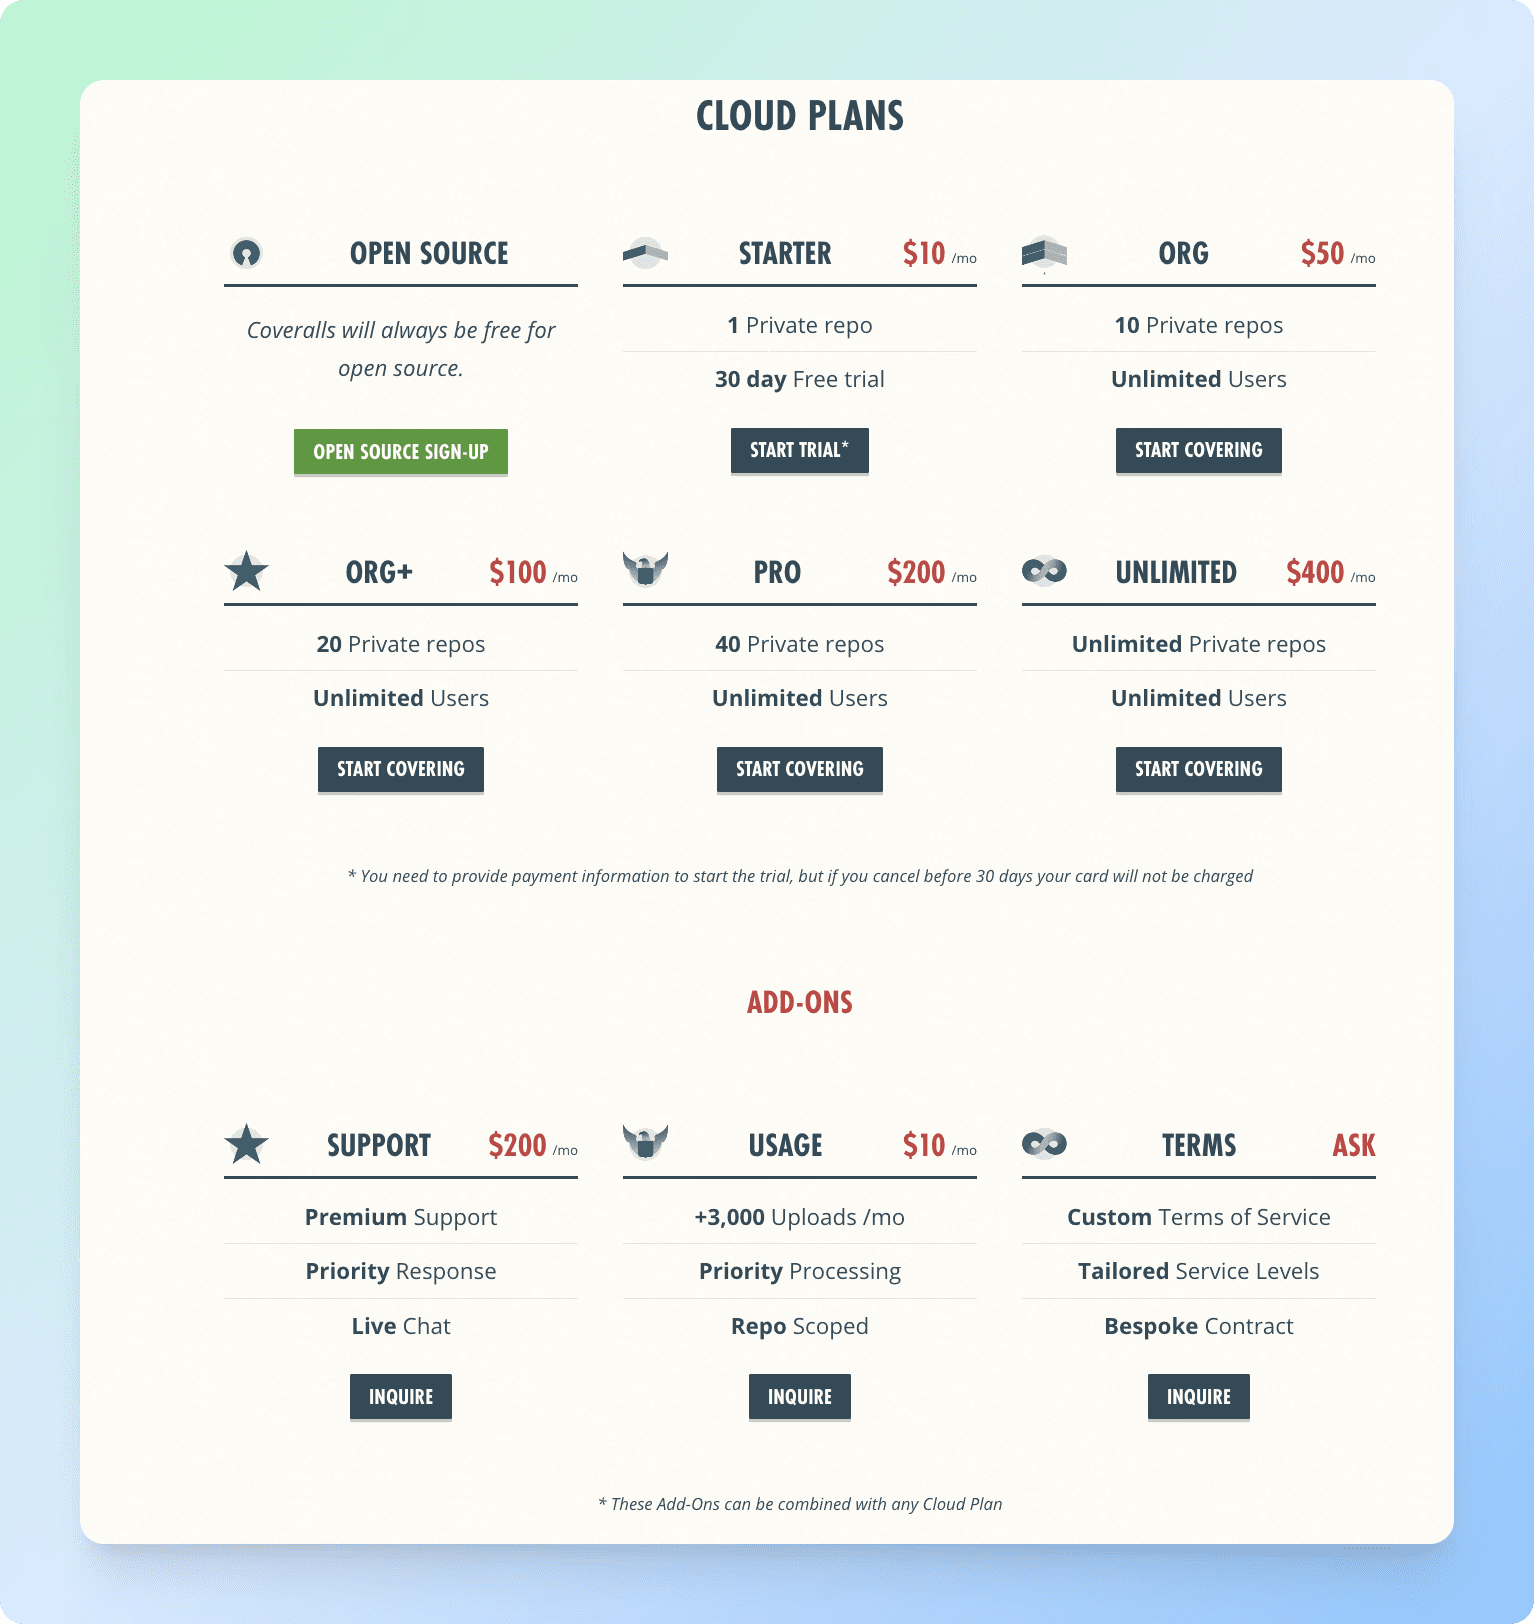
5. Coveralls
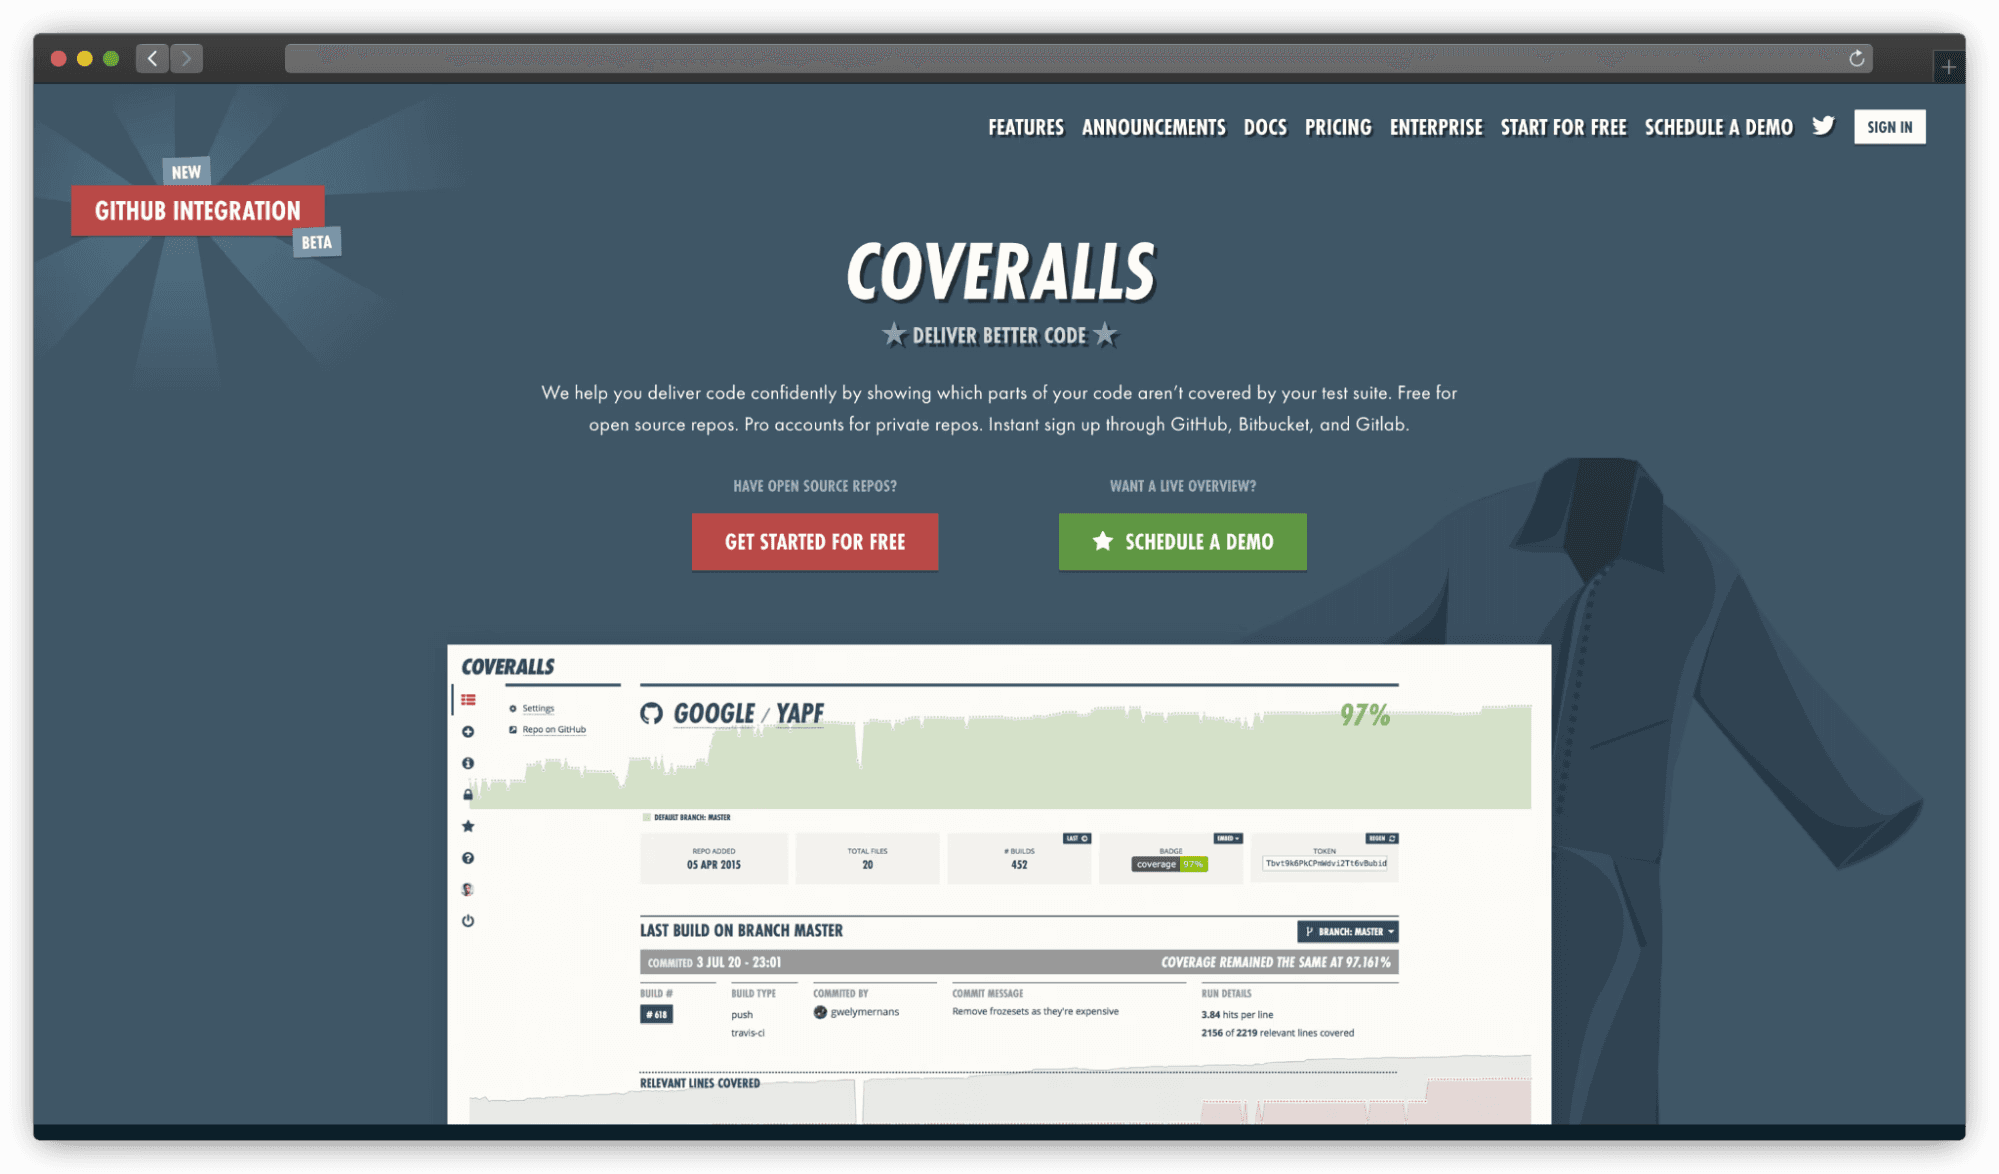
Coveralls tracks code coverage over time so you can make sure that every new commit is actually tested. It's a lightweight, web-based service that integrates into your CI flow and gives you an at-a-glance view of what's been covered, what hasn't, and how that's changing as your codebase evolves.
Pros:
Super simple to set up, just log in with GitHub, GitLab, or Bitbucket.
Tracks coverage on every CI build automatically.
Supports any language or CI system, thanks to universal reporters and community integrations.
Works with parallel builds, making it handy for large test suites split across multiple machines.
Offers a clean web UI for exploring coverage by build, file, or even subproject.
The new "Universal Coverage Reporter" simplifies integration across mixed-language projects.
Cons:
Still maturing in some areas, the Universal Reporter is new, so expect updates.
Web-based service means you'll need reliable internet access.
Might not be ideal for extremely sensitive codebases unless you're self-hosted (Enterprise plan only).
Works with:
GitHub, GitLab, Bitbucket, GitHub Actions, CircleCI, LCOV reports from tools like pytest-cov.
Best for:
Teams that want a simple, no-fuss way to track and enforce test coverage across CI runs, especially if you're juggling a polyglot stack or contributing to open-source.
Pricing:
Free for public repos
Pro plans available for private repos, starting from $10/mo and going up to $200/mo.
Has unlimited plan too @ $400/mo.
Language-Specific Coverage
6. JaCoCo (Java)

JaCoCo is the go-to open-source tool for tracking code coverage in Java. It plugs into your build process and helps you see which parts of your application aren't being exercised by tests, and then you can build reports.
Pros:
Seamless integration with Maven, Gradle, Ant, and IntelliJ.
Offers deep coverage metrics: line, branch, and cyclomatic complexity.
Exports reports in HTML, XML, or PDF formats.
Minimal performance overhead, won't slow down your tests.
Pairs well with SonarQube for advanced quality dashboards.
Cons:
Java-only, won't help if your project includes other languages.
Setup can be tricky if you're not already using JUnit.
Doesn't support real-time reporting; coverage is written only after test completion.
The Report UI feels a bit dated and could use modernization.
Works with:
Maven, Gradle, Ant, Eclipse, IntelliJ, SonarQube.
Best for:
Java teams looking for a free, reliable way to measure test coverage, especially those already using traditional Java build tools or quality dashboards like SonarQube.
Pricing:
Free and open-source (Eclipse Public License).
7. Istanbul / NYC (JavaScript/TypeScript)
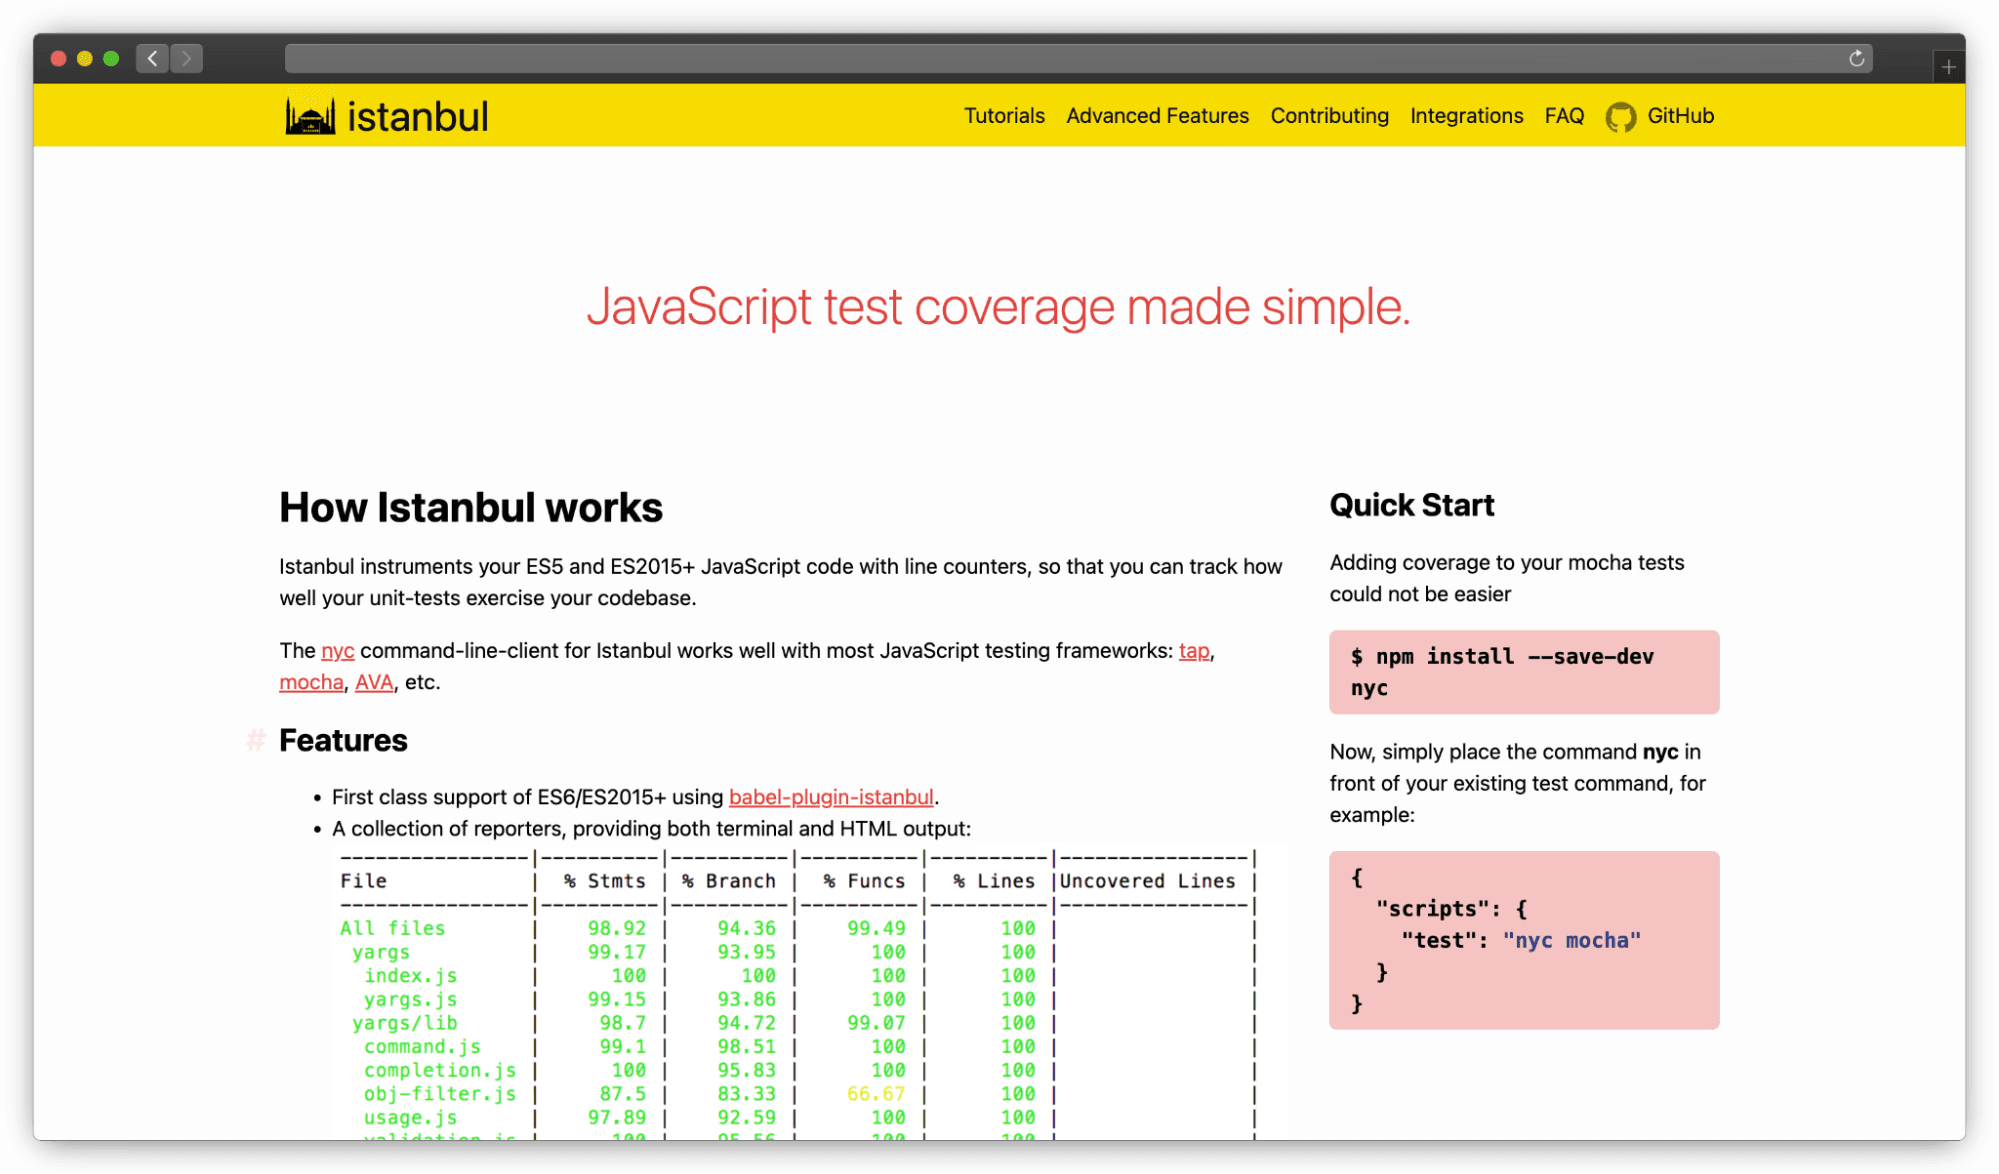
Istanbul (with its CLI tool nyc) gives JavaScript and TypeScript developers the tools to track how well their tests are covering the code. It's built to handle modern JS, including Babel and TypeScript, and makes it easy to generate readable, source-mapped reports that reflect your original code.
Pros:
Tracks line, statement, branch, and function coverage with high accuracy.
Supports source maps, so your reports show original, not the transpiled mess.
Works with major JS test frameworks like Mocha, Jest, AVA, or Tape.
Flexible output: text summaries, HTML reports, JSON, LCOV.
Easy to plug into CI, config lives in .nycrc or package.json.
Cons:
Some overlap with Jest's built-in Istanbul support, may feel redundant in simple setups.
Using it via npx can introduce unwanted version bumps if you're not careful.
Requires a bit of config wrangling to fully customize thresholds or ignores.
Works with:
Mocha, Jest, AVA, Tap, Babel, TypeScript, Coveralls, Codecov.
Best for:
JS/TS projects that need detailed, accurate test coverage with support for source maps and CI integration. Great fit for teams who like tight control over what counts as "covered."
Pricing:
Free and open-source (also available through Tidelift with commercial support).
8. Pytest-cov (Python)
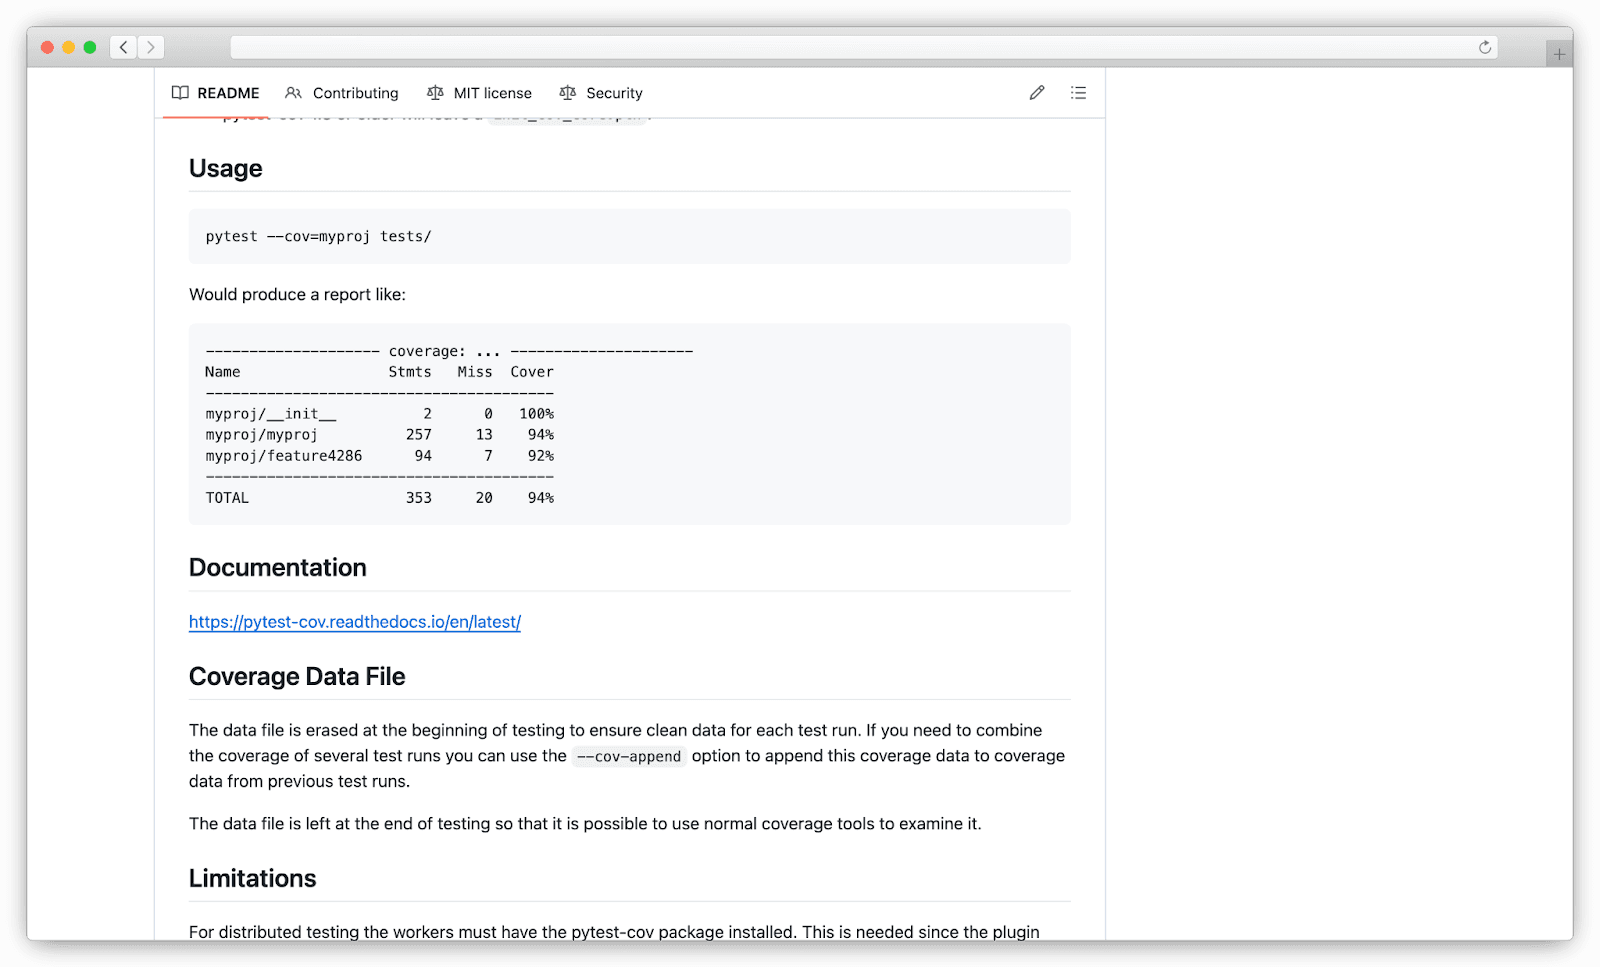
pytest-cov is a lightweight Python plugin that adds coverage tracking to your regular pytest runs. It's simple, fast, and integrates neatly with other common Python testing workflows.
Pros:
Works right out of the box with pytest, just add the plugin and go.
Let's you set fail conditions when coverage drops below a threshold.
Generates reports in multiple formats (terminal, HTML, XML, JSON, LCOV).
Supports combining coverage from parallel test runs (great for CI).
Easy to ignore files or branches that don't need to be tracked.
Cons:
Requires
coverage.pyas a dependency.CLI-first might feel a bit raw if you're looking for rich dashboards.
Needs some manual setup for complex test structures or packages.
Works with:
pytest, tox, Jenkins, GitHub Actions, Coveralls, Codecov.
Best for:
Python developers who want a quick, no-nonsense way to see what their tests are missing, especially in CI flows or tox environments.
Pricing:
Free and open-source (MIT license).
9. Go test cover (Go)
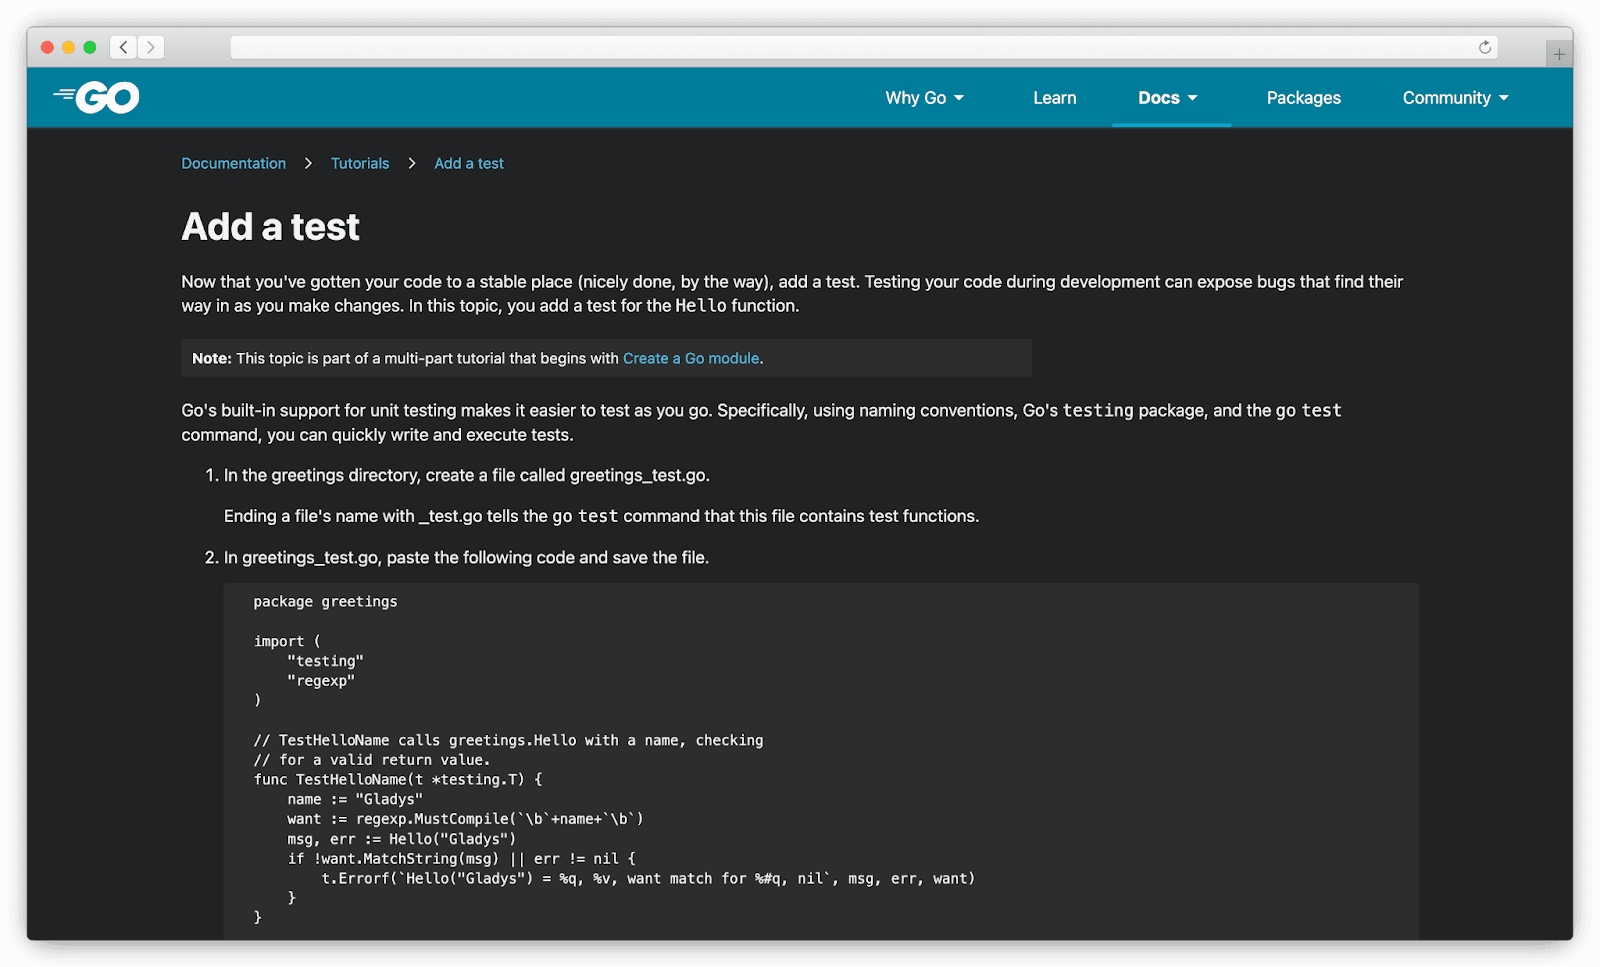
Go comes with coverage tools built into the language itself, no third-party installs needed. Just run go test -cover and you'll get an immediate sense of how much of your code is being exercised by tests.
Pros:
Built into the Go toolchain, no extra packages to install.
Easy to generate HTML reports using the
go tool cover -html.Integrates with GitHub Actions, Codecov, and other CI tools.
Supports statement-level coverage, no branch/path-level granularity.
Cons:
Only supports statement coverage, can merge multiple profiles.
You'll need to manage merging and flag setting manually in larger projects.
Less friendly UX compared to visual tools, reports are minimal unless post-processed.
Works with:
Standard Go tooling, GitHub Actions, Codecov, Coveralls.
Best for:
Go developers who prefer using native tools and want fast, CLI-based feedback on what their tests are covering.
Pricing:
Free and included in the Go toolchain.
10. Kover (Kotlin)
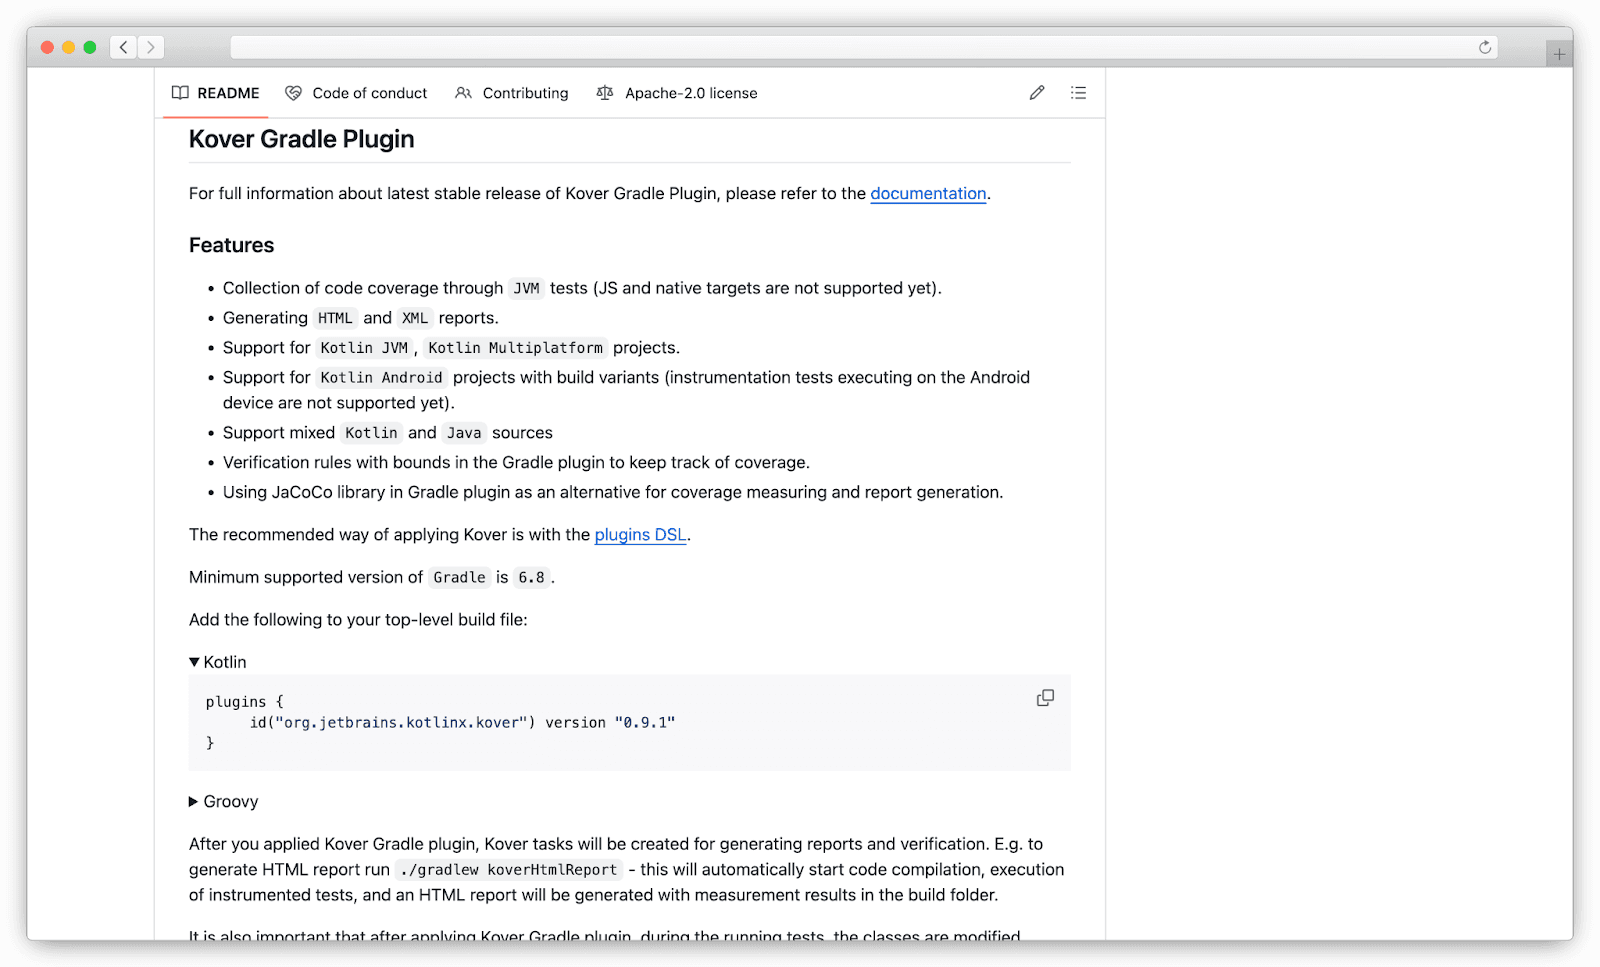
Kover is a Kotlin-native code coverage tool designed to replace JaCoCo for Kotlin-first projects. It integrates directly with Gradle and gives better support for modern Kotlin syntax and multiplatform builds.
Pros:
Made for Kotlin, no weird edge cases with inline functions or lambdas.
Built into Gradle with a clean, simple DSL for configuration.
Supports line, branch, and class coverage.
Handles Kotlin Multiplatform projects cleanly, shared and platform-specific code.
Cons:
Can use IntelliJ's coverage runner or run headlessly in CI.
Focused on Kotlin, not ideal for mixed Java/Kotlin projects.
Some features depend on using newer Gradle versions.
Works with:
Kotlin Multiplatform, IntelliJ, Android Studio, Gradle, GitHub Actions.
Best for:
Kotlin-only teams who want accurate, easy-to-read coverage data without relying on Java-oriented tools.
Pricing:
Free and open-source.
11. Coverlet (.NET)
Coverlet brings modern code coverage tracking to .NET Core and .NET Standard projects. It works with your existing test frameworks and produces reports in formats you can feed into tools like ReportGenerator or SonarQube.
Pros:
Integrates directly with dotnet test and works across .NET Core/.NET Standard.
Can output coverage in opencover, LCOV, Cobertura, and JSON formats.
Supports thresholds and exclusions via command-line or MSBuild.
Works seamlessly in CI environments (GitHub Actions, Azure Pipelines, etc.)
Cons:
Does not support older .NET Framework versions.
More configuration is needed for multi-project solutions.
No built-in HTML UI, needs a separate visualizer.
Works with:
dotnet CLI, NUnit, xUnit, MSTest, GitHub Actions, Azure Pipelines, ReportGenerator, SonarQube.
Best for:
.NET Core teams that need flexible, format-rich coverage reports and want to integrate with their CI tools or quality dashboards.
Pricing:
Free and open-source (part of .NET Foundation).
12. Bullseye Coverage (C/C++)
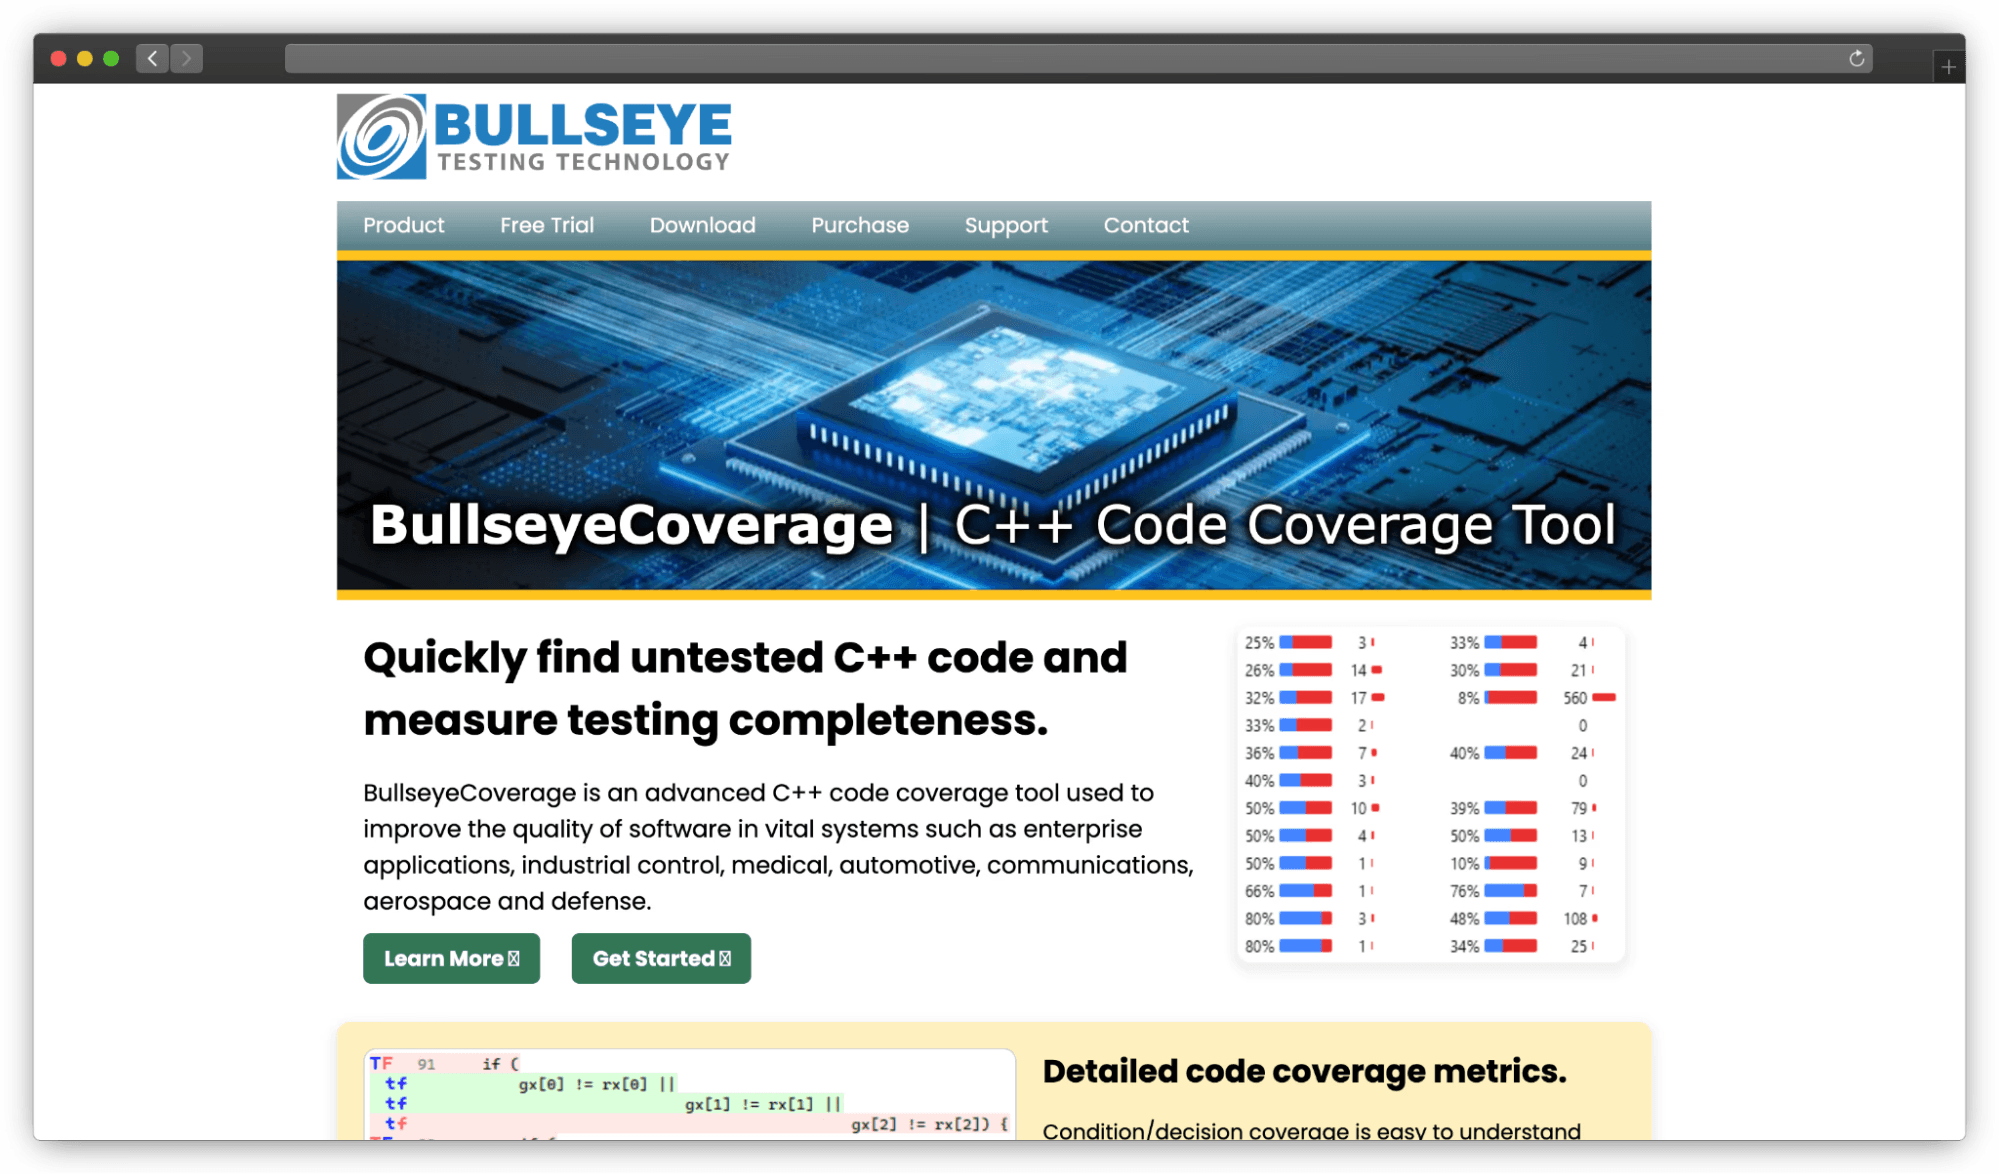
Bullseye Coverage is a commercial-grade code coverage tool built specifically for C and C++ projects. It's known for its precision and detailed reporting, and it integrates with a wide range of development environments and embedded systems.
Pros:
Handles complex C/C++ projects, including templates and inline functions.
Gives accurate branch/function, and statement coverage.
Plays well with IDEs like Visual Studio and Eclipse.
Built for portability, works on Windows, Linux, and even embedded platforms.
Minimal runtime overhead, so performance stays stable during coverage runs.
Includes HTML reports with jump-to-source navigation.
Cons:
Proprietary tool, comes with a license cost.
UI feels a bit dated compared to newer tools.
Needs manual configuration for larger or multi-toolchain projects.
Works with:
C/C++, Visual Studio, Eclipse, Windows, Linux, embedded platforms.
Best for:
C/C++ teams working on performance-sensitive or embedded applications who need reliable and detailed coverage, and are okay with using a paid tool.
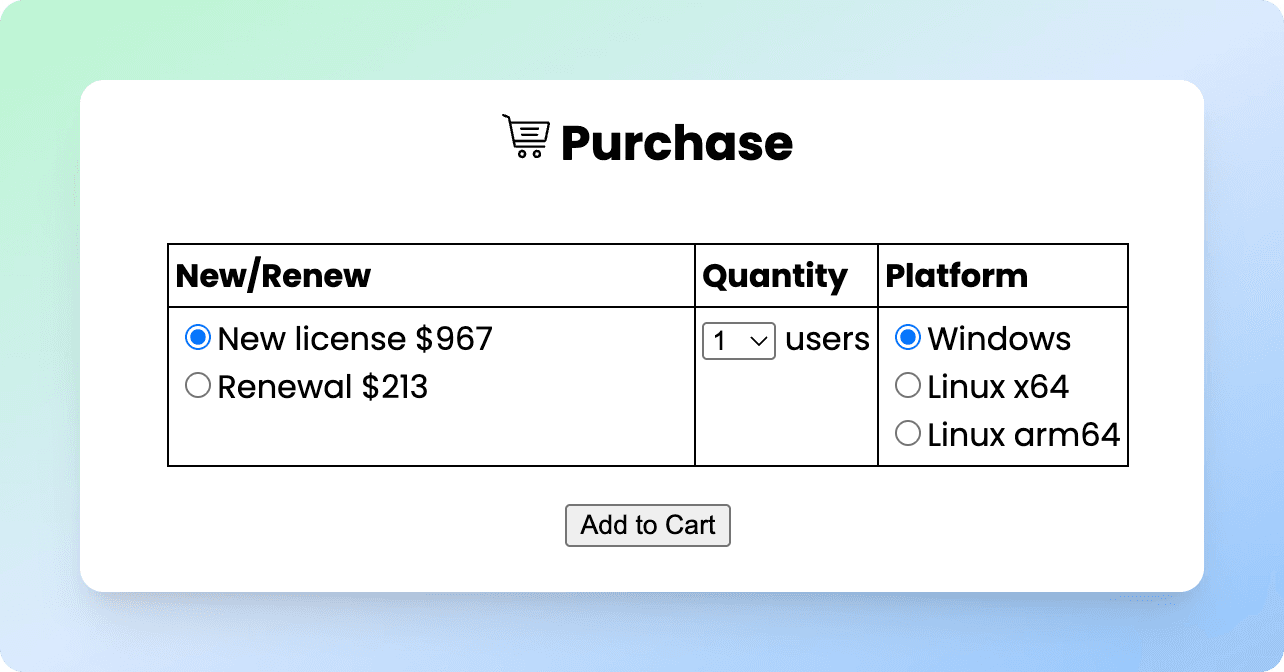
Pricing:
$967/license.
13. Coyote C++

Coyote is a newer C++ coverage tool designed to run fast and give clear insights. It's built from scratch with modern compilers and toolchains in mind and focuses on performance and simplicity.
Pros:
Clean command-line interface, easy to integrate into modern CI flows.
Fast runtime with low instrumentation overhead.
Generates LCOV and JSON output formats.
Good compatibility with compilers like GCC and Clang.
Can export reports to GitHub Actions or other pipelines.
Cons:
Still evolving, not as feature-rich as long-standing tools.
More geared toward modern C++ projects; legacy support might need extra work.
Limited visual UI, relies on external tools for full report viewing.
Works with:
Modern C++, toolchains, GitHub Actions, LCOV, JSON-based CI integrations.
Best for:
Lean teams or OSS projects looking for a fast, lightweight C++ coverage tool that just works without too much setup.
Pricing:
Free and open-source.
CI/CD & Dev Feedback Integrations
14. Testspace
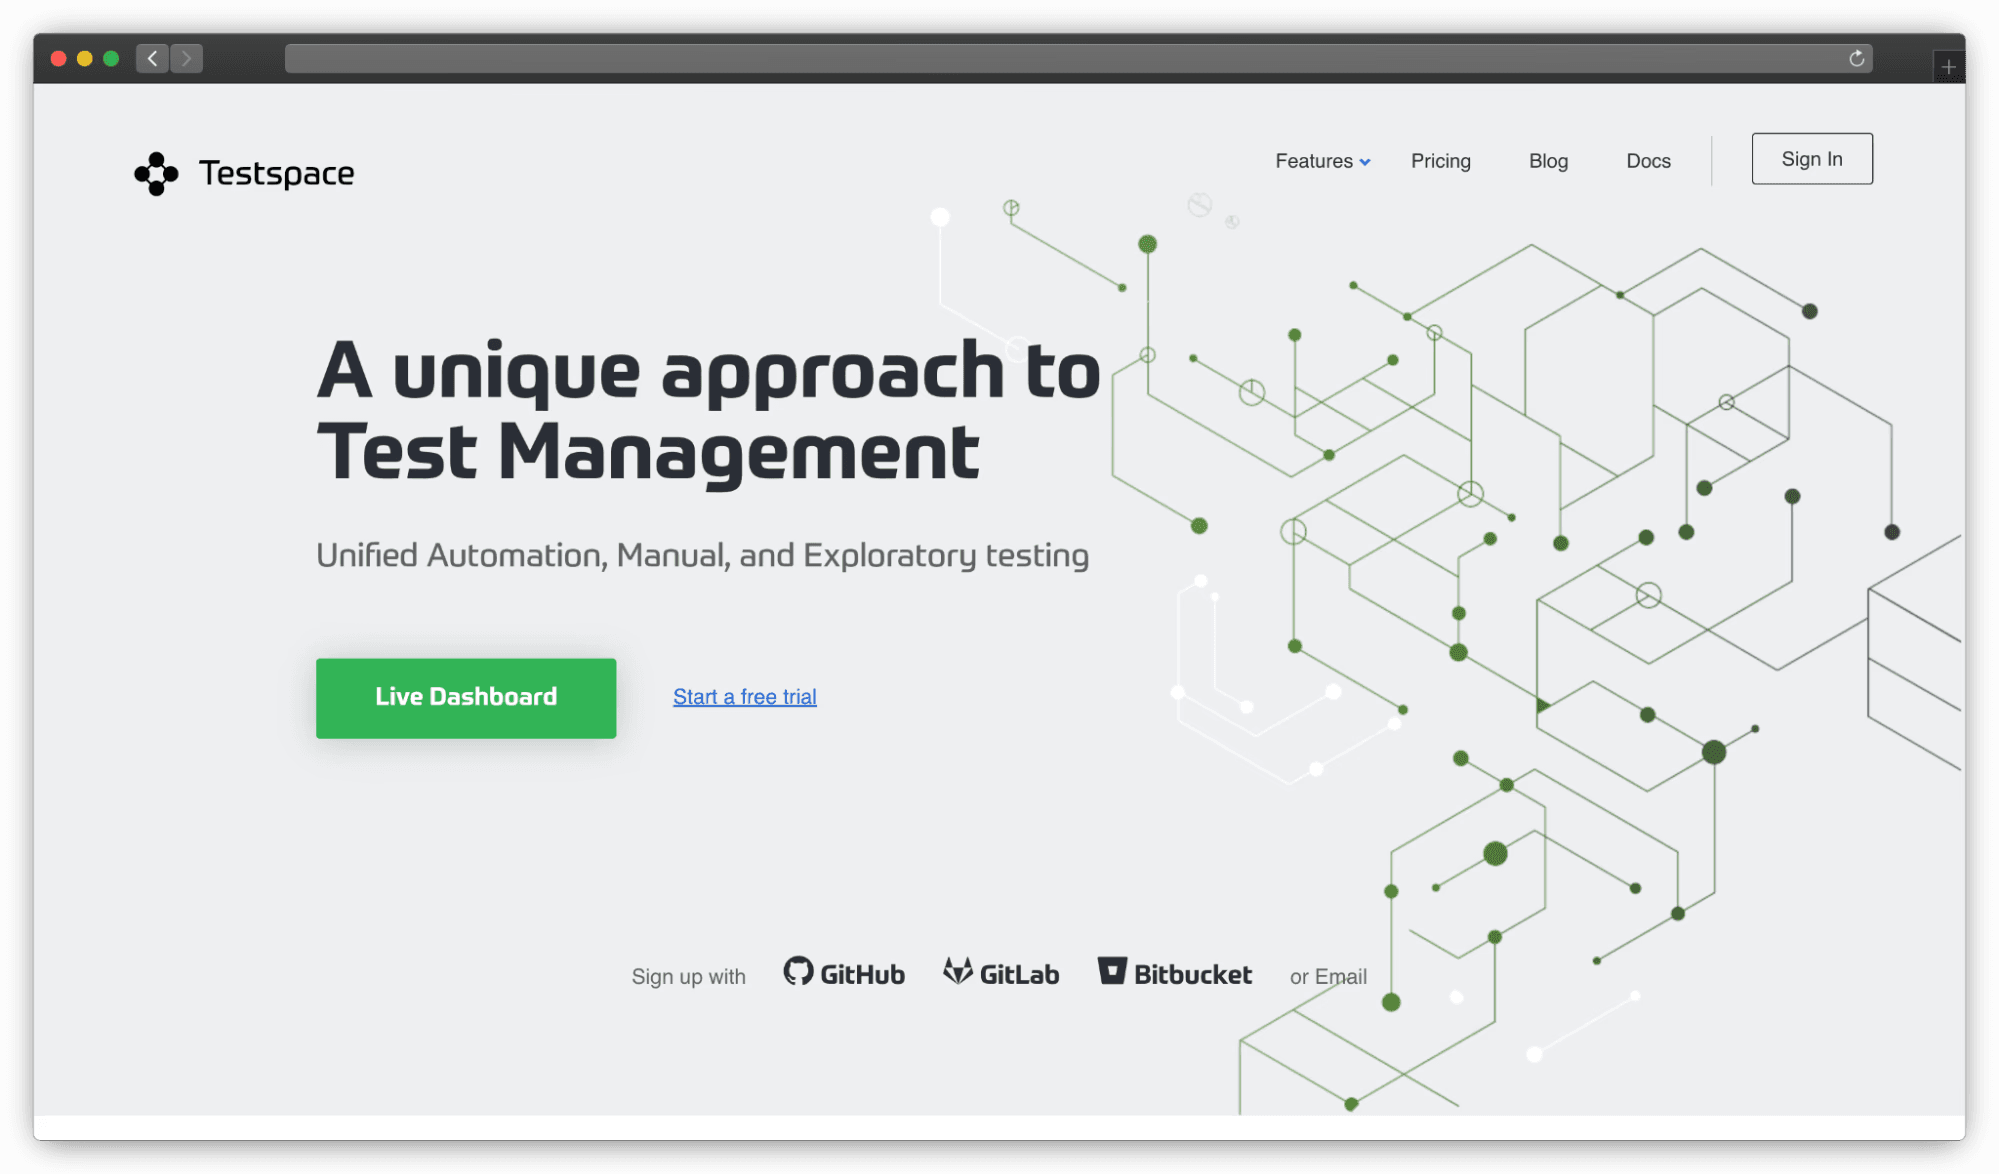
Testspace turns your raw test outputs, results, coverage, and even performance, into structured, visual dashboards. It acts like a wrapper on top of your existing test and CI setup, helping teams spot failures and trends faster.
Pros:
Aggregate test results, coverage, and static analysis into one dashboard.
Works with any language or framework by parsing standard output.
Adds context to failures with links and annotations.
Let's you track metrics over time, not just per-build.
Integrates directly with GitHub, GitLab, and Bitbucket.
Great for visualizing flaky tests or CI trends.
Cons:
Primarily web-based, local viewing, or offline use isn't a focus.
May need scripting for complex pipelines or workflows.
Works with:
Any language or framework, GitHub, GitLab, Bitbucket, Jenkins, Travis CI, CircleCI.
Best for:
Teams that want a single place to see test results, code coverage, and long-term quality trends, without switching tools.
Pricing:
Free for public projects. Personal(coming soon) and Enterprise plans are available(on request).
15. SonarQube
SonarQube goes beyond just coverage; it helps teams enforce code quality by combining test data with static analysis, code smells, and security vulnerabilities. It widely used in enterprise environments for its depth and flexibility.
Pros:
Analyzes code for bugs, vulnerabilities, duplication, and coverage gaps.
Supports over 25 programming languages.
Real-time integration with IDEs, PRs, and CI pipelines.
Clear quality gates and dashboards help enforce team-wide standards.
Self-hosted and cloud options are available.
Cons:
It can be heavy to configure for large monorepos or polyglot setups.
Best results come when paired with compatible test reporters.
UI can feel complex until you get used to it.
Works with:
GitHub, GitLab, Bitbucket, Jenkins, Azure DevOps, over 25 languages.
Best for:
Mid-to-large-teams who want visibility into both coverage and code quality, and who want consistent rules enforced across repos and teams.
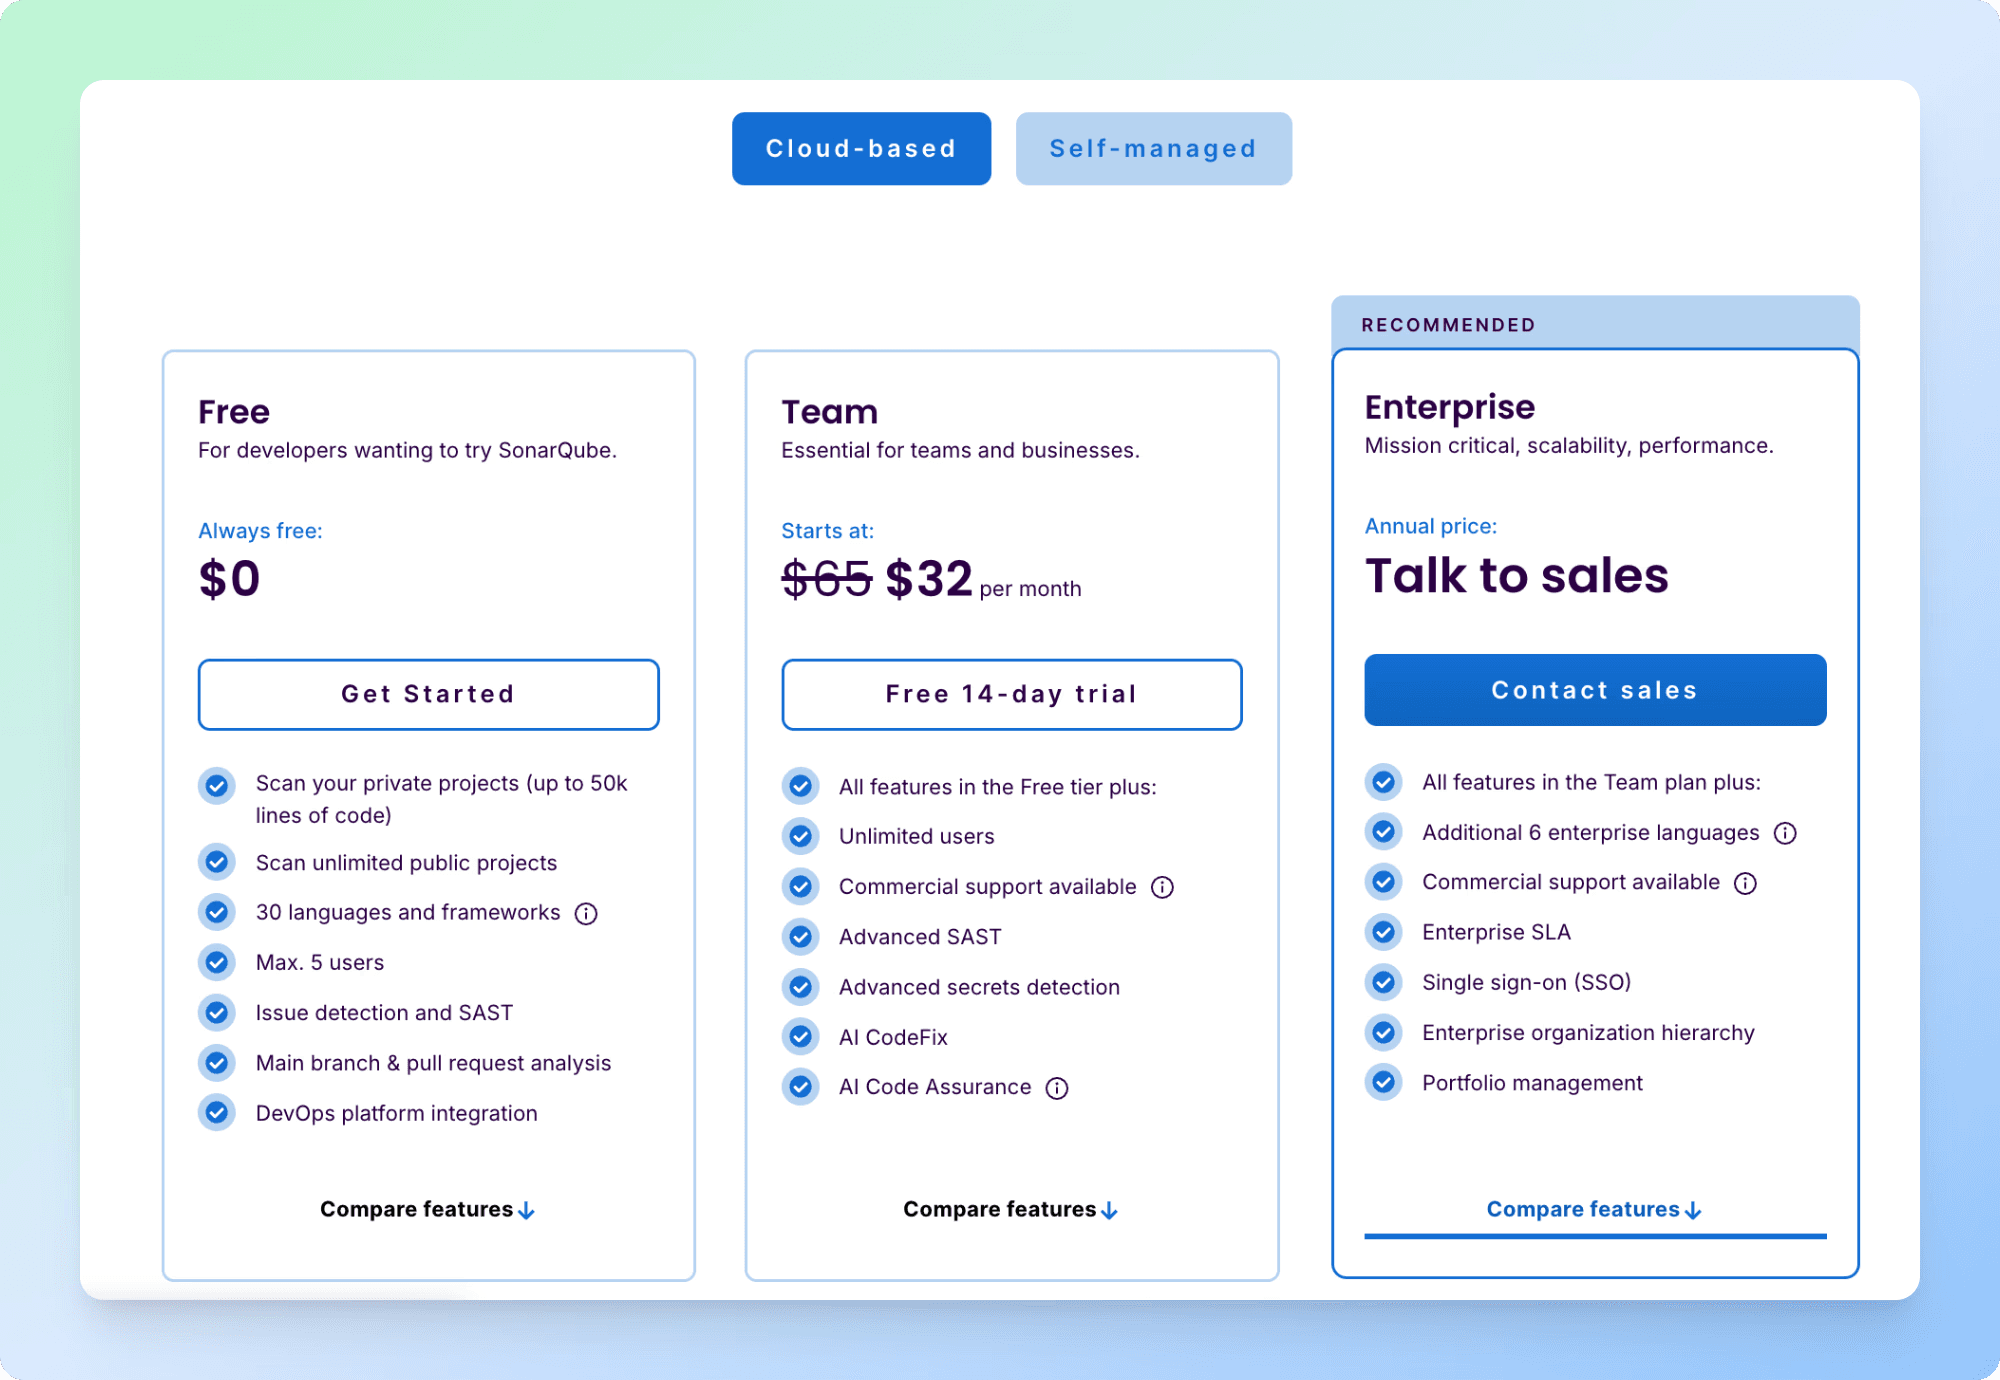
Pricing:
Free community edition. Team plan starting from $32/month and has Enterprise plans available on request.
Full-Stack & SCA Platforms
16. Codacy
Codacy is a code quality platform that gives teams a central place to track issues, enforce standards, and monitor test coverage. It helps highlight not just what's broken, but what could become tech debt, before it piles up.
Pros:
Brings together static analysis, code coverage, duplication detection, and style checks.
Supports 40+ languages and a wide range of linters.
Integrates with GitHub, Bitbucket, GitLab, and common CI/CD pipelines.
Lets teams set custom quality gates and rules for PRs.
Offers developer-level insights, see your own code metrics and trends.
Cons:
May require tuning to avoid noisy alerts.
Some data depends on the correct report setup and format.
Coverage data features are locked behind Pro/Enterprise tiers.
Works with:
All major repo hosts, CI tools, and languages, particularly in teams using mixed stacks.
Best for:
Teams that want to make quality a shared habit, not just a reviewer's responsibility. Great for scaling engineering culture across fast-moving teams.
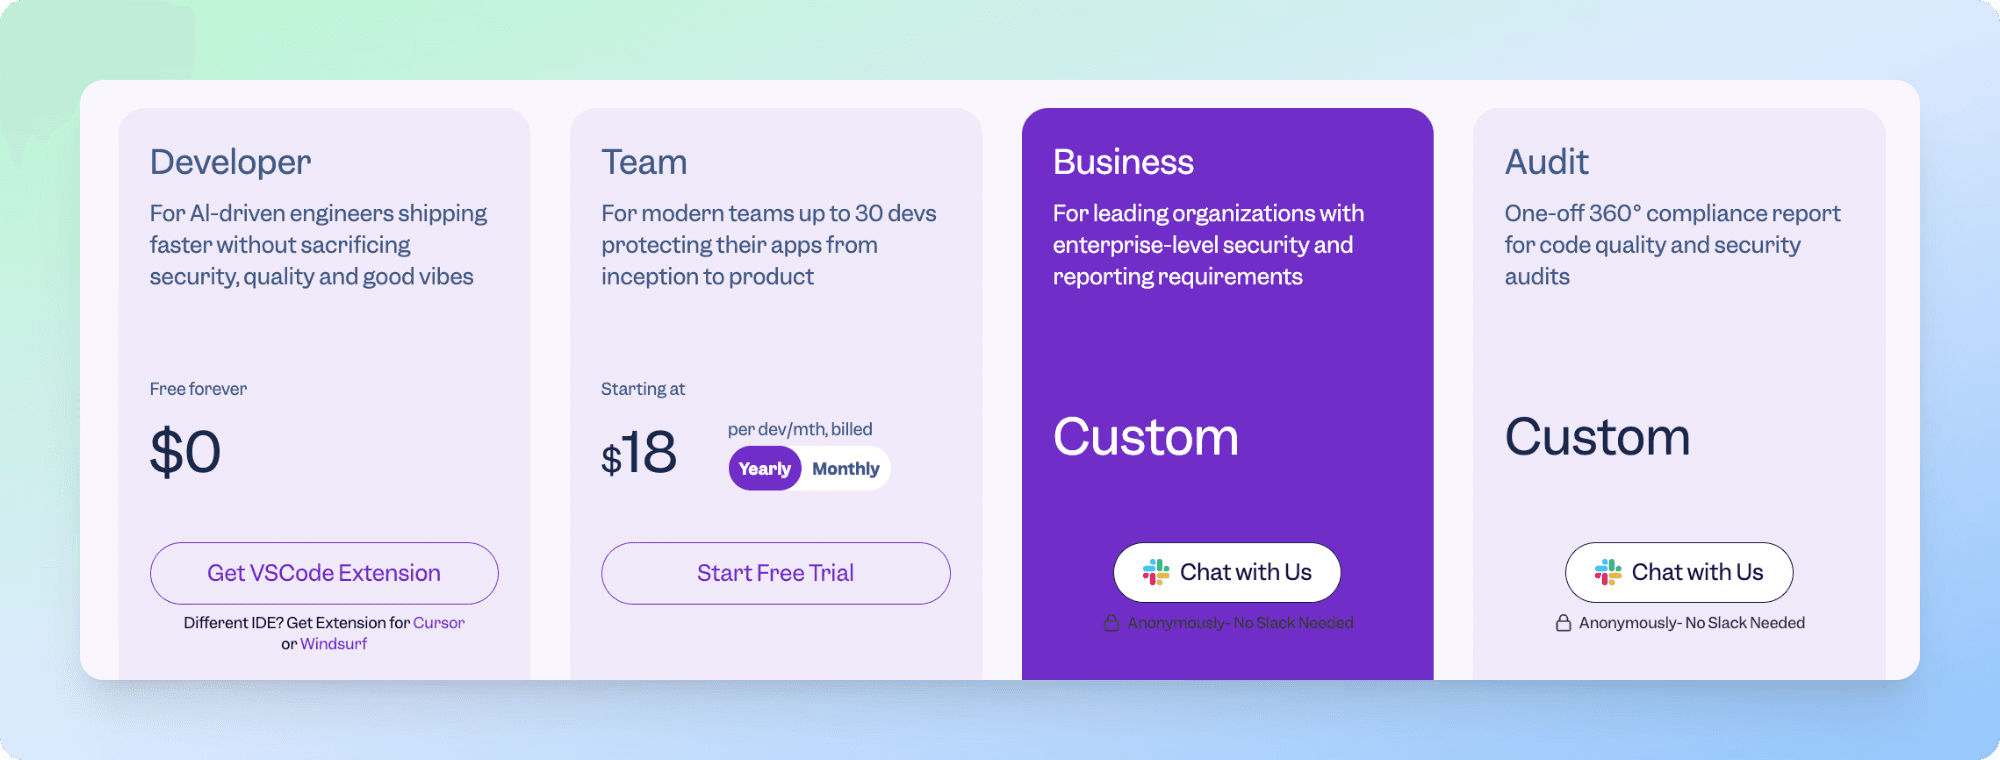
Pricing:
Free developer plan available. Team plan starting from $18/dev/month. An enterprise plan is available on request.
17. CodeClimate
CodeClimate is a platform that connects code quality and test coverage directly to your engineering workflow. It's especially popular for its maintainability metrics and for visualizing how quality trends evolve over time.
Pros:
Combining coverage, complexity, duplication, and security into one dashboard.
"GPA"-style scoring system helps track and benchmark code quality.
Integrates with GitHub/GitLab and common CI pipelines.
Can be used in PRs to block merges based on quality thresholds.
Offers team-level insights and trends over time.
Cons:
Metric models may need adjusting to fit team context.
Some users find the GPA score oversimplified for nuanced codebases.
Requires additional tooling to generate coverage reports.
Works with:
GitHub, GitLab, Bitbucket, CircleCI, Jenkins, Docker.
Best for:
Teams who want to keep an eye on code quality across sprints — not just catch issues at review time.
Pricing:
Paid and has a non-profit plan, too.
18. Amazon CodeGuru
Amazon CodeGuru brings ML-powered reviews and performance profiling into your development process. It doesn't just look at your code style; it analyzes logic, efficiency, and even live application behavior.
Pros:
Uses machine learning to detect performance issues and hard-to-spot bugs.
The reviewer component integrates with pull requests to give inline suggestions.
Profiler analyzes live application (Java, Python) to catch costly operations.
Connects tightly with the AWS ecosystem (Lambda, ECS, CodePipeline).
Cons:
Best suited for apps already running on AWS.
Profiler is currently limited to Java and Python.
Reviewer feedback is useful, but can be generic in certain contexts.
Works with:
AWS CodePipeline, CodeCommit, GitHub, GitHub Actions, Bitbucket, Java/Python applications.
Best for:
Teams already on AWS who want to improve both code quality and runtime performance, without adding extra overhead.
Pricing:
Reviewer and Profiler are priced separately based on usage; no flat-tier pricing.
Final Thoughts
Choosing the right code or test coverage tool isn't about finding "the best one." It's about finding what fits your team, your workflow, and your goals. And that only happens when you roll up your sleeves and actually try a few.
Most of the tools we've covered here, from language-specific ones like pytest-cov or JaCoCo, to full-blown platforms like SonarQube or CodeClimate, are built for teams. Which means the decision isn't just technical, it's practical. It depends on your stack, your CI/CD, your review process, your team size, your compliance needs... the list goes on.
Here's what we've learned building CodeAnt.ai: Until you integrate a tool into your real workflow, no review, not even this one, will tell you if it's right for you.
That's why almost every tool we mentioned either has a free plan or will happily offer a trial if you reach out. Use that. Play with them. Break things. See what helps your team move faster without compromising quality. That's how you find your fit.
And yes, speaking of CodeAnt.ai, we're in that mix too. We recently raised $2M to keep building a fast, secure, and helpful code review experience powered by AI. We're not looking to replace engineers; we'd love to hear what works and what doesn't. If that sounds like something your team's looking for, give us a spin. We'd love to hear what works and what doesn't if that sounds like something your team's looking for.
Want AI-powered reviews and test coverage insights in one place?
👉 Explore CodeAnt AI’s Code Test Coverage Platform to combine quality gates, security scanning, and coverage analytics without slowing your team down.
Thanks for reading, and happy shipping 🚀
FAQs
What does code coverage actually measure in software testing?
Is 100% code coverage necessary for reliable software?
How do you choose the right code coverage tool for your team?
How can developers improve test coverage without slowing down releases?
What’s the difference between line coverage, branch coverage, and function coverage?


Ship clean & secure code faster

Made with Love in San Francisco
355 Bryant St. San Francisco, CA 94107, USA


Ask AI for summary of CodeAnt


