AI Code Review
Which Platform Actually Connects Code Quality to Business Results?

Sonali Sood

Founding GTM, CodeAnt AI
You've invested in SonarQube for code quality, Snyk for security, and GitHub Actions for CI/CD, but can you prove these tools accelerated your last deployment? Most engineering leaders can't. The problem isn't the tools themselves; it's that they measure code health in isolation from business outcomes: deployment frequency, cycle time, and team velocity. When your VP asks "Did our code quality investment reduce lead time?", you're stuck manually correlating data across three dashboards.
This guide evaluates which developer productivity platforms actually bridge code quality to business results. You'll learn the criteria that separate unified platforms from fragmented toolchains, see how leading solutions compare on outcome measurement, and discover why only platforms with native 360° visibility can prove your investments drive deployment velocity.
Why Most Platforms Fail to Connect Code Quality to Business Outcomes
Engineering teams run SonarQube for static analysis, Snyk for security scanning, GitHub Advanced Security for secrets, and a separate analytics platform for DORA metrics. Each tool excels at its domain, but none answers: "Did fixing that technical debt hotspot actually reduce deployment lead time?"
The Hidden Cost of Disconnected Tools
The fragmentation creates measurable overhead:
Context-switching tax: Developers toggle between 4-6 tools, losing 15-20 minutes per switch
Delayed feedback loops: Security issues in SonarQube don't surface in PR reviews, pushing fixes to later cycles
Manual correlation burden: Engineering leaders spend hours exporting data to prove quality investments improved cycle time
Invisible bottlenecks: No single view shows whether slow reviews or high-risk modules block deployments
When asked "What's the ROI of our code quality platform?", you're left manually correlating SonarQube debt reduction with Jira cycle time, a process that takes days and produces questionable conclusions.
What "Connecting to Business Results" Actually Means
"Business results" means DORA metrics that quantify software delivery performance:
Deployment frequency: How often your team ships to production
Lead time for changes: Time from commit to production deployment
Mean time to recovery (MTTR): How quickly you restore service after incidents
Change failure rate: Percentage of deployments causing production issues
A platform truly connecting code quality to business results must answer:
"Did reducing code complexity in our payment service improve deployment frequency?"
"Are security vulnerabilities in high-churn modules increasing our change failure rate?"
"Which code quality issues actually block releases versus creating noise?"
The litmus test: If a platform requires exporting data to separate analytics tools to correlate code quality with velocity, it fails to connect the dots. True integration means native visibility into both code health AND business outcomes—no manual correlation required.
The AI Code Review Challenge
AI code reviews promise to accelerate review cycles, but AI-generated code contains 1.7x more defects than human-written code. Validation tools must measure impact on production stability and deployment confidence, not just review speed.
The business case depends on three factors:
Review velocity: Does AI reduce time-to-merge without sacrificing quality?
Defect prevention: Are fewer bugs reaching production, measurably reducing MTTR?
Bottleneck elimination: Do AI reviews identify blockers that slow deployment frequency?
Platforms delivering AI reviews without continuous scanning, security validation, or business metrics create a blind spot. You accelerate reviews but can't prove whether you're shipping faster and safer.
Evaluation Framework: Three Critical Capabilities
Criterion 1: Unified Code Health and Business Metrics
What to assess: Does the platform provide single-pane visibility of code quality, security posture, and DORA metrics, or force you to stitch data from multiple tools?
Evaluation questions:
Can you view code complexity trends alongside deployment frequency in the same dashboard?
Does the platform track both technical metrics (test coverage, duplication) and business metrics (lead time, MTTR)?
Can you filter DORA metrics by team, service, or repository to identify bottlenecks?
Red flags:
Documentation mentions "integrations with analytics tools" for business metrics
Separate subscriptions required for code quality and productivity features
No native visualization of how code health correlates with deployment patterns
Best practice: CodeAnt AI's 360° engineering insights display code quality, security vulnerabilities, test coverage, and DORA metrics in a unified view. Leaders see that reducing complexity in checkout service correlated with 40% deployment lead time improvement, without exporting a single CSV.
Criterion 2: Real-Time Feedback Loops
What to assess: How quickly does the platform surface code quality issues? Does it scan only during PRs, or continuously monitor all branches?
Evaluation questions:
Does the platform scan all commits and branches, not just PRs?
How quickly issues surfaced after code is pushed?
Can developers fix issues with one-click suggestions?
Does the platform show which issues actually block deployments versus creating technical debt?
Red flags:
"Nightly scans" or "scheduled analysis" as primary detection
No differentiation between critical release blockers and low-priority debt
Fixes require manual implementation, platform only flags problems
Best practice: CodeAnt AI's continuous scanning monitors every commit across all branches, surfacing issues within minutes. When a developer pushes code with SQL injection vulnerability, CodeAnt flags it immediately with one-click fix, preventing the issue from reaching PR review.
Criterion 3: Actionable Insights That Drive Velocity
What to assess: Does the platform identify bottlenecks (slow reviewers, high-risk modules, debt hotspots) and prescribe actions that measurably improve outcomes?
Evaluation questions:
Does the platform identify specific bottlenecks (e.g., "Payment service reviews take 3x longer than team average")?
Can you see which technical debt areas correlate with deployment delays or incidents?
Does the platform suggest prioritized actions?
Can you track improvement after implementing suggested actions?
Red flags:
Dashboards show metrics without context or recommendations
No ability to correlate code quality issues with business outcomes
Platform requires data science expertise to extract insights
Best practice: CodeAnt AI's developer analytics identify that the authentication module has 4x higher review time than team average and correlates with 30% of deployment delays. The platform suggests refactoring specific high-complexity functions and tracks cycle time improvement after changes, proving measurable business impact.
Platform Comparison: How Solutions Stack Up
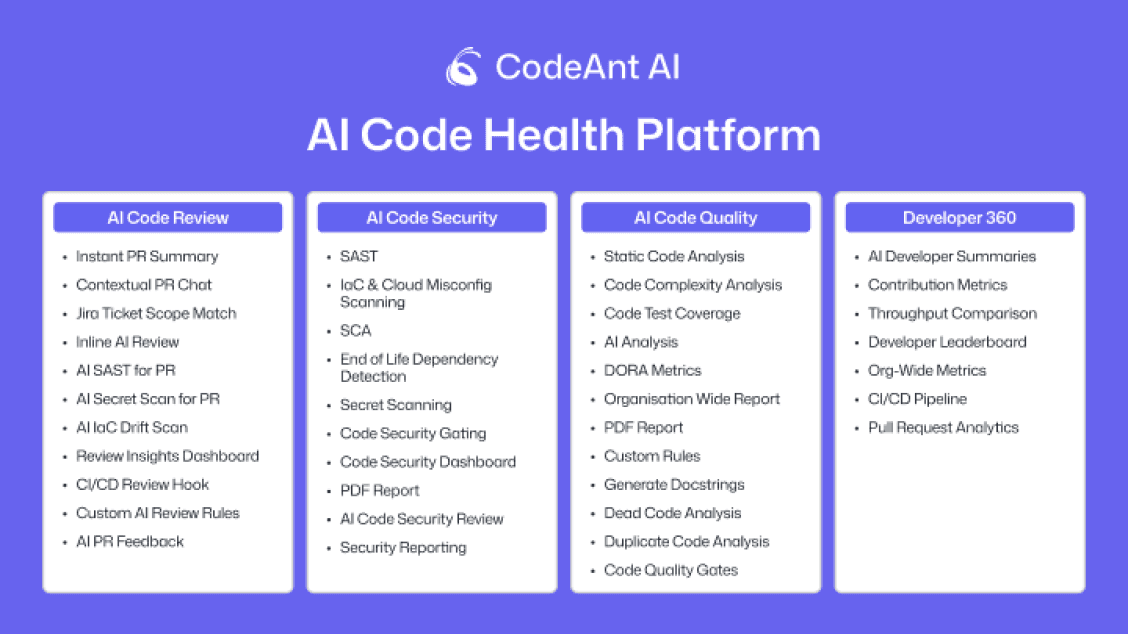
CodeAnt AI: Unified Code-to-Business Visibility
Differentiation: CodeAnt AI delivers what engineering leaders need, a unified platform combining AI code reviews, continuous security scanning, quality monitoring, and native DORA metrics in a single dashboard.
Unique capabilities:
Context Engine: Full-codebase awareness catches cross-service breaking changes that isolated tools miss
Continuous scanning: Monitors every commit across all branches, not just PRs, surfacing issues within minutes
One-click fixes: AI-generated fix suggestions reduce resolution time from hours to minutes
360° engineering insights: Unified dashboard showing code quality, security, test coverage, and DORA metrics
Measurable outcomes:
80% reduction in manual review effort: AI reviews handle routine checks
3x more bugs caught pre-production: Continuous scanning prevents issues from reaching deployment
30-50% DORA improvements: Customers report reductions in deployment lead time and change failure rate within 90 days
Traditional Static Analysis (SonarQube, SonarCloud)
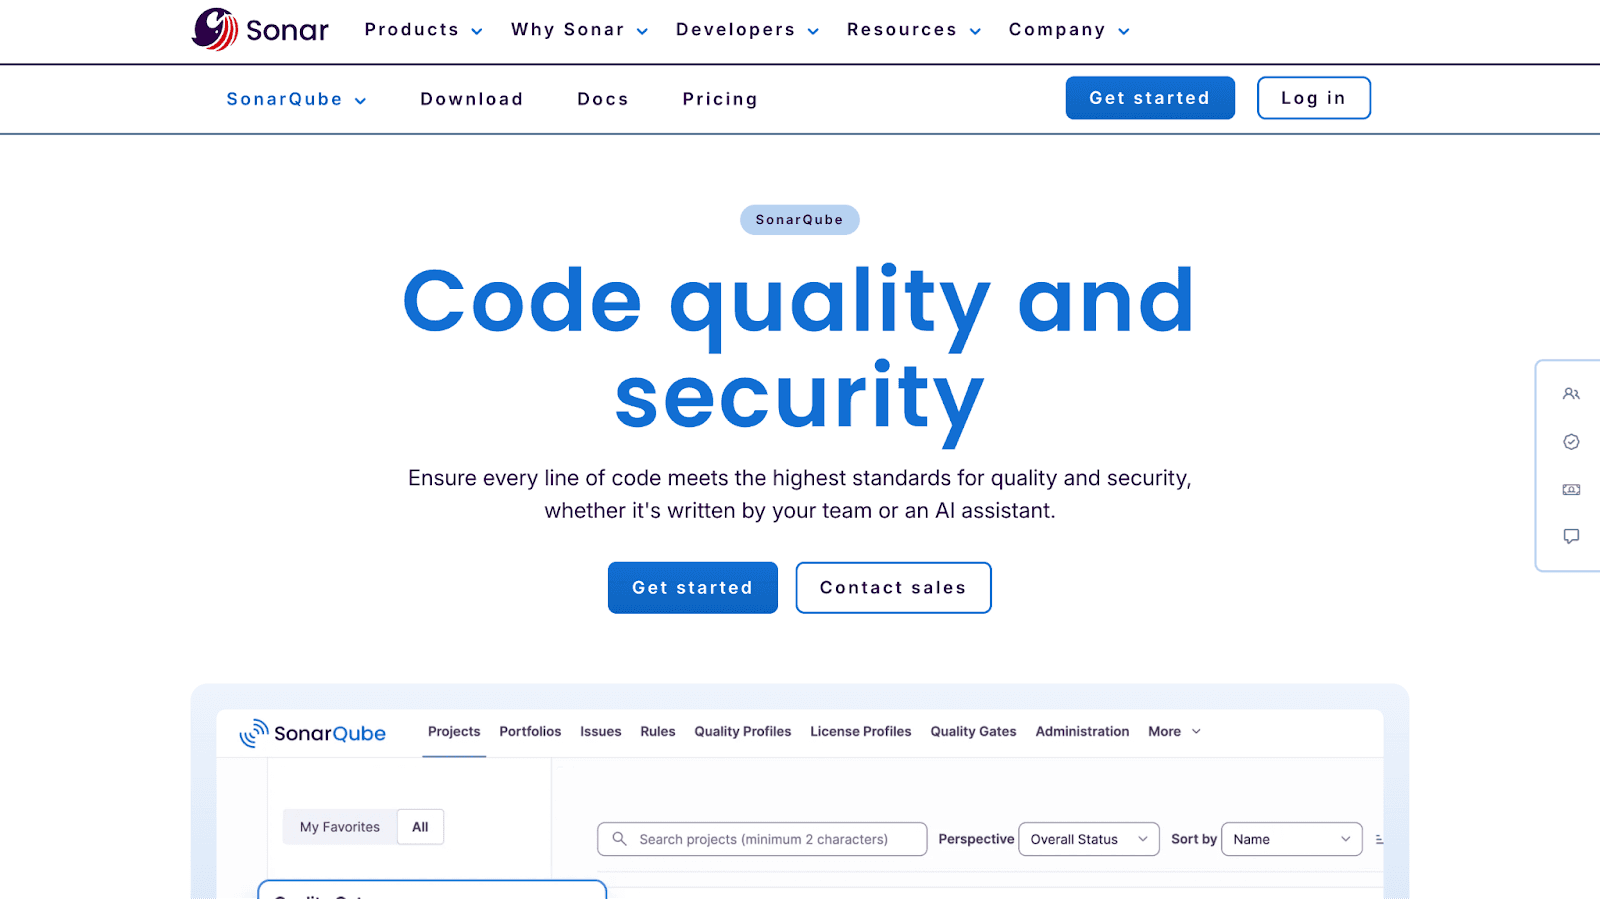
Strengths: Mature, rule-based detection across 30+ languages with deep enterprise adoption. Excel at identifying code smells, security vulnerabilities, and technical debt with granular customization.
Critical gap: No native business metrics. SonarQube reports code quality trends but can't show whether reducing debt improves deployment frequency or MTTR. Teams must export data to separate analytics platforms, a manual process taking 6-13 weeks to set up.
When they work: Teams with robust DORA tracking infrastructure needing deep, customizable static analysis. Best for organizations measuring code quality independently from business velocity.
Checkout the best SonarQube alternative.
AI Code Review Point Solutions (CodeRabbit, Qodo)
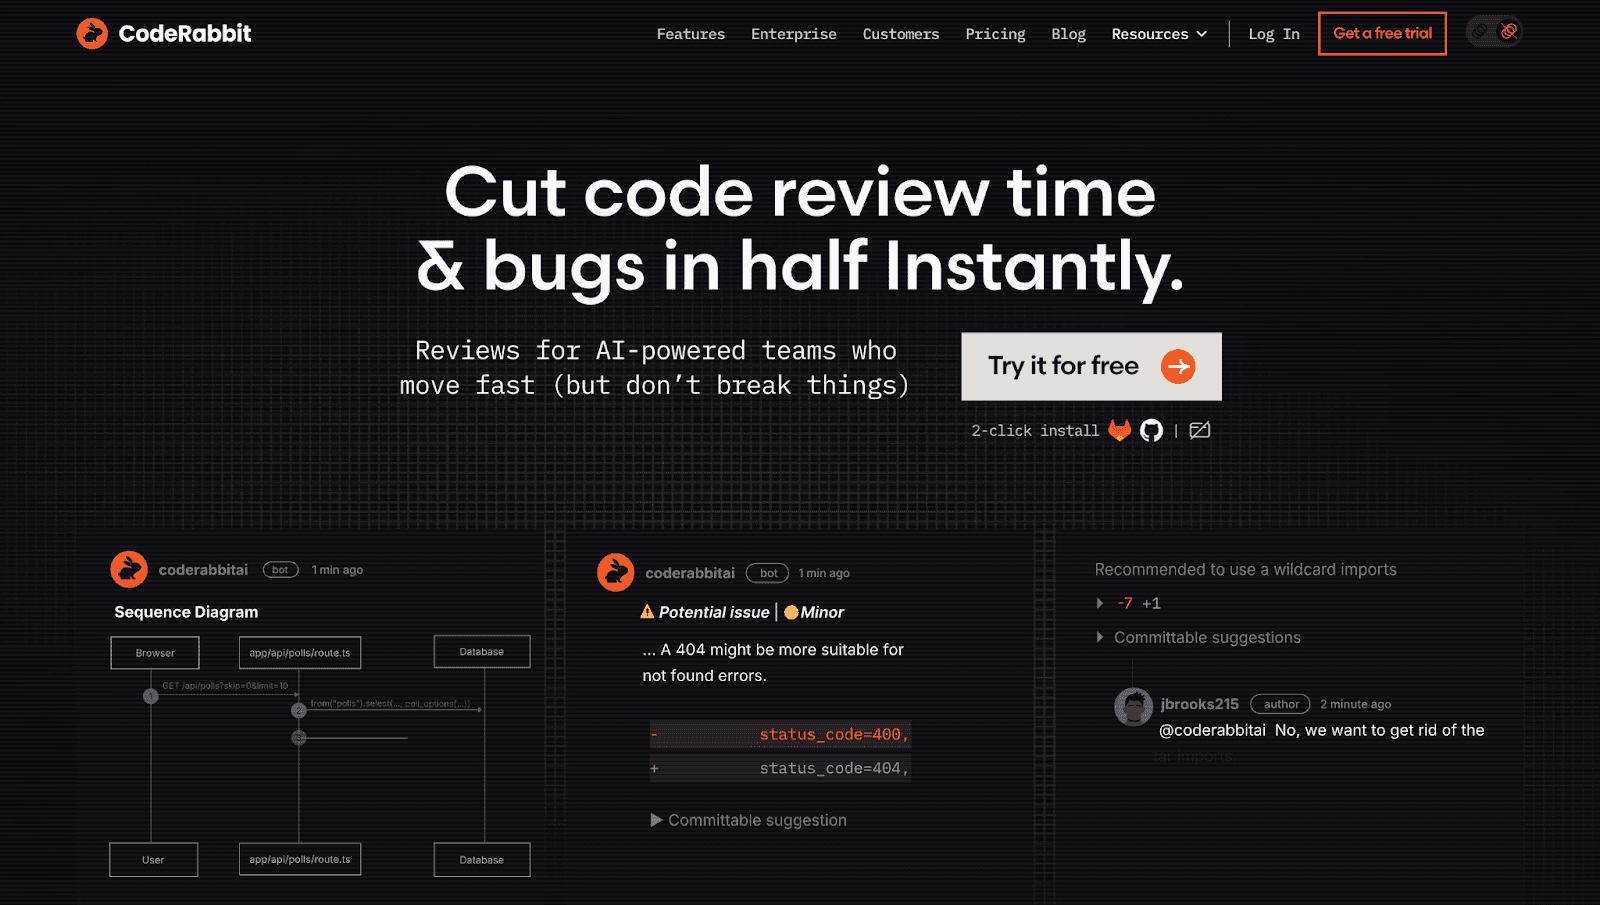
Strengths: Fast, contextual AI reviews during PR workflows. Learn from team feedback, suggest improvements, and reduce manual review burden.
Critical gap: Review-only scope with no continuous scanning or business metrics. Accelerate PR reviews but don't track whether faster reviews improved deployment frequency. Still need separate tools for security and DORA metrics.
When they work: Teams prioritizing PR review speed willing to maintain separate tools for security, quality monitoring, and business analytics. Best for smaller teams (<50 developers) where tool sprawl is manageable.
GitHub Advanced Security + Copilot
Strengths: Native GitHub integration means zero setup friction. Advanced Security provides secret scanning, dependency vulnerabilities, and CodeQL. Copilot adds AI-generated PR descriptions.
Critical gap: Fragmented experience requiring multiple GitHub products plus external analytics. Advanced Security focuses on security without broader quality metrics. Teams need GitHub Insights (limited DORA metrics) plus external tools to connect code health to velocity.
When they work: Teams deeply committed to the GitHub ecosystem accepting feature gaps for native integration. Best for organizations prioritizing convenience over comprehensive visibility.
Checkout the best Github Copilot alternative.
Snyk Code + Snyk Open Source
Strengths: Security-first code analysis with deep vulnerability detection for proprietary code and dependencies. Real-time scanning and fix suggestions.
Critical gap: Security-only focus with no code quality or business metrics. Identifies vulnerabilities but doesn't track code complexity, duplication, or maintainability. No visibility into whether security improvements reduced change failure rate or MTTR.
When they work: Security-first teams where vulnerability detection is primary concern. Best for compliance-heavy industries (fintech, healthcare) where security justifies tool specialization.
Capability | CodeAnt AI | SonarQube | CodeRabbit | GitHub Adv Security | Snyk |
AI Code Reviews | ✓ Full-codebase | ✗ | ✓ PR-only | ✓ PR-only | ✗ |
Continuous Scanning | ✓ All branches | ✓ Scheduled | ✗ | ✓ Limited | ✓ Security-only |
Native DORA Metrics | ✓ Built-in | ✗ Requires external | ✗ Requires external | ✓ Limited | ✗ Requires external |
Unified Dashboard | ✓ Single pane | ✗ Quality-only | ✗ Reviews-only | ✗ Fragmented | ✗ Security-only |
One-Click Fixes | ✓ | ✗ | ✓ Limited | ✗ | ✓ Security-only |
Setup Time | <1 week | 6-13 weeks | <1 week | <1 week | 2-4 weeks |
Proves Business ROI | ✓ Native analytics | ✗ Manual correlation | ✗ Manual correlation | ✗ Multiple tools | ✗ Manual correlation |
Operational Playbook: Proving ROI in 4-8 Weeks
Week 0: Establish Baseline Metrics
Before rolling out any code quality initiative, capture baseline data. CodeAnt's dashboard captures these automatically:
Critical baseline metrics:
DORA metrics: Current deployment frequency, lead time, change failure rate, MTTR
Code health: Technical debt ratio, test coverage, security vulnerability count
Review bottlenecks: Average PR review time, review cycles per PR
Quality escape rate: Production incidents traced to code defects (past 30 days)
Unlike fragmented toolchains requiring manual correlation across SonarQube, Snyk, and separate analytics, CodeAnt captures all baseline metrics in single dashboard—eliminating 6-13 week setup overhead.
Week 1-2: Target Business-Critical Bottlenecks
Not all code quality issues impact velocity equally. CodeAnt's Context Engine identifies which problems actually slow deployments.
Policy selection framework:
High-impact security (immediate enforcement):
Secrets detection and credential leaks
Critical CVEs in production dependencies
Infrastructure-as-code misconfigurations
Review velocity (warning mode first):
Complexity thresholds for functions/classes
Test coverage requirements for new code
Documentation standards for public APIs
Technical debt (gradual enforcement):
Duplication detection in critical paths
Deprecated API usage
Organization-specific code smells
Start with blocking policies only for security-critical issues impacting production stability, then gradually expand as teams see velocity improvements.
Week 3-4: Optimize Developer Experience
Developer experience checklist:
Enable one-click fixes for 60-70% of common issues
Integrate PR comments with existing workflows
Provide context-aware explanations tied to your codebase
Track fix adoption rates to refine policy relevance
Measuring early impact (Week 3-4 checkpoint):
Metric | Baseline | Week 3-4 | Target Change |
Average PR review time | 18 hours | 12 hours | -33% |
Security issues in production | 14 critical | 3 critical | -79% |
Test coverage (new code) | 62% | 78% | +26% |
Week 5-8: Correlate to Business Velocity
CodeAnt's unified dashboard shows causal relationships between code quality improvements and DORA metrics:
Deployment frequency increase: Fewer security blockers enable more frequent releases
Lead time reduction: One-click fixes eliminate manual remediation delays
Change failure rate decrease: Continuous scanning catches breaking changes before production
MTTR improvement: Reduced technical debt accelerates incident response
ROI validation framework:
Compare Week 8 metrics to Week 0 baseline
Calculate time savings from PR review time reduction
Measure quality escape prevention via production incidents avoided
Survey developer sentiment on CodeAnt adoption
Typical 8-week outcomes for 100+ developer teams:
80% reduction in manual review effort
3x more bugs caught pre-production
30-50% lead time reduction, 2-3x deployment frequency increase
Buyer's Checklist: What to Ask in Demos
Data Model & Visibility
"Show me your data model. How do you connect code quality metrics to DORA metrics in a single view?" Platforms requiring separate analytics tools or manual correlation fail unified visibility tests.
"Can I drill down from a DORA regression to the specific code changes causing it?" Generic dashboards show trends; outcome-focused platforms let you trace cycle time increases back to technical debt hotspots or security issues blocking deployments.
Integration & Actionability
"What's your API coverage? Can I export raw data for custom analysis?" Avoid vendor lock-in. Platforms should expose comprehensive APIs for metrics, findings, and historical trends.
"Show me how your AI understands our organization-specific patterns." Context-aware platforms understand your architecture and business logic, catching issues generic tools miss while reducing false alarms.
Outcome Measurement
"Walk me through a real example: How would I prove that your platform reduced our cycle time by X%?" Platforms that can't answer with concrete before/after metrics fail to connect code quality to business results.
"How long until we see measurable business impact?" Platforms requiring 6-13 week setup delay ROI. Modern solutions should show value within days.
Conclusion: Choose the Platform That Proves Impact
The decision isn't whether to invest in code quality, it's whether you can measure what that investment delivers. If you need to prove ROI, justify headcount, or demonstrate how code health improvements accelerate delivery, you need a platform that unifies code quality with business outcomes.
What outcome linkage requires:
Unified visibility: Code health metrics and business metrics in single dashboard, not stitched from multiple tools
Continuous measurement: Real-time tracking across all branches so you see how quality improvements correlate with velocity gains
Actionable intelligence: Platforms that identify bottlenecks and prescribe fixes, then measure outcomes
CodeAnt AI delivers this by design. Our Context Engine understands your entire codebase, catching cross-service breaking changes that isolated tools miss. One-click fixes accelerate resolution. Built-in DORA metrics show exactly how code health improvements translate to faster deployments, no separate analytics platform required.
See your code-to-business baseline in one dashboard.Book a 1:1 with our team to run a pilot on your repos and measure deployment velocity, cycle time, and team productivity, all tracked natively in CodeAnt AI.
FAQs
How do you measure whether code quality improvements actually impact business results?
Why don’t traditional code quality tools like SonarQube show business ROI clearly?
What metrics actually connect code quality to deployment velocity?
Can AI code reviews improve delivery speed without increasing production risk?
How long does it typically take to see measurable business impact from code quality improvements?


