AI Code Review
We Tested Best 15 DORA Metric Tools for DevOps Success in 2026

Sonali Sood

Founding GTM, CodeAnt AI
Ever wondered how top-performing tech companies ship code so quickly without breaking things? The secret lies in measurement, specifically, DORA metrics. These four key indicators:
Deployment Frequency,
Lead Time for Changes,
Change Failure Rate, and
Mean Time to Recovery
have become the gold standard for engineering teams looking to improve their DevOps practices.
Whether you're struggling with slow deployments or frequent production issues, understanding and tracking these metrics is your first step toward improvement.
But measuring these metrics manually can be tough, which is why DORA metric tools exist.
In this article, we'll dive deep into the top 15 DORA metrics tools. But let's first understand what is dora metrics in detail.
What is DORA?
If you've been in software development for a while, you've probably heard colleagues mention "DORA metrics" in meetings.
But what exactly is DORA, and why should you care?
DORA (DevOps Research and Assessment) started as a research program that studied how the best teams deliver software. Now backed by Google Cloud, their annual State of DevOps Report has analyzed data from thousands of engineering teams worldwide to identify what makes high-performing teams different from the rest.
Think of DORA as the team that finally put numbers behind what we all suspected: faster, more reliable deployments lead to better business outcomes. Their research doesn't just give us opinions, it provides data-backed benchmarks to aim for.
What is DORA Metrics?
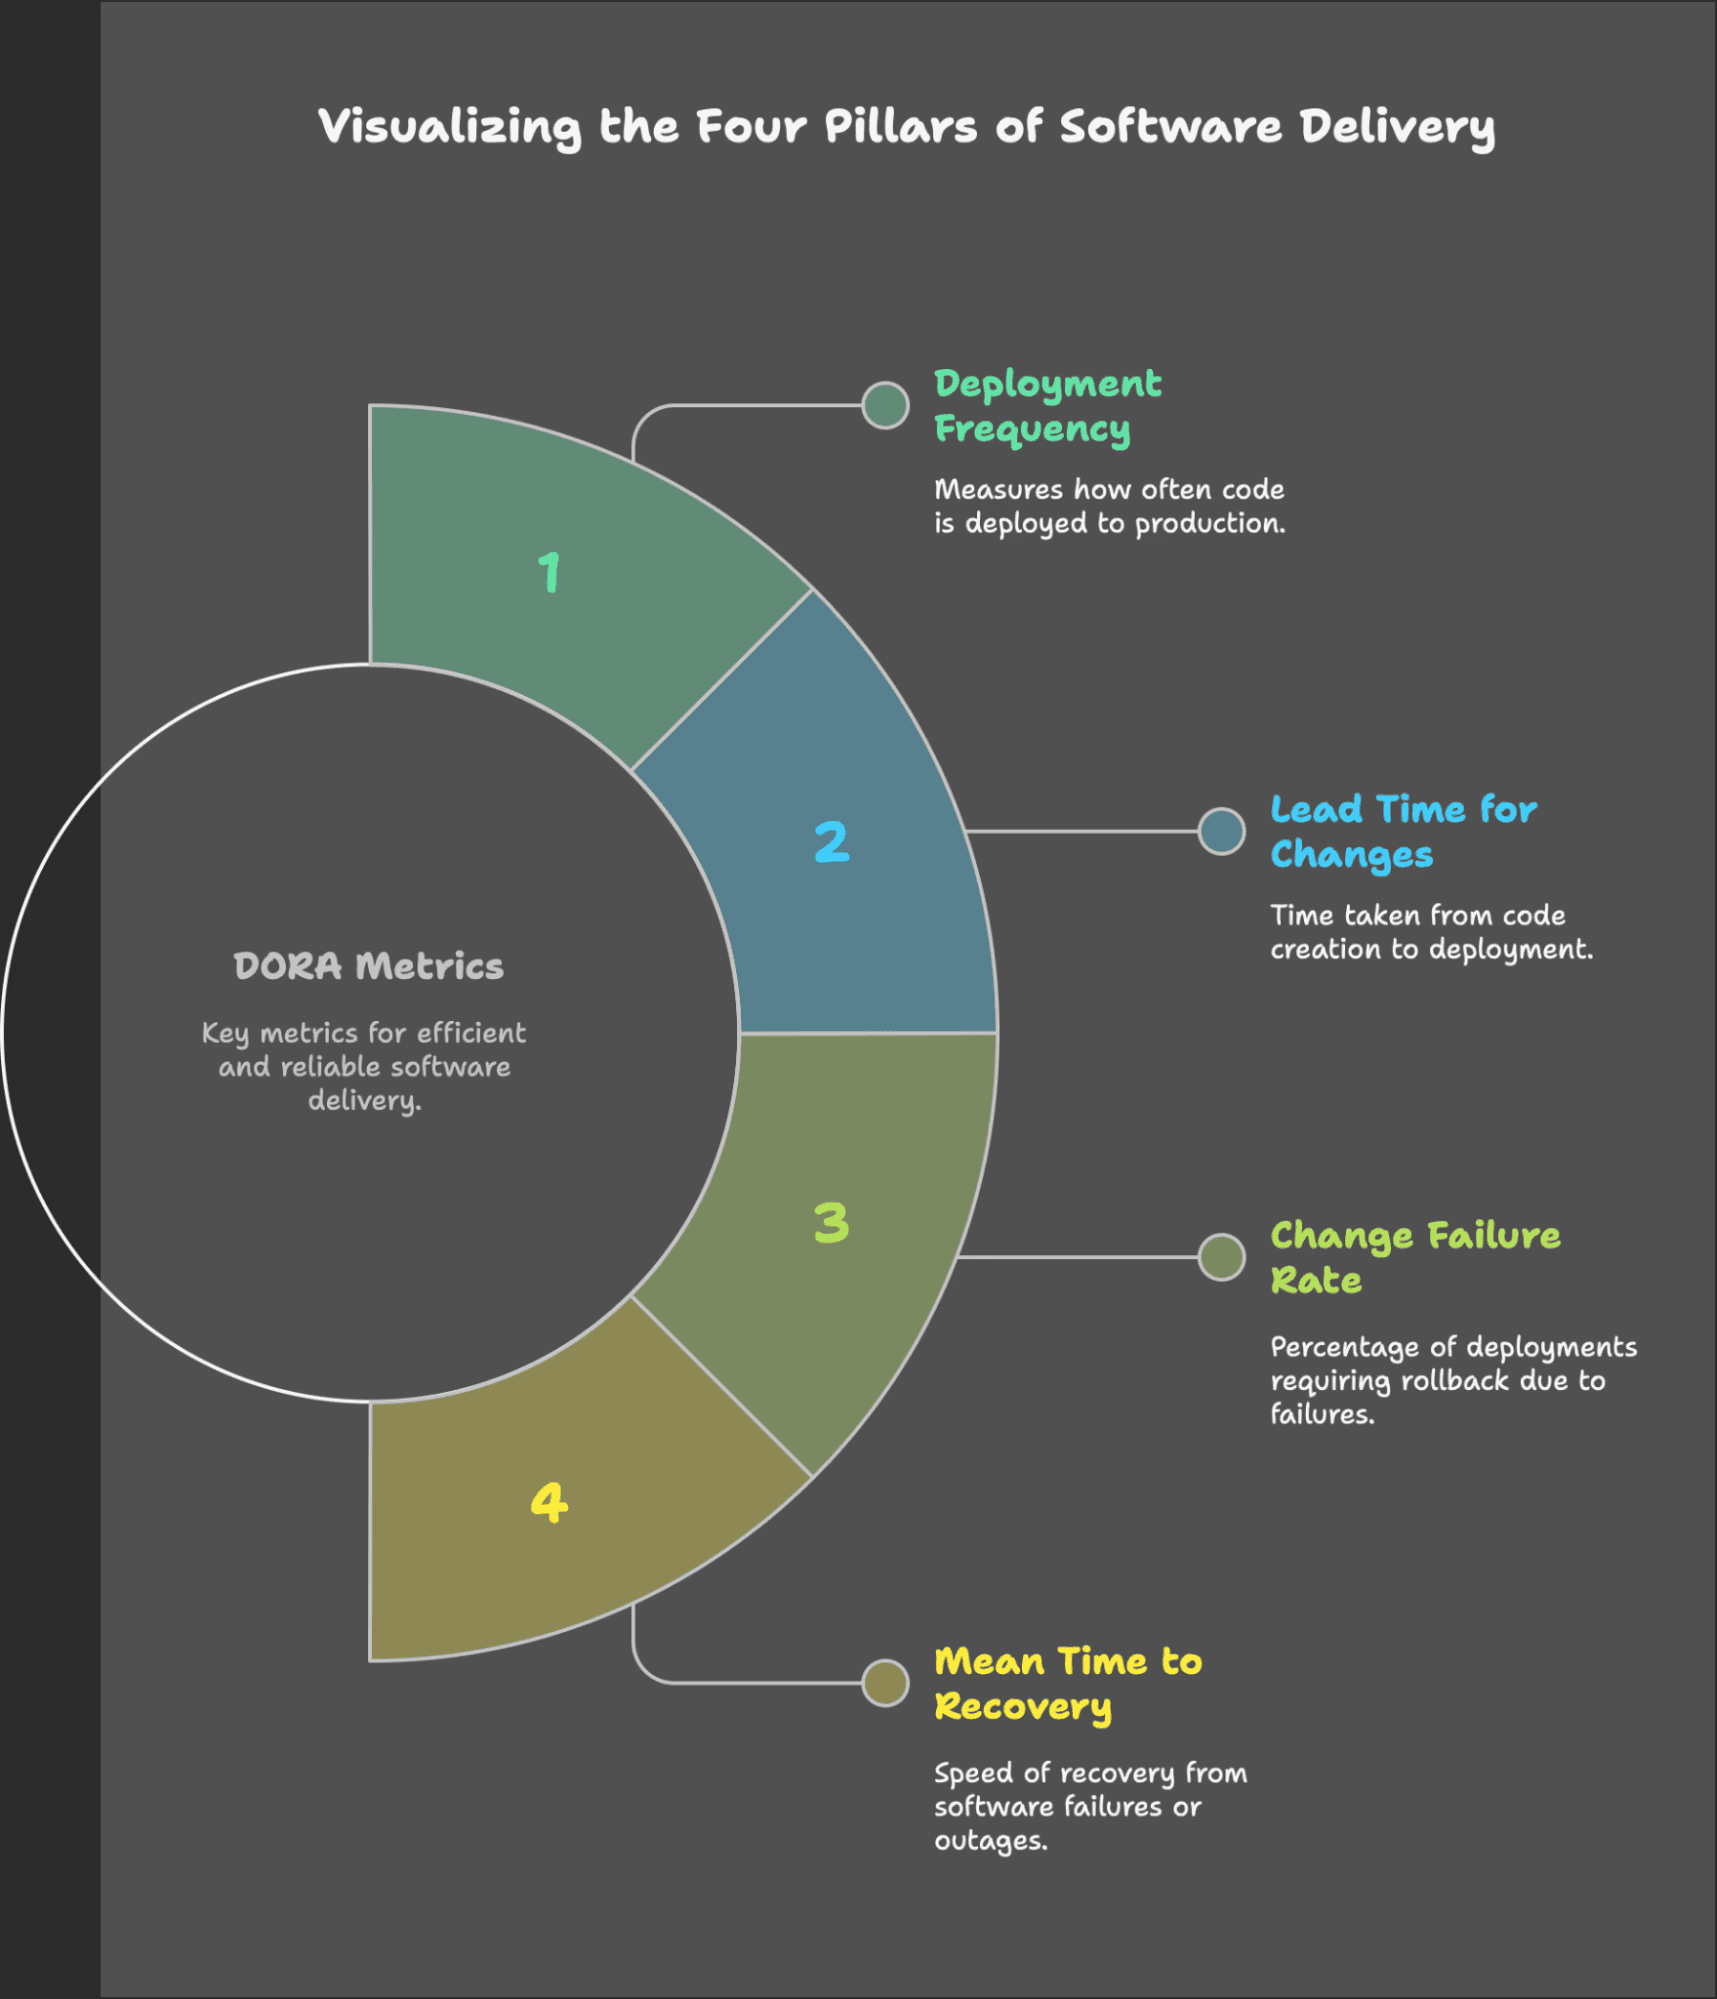
DORA metrics aren't just another set of vanity numbers. They measure what actually matters in software delivery. Let's break them down:
DORA metrics help answer one fundamental question: Is your software delivery process efficient and reliable? Let's break down the four key metrics with simple explanations and real-world context.
1. Deployment Frequency (DF)
"How often does your team push code to production?"
Why it matters: Frequent deployments indicate a mature CI/CD pipeline and a fast-moving team.
Ideal benchmark: High-performing teams deploy daily or multiple times per day.
Example: If your team only deploys once a month, it might be a sign that your process is too slow or risky.
2. Lead Time for Changes (LT)
"How long does it take from writing code to getting it live?"
Why it matters: Shorter lead times mean faster innovation and fewer bottlenecks.
Ideal benchmark: Elite teams ship changes in less than a day.
Example: If a simple bug fix takes weeks to go live, that's a red flag indicating inefficiencies in the pipeline.
3. Change Failure Rate (CFR)
"What percentage of deployments result in failures requiring a rollback?"
Why it matters: A high failure rate suggests unstable code or poor testing practices.
Ideal benchmark: The best teams keep failures under 15%.
Example: If 30% of deployments cause incidents or rollbacks, your testing, QA, or deployment strategy likely needs improvement.
4. Mean Time to Recovery (MTTR)
"When something breaks, how fast can your team fix it?"
Why it matters: Fast recovery minimizes downtime and improves user experience.
Ideal benchmark: Best-in-class teams recover from failures in less than an hour.
Example: If a single outage takes a whole day to fix, it can impact users, revenue, and team morale.
Why Should You Care About DORA Metrics?
You might be thinking, "Great, more metrics to track." But DORA metrics aren't just numbers for management reports, they directly impact your day-to-day work life:
Less stress, more flow: Frequent, successful deployments mean smaller changes, fewer high-pressure releases, and less time spent firefighting.
Happier customers: Faster delivery means faster feedback and the ability to market changes to implement what customers actually want.
Competitive advantage: Companies with elite DORA metrics can respond to market changes up to 200x faster than their competitors.
Better work-life balance: When deployments are routine and recovery is quick, weekend emergencies become rare.
Here's the thing about DORA metrics, they're not just correlates of high performance; they're predictors of it. Teams that improve these metrics consistently deliver better business outcomes.
Now that you understand what DORA metrics are and why they matter, you're probably wondering how to track them. That's where specialized tools come in, and in the next section, we'll explore the 15 best options available in 2025. but first…
Best DORA Metrics Tool Comparison Table for 2026
Too many options? Don’t worry… before we dive into each tool, here’s a quick “at a glance” showdown of the top 15 DORA metrics platforms. See which ones nail Deployment Frequency, Lead Time, Change Failure Rate, and MTTR tracking, plus the integrations (like Azure DevOps) and quality gates your team actually needs.
Tool | Best for | Highlights | Pricing (from) | Key Integrations |
|---|---|---|---|---|
CodeAnt.ai | AI-powered code reviews + quality & security gates to improve DORA metrics | Azure DevOps + GitHub/GitLab/Bitbucket integration, one-click auto-fixing for code quality & security issues, customizable PR review rules, secret scanning, IaC & SAST checks, SOC2/ISO compliance dashboards, consolidated metrics view, blocks PRs with critical issues before merge | $24/dev/mo (Free 14-day trial) | Azure DevOps, GitHub, GitLab, Bitbucket, VS Code/JetBrains plugins, CI/CD pipelines |
Port | Internal developer platform + scorecards | Software catalog, self-service, scorecards | Free; paid $30/dev/mo | Git, Cloud (AWS/Azure/GCP), CI |
Swarmia | Team-centric delivery insights | SPACE-aligned, team agreements, low setup | ~€20/dev/mo | GitHub, Jira/Linear, Webhooks |
LinearB | Fast improvement with automation | Bottleneck detection, WorkerB automation | Free; Pro $49/dev/mo | GitHub, Jira, Slack |
Jellyfish | Leadership/finance-grade accuracy | Work model engine, SOC2/ISO, advisory | Custom | Jira, Git providers, PM tools |
Minware | Zero-effort reporting from existing data | Auto-metrics, custom query language | $25/dev/mo | GitHub/GitLab/Azure, Jira, Google |
Code Climate | Strategic transformation + IQ for eng | Surveys + data, custom dashboards | ~$16.7–$20/seat | GitHub, Jira, test coverage |
Haystack | Lightweight standups + early warnings | 10-sec standups, epic tracking, alerts | Custom | GitHub/GitLab, Jira |
Faros AI | Complex, multi-pipeline orgs | Precise attribution, OSS option | Free; Pro $29/contrib/mo | Git, Jenkins/CircleCI/GHA, Jira |
Waydev | Exec-friendly engineering intelligence | Unified DORA views, trends/benchmarks | $29–$54/contrib/mo | Git, CI, Slack/Teams, PM |
Uplevel | DORA + team wellbeing (burnout, time) | Time allocation, deep work, meeting load | Custom | Git, Jira, Slack/Teams/Calendar |
Jira Premium | Atlassian-first teams | DevOps dashboards, native DF/LT | $15.25/user/mo | Bitbucket, GitHub/GitLab, CI, Opsgenie |
GitLab | All-in-one DevOps platform | VSA, built-in CI/CD, APIs | $29–$99/user/mo | Built-in; Jira, Cloud providers |
Datadog | DORA + full-stack observability | Correlates app/infra with delivery | From ~$15/host/mo (APM) | AWS/Azure/GCP/K8s, CI, PagerDuty |
CircleCI | Reliable CI data feeding DORA | Pipeline insights, performance, scaling | $0–$99+/mo | GitHub/GitLab/Bitbucket, Slack |
1. CodeAnt.ai: AI-Powered Code Quality That Transforms DORA Metrics
For teams serious about improving DORA metrics through code quality, Y Combinator-backed CodeAnt.ai delivers AI code reviews that significantly reduce deployment failures and accelerate development cycles with unique features unavailable in other tools.
Key Features:
One-click auto-fixing for code quality issues, security vulnerabilities, and algorithmic inefficiencies
Advanced AI code review across 30+ programming languages with fully customizable prompts
Industry-exclusive CI/CD status checks that block PRs containing critical security issues or exposed secrets
Comprehensive code change summaries generated in under 2 minutes for all stakeholders
Centralized dashboard showing all AI-generated suggestions in one consolidated view
Highly configurable PR review settings tailored to specific team workflows and standards
Smart detection of algorithmic inefficiencies, missed edge cases, duplicate/dead code, and anti-patterns
Code Quality and Security Gate that ensures only safe, high-quality code reaches production
Pros:
Directly impacts Change Failure rate through preventative, high-quality code reviews
Significantly reduces lead time with automated fixes and rapid code reviews
Functions as a 24/7 AI pair programmer that continuously improves with usage
Provides management-friendly metrics dashboard to demonstrate concrete ROI
Unique code quality features unavailable in competing AI code review solutions
Enhances developer productivity while maintaining stringent quality standards
SOC 2 and ISO 27001 compliance for enterprise security requirements
Pricing:
Free 14 day trial available
Code Security and Quality plans designed for growing organizations (Starting from $15/dev/month)
Self hosted solution for enterprises with advanced configuration and security features
Here's how CodeAnt.ai works:
Scans every PR for security flaws, dead code, and anti-patterns (SAST, IaC, secrets).
Auto-fixes 5,000+ code quality issues while you code (VS Code/JetBrains plugins).
Slash Review Time, Not Corners with Fewer production fires → lower Change Failure Rate.
AI-generated PR summaries highlight risks and changes in plain English.
Integrates with GitHub/GitLab to flag bottlenecks (e.g., "This PR introduces 3 high-severity issues")
Health dashboards track code complexity, duplication, and docs coverage.
Weekly exec reports show exactly how tech debt impacts MTTR/Deployment Frequency.
2. GitLab: AI-Powered DevSecOps Platform
GitLab's approach to DORA metrics stems from its philosophy of providing a complete DevOps lifecycle in a single application, with metrics collection as a natural extension of its CI/CD capabilities.
Key Features:
Integrated DORA metrics through Value Stream Analytics
CI/CD Analytics with pipeline success rates and duration
Deployment frequency tracking across environments
Lead time calculation from commit to production
Programmatic metrics access through APIs
Pros:
Complete source-to-deployment metrics without additional tools
Consistent data model across all development activities
Self-hosted option for security-conscious organizations
Scales effectively from small teams to enterprise
Cons:
Maximum value realized only when fully on GitLab ecosystem
Learning curve for teams migrating from other version control systems
Premium tiers required for advanced metrics
Pricing:
Premium: $29 per user monthly (annual billing)
Ultimate: $99 per user monthly (annual billing)
Self-hosted options available with similar tier structure
Integrations:
Built-in CI/CD eliminates need for pipeline integrations
Project Management: Jira, Azure DevOps
Cloud Providers: AWS, Azure, Google Cloud
Security: Various scanning tools built-in
Jira Premium: Partial Native DORA Support
For teams already embedded in the Atlassian ecosystem, Jira Premium offers native support for some DORA metrics while requiring integrations for others—expanding an existing tool rather than adding a completely new one.
Key Features:
Native tracking for deployment frequency and lead time for changes (as cycle time)
DevOps performance visualization dashboards in Premium tier
Real-time monitoring of deployments when integrated with CI/CD tools
Customizable workflows, boards, and reporting
Support for Agile methodologies including Scrum and Kanban
Pros:
Minimal new tooling for Atlassian-centric teams
Unified view of project management and key delivery metrics
Familiar interface reduces adoption friction
Rich existing ecosystem of plugins and extensions
Real-time data visibility through dashboards
Cons:
Premium plan ($15.25/user/month) required for native DORA metrics
No native support for change failure rate and time to restore service
Additional integrations needed for complete DORA metrics tracking
Can become complex in large installations
Steeper learning curve for new users
Pricing:
Free: Up to 10 users (no DORA metrics)
Standard: $7.75 per user monthly (no DORA metrics)
Premium: $15.25 per user monthly - includes native DORA metrics
Enterprise: Custom pricing with advanced governance features
Integrations:
Native: Bitbucket, Confluence, Jira Service Management, Statuspage
DevOps tools: GitHub, GitLab, Jenkins, CircleCI, Bamboo
Incident management: PagerDuty, Opsgenie (for tracking restore times)
Marketplace: Hundreds of apps for enhanced metrics tracking
4. Datadog: Observability Giant in DevOps Analytics
Datadog brings its monitoring expertise to DORA metrics, treating software delivery as another critical system to observe alongside infrastructure and application performance.
Key Features:
Multiple data source correlation (APM, CI/CD events, incidents)
DORA metrics visualization with extensive filtering capabilities
Centralized view across entire organization
Real-time metrics dashboards and alerting
Anomaly detection and forecasting
Pros:
Integrates delivery metrics with application and infrastructure monitoring
Provides context from across the technical stack for each metric
Exceptional scalability for large enterprises
Advanced correlation capabilities between metrics
Cons:
Complexity can be overwhelming for smaller organizations
Higher cost structure compared to focused tools
Requires dedicated effort to configure optimally
Pricing:
APM: Starting at $15 per host monthly and goes upto $34/month (annual billing)
Volume discounts available for larger deployments
Integrations:
Infrastructure: AWS, Azure, GCP, Kubernetes
CI/CD: Jenkins, CircleCI, GitHub Actions, GitLab
Incident Management: PagerDuty, ServiceNow
Over 850 total integrations
Port: Developer's Home Base for DORA Tracking
Ever felt like you're drowning in dev tools? Port steps in as that friend who organizes your chaotic apartment. It brings your entire development ecosystem under one roof, turning scattered metrics into actionable insights that even your non-technical stakeholders can understand.
Key Features:
Your own custom-built software catalog that actually reflects how your team works
One-click self-service actions that let developers help themselves
Digital scorecards that highlight wins without the micromanagement vibes
Fully brandable interface that feels like part of your internal tools
Tinkerer-friendly with an open source extension framework
Pros:
Get rolling in hours instead of the usual weeks-long setup
Molds to your workflow rather than forcing you to adapt
Declutters the developer experience so they can focus on code
Bakes in those security guardrails your compliance team keeps asking for
DORA metrics emerge naturally from your workflow, not as extra work
Cons:
Connecting all your data sources can get messy
You'll need to think carefully about how to define your metrics
Like any powerful tool, full value requires thoughtful implementation
Pricing:
Starter tier: Free for small teams (up to 15 devs)
Growing teams: $30 per developer monthly (up to 50 people)
Big organizations: Custom enterprise pricing
Integrations:
Plays nice with whatever Git you prefer
Hooks into your cloud setups
Connects with both cloud services and on-premise tools
Plugin ecosystem for those special-case integrations
Swarmia: Where Developer Happiness Meets Measurement
Remember when someone tried to measure your productivity by lines of code? Swarmia was built by people who hated that approach. Their platform puts team culture first, recognizing that forcing "productivity" metrics often backfires spectacularly.
Key Features:
Sees your entire development story without singling out individuals
Slides into your existing workflow instead of disrupting it
Records everything so you can spot long-term patterns
Collaborative work agreements that guide rather than dictate
Built with security paranoia (in a good way)
Pros:
Covers all DORA metrics without the usual implementation headaches
Focuses on team achievements rather than individual scorecards
Gets you up and running without the usual onboarding pain
Uses the SPACE framework you've heard smart engineering leaders talk about
Enterprise-grade security that'll make your InfoSec team smile
Cons:
Their Lead Time metric gets confused by PR-based workflows
Recovery time reporting feels hidden away where you won't notice it
Historical DORA trends require more clicks than they should
Only plays well with GitHub (sorry GitLab fans)
Not the most flexible if you have unique workflow needs
Pricing:
Website's pricing is €20/dev/month if billed annually, it has module based pricing
Most teams pay around $20K per year
Refreshingly, no mandatory sales calls
Integrations:
GitHub for all your code needs
Jira and Linear for ticket tracking
Webhook support for CI/CD pipelines
Companies like Miro, Docker and Webflow swear by it
LinearB: The "We Promise Results" Platform
LinearB comes with a bold claim that might raise your eyebrows: they guarantee better delivery metrics in 90 days or... well, they don't actually say what happens otherwise.
But their confidence comes from a laser focus on automating away the bottlenecks most teams struggle with.
Key Features:
Smart suggestions that point to specific process improvements
Bottleneck detection that explains why things are stuck
Planning tools that help estimation actually make sense
WorkerB automation that handles repetitive busywork
A dedicated DORA dashboard that even executives can understand
Pros:
The 90-day improvement guarantee gives you a clear timeline
Fits around your existing tools instead of replacing them
Slack notifications that provide context when you need it
All 4 DORA metrics visible in one clear view
A forever-free tier that lets smaller teams benefit too
Cons:
Their recovery time calculation relies on tickets, not actual incidents
Oversimplified failure rate calculation misses nuance
Won't work well if you're using trunk-based development
Individual metrics can create unhealthy internal competition
One-size-fits-most approach limits customization
Pricing:
Small teams: Free forever with 3-month data history
Mid-size teams: $49 monthly per developer (50 minimum)
Enterprise needs: Custom pricing for large teams
Integrations:
Works with most ticket systems (Jira, GitHub Issues, etc.)
GitHub for code review (but limited workflow support)
API access for custom reporting needs
Slack for team communication
Jellyfish: The Platform Engineering Leaders Trust
What do 20,000 engineering teams know that you might not? Many have turned to Jellyfish, giving it that impressive 4.5/5 rating that makes it the trusted choice for companies serious about engineering metrics.
It's particularly strong for organizations where data accuracy and enterprise features matter.
Key Features:
Their special sauce "Work Model Engine" connects tickets and code
AI impact tracking shows if those expensive tools are worth it
Works alongside your Jira setup without forcing process changes
Clean, straightforward DORA metrics dashboard
Serious about security with dual SOC certification
Pros:
Most accurate DORA metrics tracking according to independent reviews
Users actually like it (that 4.5/5 rating isn't easy to earn)
No source code access required—keeps your IP secure
Team-oriented metrics avoid creating internal competition
Dedicated experts help you interpret the data properly
Cons:
Missing deployment feedback capabilities many teams want
No code-level notifications to keep developers informed
Limited flexibility for unique organizational needs
Heavy reliance on APIs rather than direct integrations
Price point higher than more basic alternatives
Pricing:
Wide range from $20/dev/month (Pricing not available on the website)
Most teams pay around $3K yearly
Integrations:
Compatible with all major ticket systems
Supports the version control systems you're already using
Connects to common project management tools
Minware: Zero-Effort Project Management That Actually Make Sense
Sick of manually logging time or updating statuses just to get basic metrics?
Minware built their entire platform around a radical idea: what if we could extract meaningful metrics without making developers do extra work?
Their approach focuses on automatic data collection that doesn't disrupt your workflow.
Key Features:
Smart data models that generate metrics from what you're already doing
Custom query language for when you need tailored reports
Full historical data that never leaves gaps in your analysis
Shareable dashboards you can send to stakeholders
Objective benchmarks that help teams improve naturally
Pros:
Completely eliminates manual logging and timesheet pain
Build reports that answer your specific questions
Focuses on metrics that drive business impact, not vanity numbers
Helps finance teams track and improve development costs
Connects with the tools your team already loves
Cons:
Newer player without extensive user reviews
Custom query language means another thing to learn
Less established than some competitors in the space
Pricing:
Startups: Free for tiny teams (1-5 developers)
Growing teams: $25 per developer monthly
Larger orgs: Custom enterprise plans available
Integrations:
All major code repositories (GitHub, GitLab, Azure)
Jira and similar project tools
Google workspace integration
Code Climate: Your Engineering Intelligence Partner
Code Climate takes a distinctly different approach. Rather than just giving you dashboards and walking away, they position themselves as strategic partners in your engineering improvement journey.
This consultative approach means they're particularly valuable for leadership teams going through transformation initiatives.
Key Features:
Combines hard data with qualitative developer feedback
Includes workshops and surveys to understand team challenges
Provides analysis reports with specific recommendations
Custom-built dashboards for your organization's priorities
Balance of standardized metrics and tailored insights
Pros:
Helps drive meaningful transformation, not just measurement
Guidance from people who understand engineering challenges
Real-time tracking focused on what matters to your organization
Supports open source with a free forever plan
Cons:
Historical challenges with language support beyond JS/Ruby
Scoring approach may feel stringent compared to other tools
Requires commitment to setup process for maximum value
Pricing:
Open source projects: Forever free
Starting up: Free for very small teams (up to 4 people)
Established teams: $16.67-$20/seat monthly (based on billing)
Integrations:
Tight GitHub integration for PR workflows
Works with Jira and similar tools
Automated code quality and test coverage analysis
11. Haystack: Making Standups Suck Less Since 2018
"I hate standups," said every developer ever. Haystack built their platform specifically to tackle that pain point, with a promise: effective standups in just 10 seconds.
By automatically gathering progress data, they turn the dreaded daily meeting into a painless check-in that actually adds value.
Key Features:
Team health insights that show who's struggling before it's a crisis
Early warning alerts for projects slipping off track
AI that generates release notes from your commit messages
Epic tracking that prevents last-minute roadmap surprises
Flexible reporting across your Git and Jira information
Pros:
Full coverage of all four DORA metrics without extra work
Completely customizable reporting for different stakeholders
Daily insights that catch problems before they grow
Seamless connection to the tools developers already use
Setup so simple it almost feels suspicious
Cons:
Their deployment and failure rate calculations have accuracy issues
Recovery time metric buried instead of prominently displayed
Missing deployment feedback developers find helpful
Individual metrics enabled by default (potentially problematic)
Lacks native integrations with CI/CD and monitoring
DORA metrics feel like a side feature, not the main event
Pricing:
Free trial available but pricing not publicly disclosed
Integrations:
All major Git providers
Tight Jira integration
GitHub and GitLab support
12. Faros AI
Faros AI distinguishes itself in the crowded DevOps tooling landscape by specializing in accurate attribution and granular metrics, particularly valuable for organizations with complex development environments spanning multiple repositories and pipelines.
Key Features:
Multi-dimensional DORA dashboards (filterable by team, application, product, or repository)
Support for complex engineering environments with multiple pipelines
Accurate attribution of metrics across diverse development processes
Granular data that helps pinpoint specific improvement areas
Pros:
Exceptional precision with metrics in complex environments
Minimal disruption to existing workflows during implementation
Root cause identification capabilities for performance bottlenecks
Democratic approach with open-source community option
Cons:
Feature richness might exceed needs of small, simple teams
Initial configuration requires thoughtful setup time
Learning curve steeper than simpler alternatives
Pricing:
Community Edition: Free (open-source)
Professional: $29 per contributor monthly (annual billing)
Enterprise: Custom pricing with advanced features
Ultimate: Custom pricing with full platform capabilities
Integrations:
Version Control: GitHub, GitLab, Bitbucket
CI/CD: Jenkins, CircleCI, GitHub Actions
Project Management: Jira, Azure DevOps
Incident Management: PagerDuty, OpsGenie
13. Waydev

Waydev approaches DORA metrics as part of broader engineering intelligence, helping managers understand not just deployment statistics but how they connect to overall development effectiveness.
Key Features:
Unified DORA metrics dashboard with customizable views
Automated data collection from CI/CD pipelines
Flexible definitions for deployments and failures to match team processes
Comprehensive tracking across all four core DORA metrics
Historical trend analysis and benchmarking
Pros:
Intuitive interface designed specifically for engineering leaders
Adaptable to different development workflows
Strong visualization capabilities for presenting metrics to stakeholders
Minimal maintenance once configured
Cons:
Setup requires clear definition of what constitutes "deployments" and "failures"
Limited customization compared to more technical platforms
Potentially overwhelming amount of data for teams new to metrics
Pricing:
Pro: $29 per active contributor monthly (annual billing)
Premium: $54 per active contributor monthly (annual billing)
Enterprise: Custom pricing with advanced security and support
Integrations:
Version Control: GitHub, GitLab, Bitbucket
CI/CD: Jenkins, CircleCI, GitHub Actions
Communication: Slack, Microsoft Teams
Project Management: Jira, Asana
14. Uplevel
What separates Uplevel from other DORA tools is its focus on connecting technical metrics with human factors like burnout risk and time allocation, creating a more holistic view of engineering health.
Key Features:
Standard DORA metrics tracking with team-level breakdowns
Time allocation analysis (new features vs. maintenance work)
Burnout risk quantification using composite data points
Deep work measurement and interruption tracking
Meeting load and context switching metrics
Pros:
Connects technical performance with team wellbeing
Highlights potential sustainability issues before they impact delivery
Provides insight into where engineering time actually goes
Helps identify process inefficiencies beyond just deployment statistics
Cons:
More complex implementation than pure DORA metrics tools
Higher cost justified by broader feature set
Requires buy-in across engineering leadership to be effective
Pricing:
Custom pricing based on organization size and needs
Typically requires annual commitment
Integrations:
Version Control: GitHub, GitLab
Project Management: Jira
Communication: Slack, Microsoft Teams, Google Calendar
CI/CD: Various tools through custom integration
15. CircleCI: CI Pioneer Supporting DORA Analytics
While not a dedicated DORA platform, CircleCI provides the foundational pipeline data that forms the backbone of comprehensive DORA metrics, with evolving capabilities for engineering insights.
Key Features:
Robust CI/CD pipeline execution and management
Insights dashboard showing pipeline duration and success rates
Support for multiple version control systems and programming languages
Performance tracking across builds and tests
Parallelization for faster feedback cycles
Pros:
Exceptional reliability for core CI/CD functions
Detailed pipeline performance metrics
Flexible integration with visualization and analytics tools
Supports distributed testing for faster cycles
Cons:
Requires additional tooling for complete DORA metrics coverage
Not a full-featured DORA analytics platform on its own
Needs integration work to correlate with incident data
Pricing:
Free: $0 for limited usage
Performance: Starting at $39 per month
Scale: Starting at $99 per month
Enterprise: Custom pricing for advanced needs
Integrations:
Version Control: GitHub, Bitbucket, GitLab
Communication: Slack, MS Teams, Email notifications
Project Management: Jira, Asana
Security: Various security scanning tools
16. Pluralsight Flow
Pluralsight Flow takes a sophisticated approach to DORA metrics, treating them as part of a comprehensive engineering analytics strategy with customization options for enterprise needs.
Key Features:
Highly customizable DORA metrics configuration
Lightweight signal collection via git tags and ticket filters
Deep analysis capabilities for bottleneck identification
Exceptional-grade security and access controls
Pros:
Advanced filtering and segmentation
Sophisticated bottleneck-detection algorithms
Designed for complex, multi-team environments
Cons:
Implementation complexity higher than simpler solutions
Premium pricing model not suited for smaller teams
Requires proper configuration to deliver maximum value
Pricing:
Custom pricing tailored to organization size and requirements
Typically follows enterprise software pricing models
Integrations:
Version Control: GitHub, GitLab, BitBucket
Project Management: Jira, Azure DevOps
Communication: Slack, Microsoft Teams
CI/CD: Jenkins, CircleCI, GitHub Actions
How to Choose the Right DORA Metrics Tool for Your Team
Picking the right DORA metrics tool isn't just about finding the most feature-packed option, it's about choosing what actually works for your team's size, workflow, and goals.
Here's how to make the smartest choice:
1. Identify Your Team's Needs
Before jumping into tools, define what success looks like for your team:
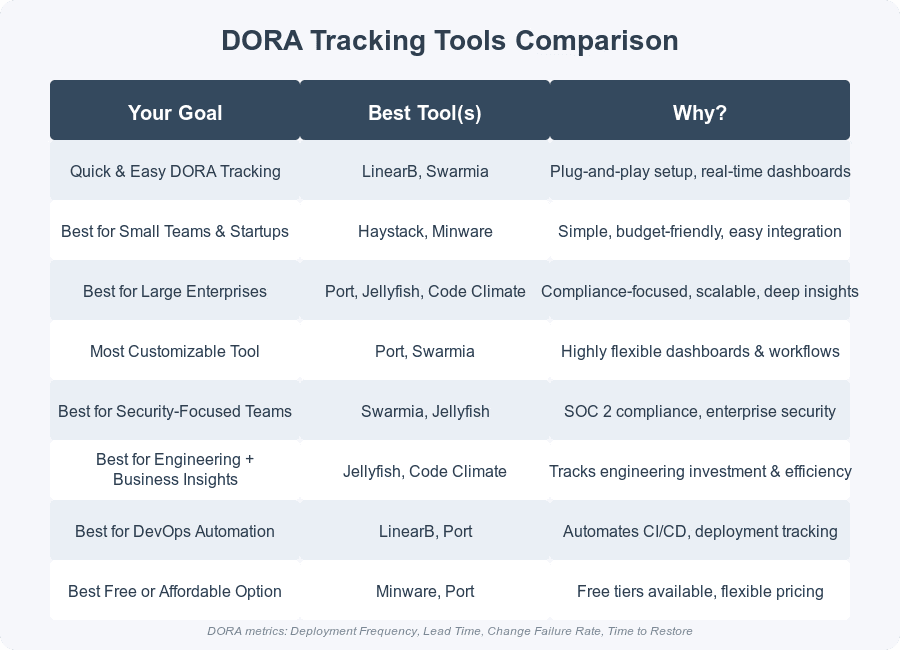
Are you struggling with slow deployments? → Pick a tool that focuses on Deployment Frequency and Lead Time (like LinearB or Swarmia).
Too many failed releases or long downtimes? → Choose a tool that tracks Change Failure Rate and MTTR (like Jellyfish or Port).
Drowning in manual reporting? → Choose a fully automated tool with built-in alerts and reporting (like LinearB or Code Climate).
Tight on budget? → Look at free or affordable options like Minware, Port (free tier), or Code Climate (open-source plan).
Need deep insights & business alignment? → A tool like Jellyfish will help align engineering work with company goals.
Want to automate everything? → LinearB and Port integrate deeply with CI/CD and Slack to reduce manual work.
ACTION STEP: Write down your top 2-3 priorities (e.g., speed up deployments, reduce failures, automate reporting). This will help you filter tools fast.
2. Compare Tools Based on Your Top 2-3 Priorities
Use this table to quickly find the best match for your team:
Conclusion: Boost Your DevOps Performance Beyond DORA Metrics
DORA metrics give you the compass for faster, safer software delivery. But they won’t repair slow pipelines or catch bad code on their own. The next leap comes from embedding AI-driven code quality into your workflow. CodeAnt.ai integrates directly with Azure DevOps to add automated quality gates, security scanning, and one-click fixes that cut failure rates and shorten lead times.
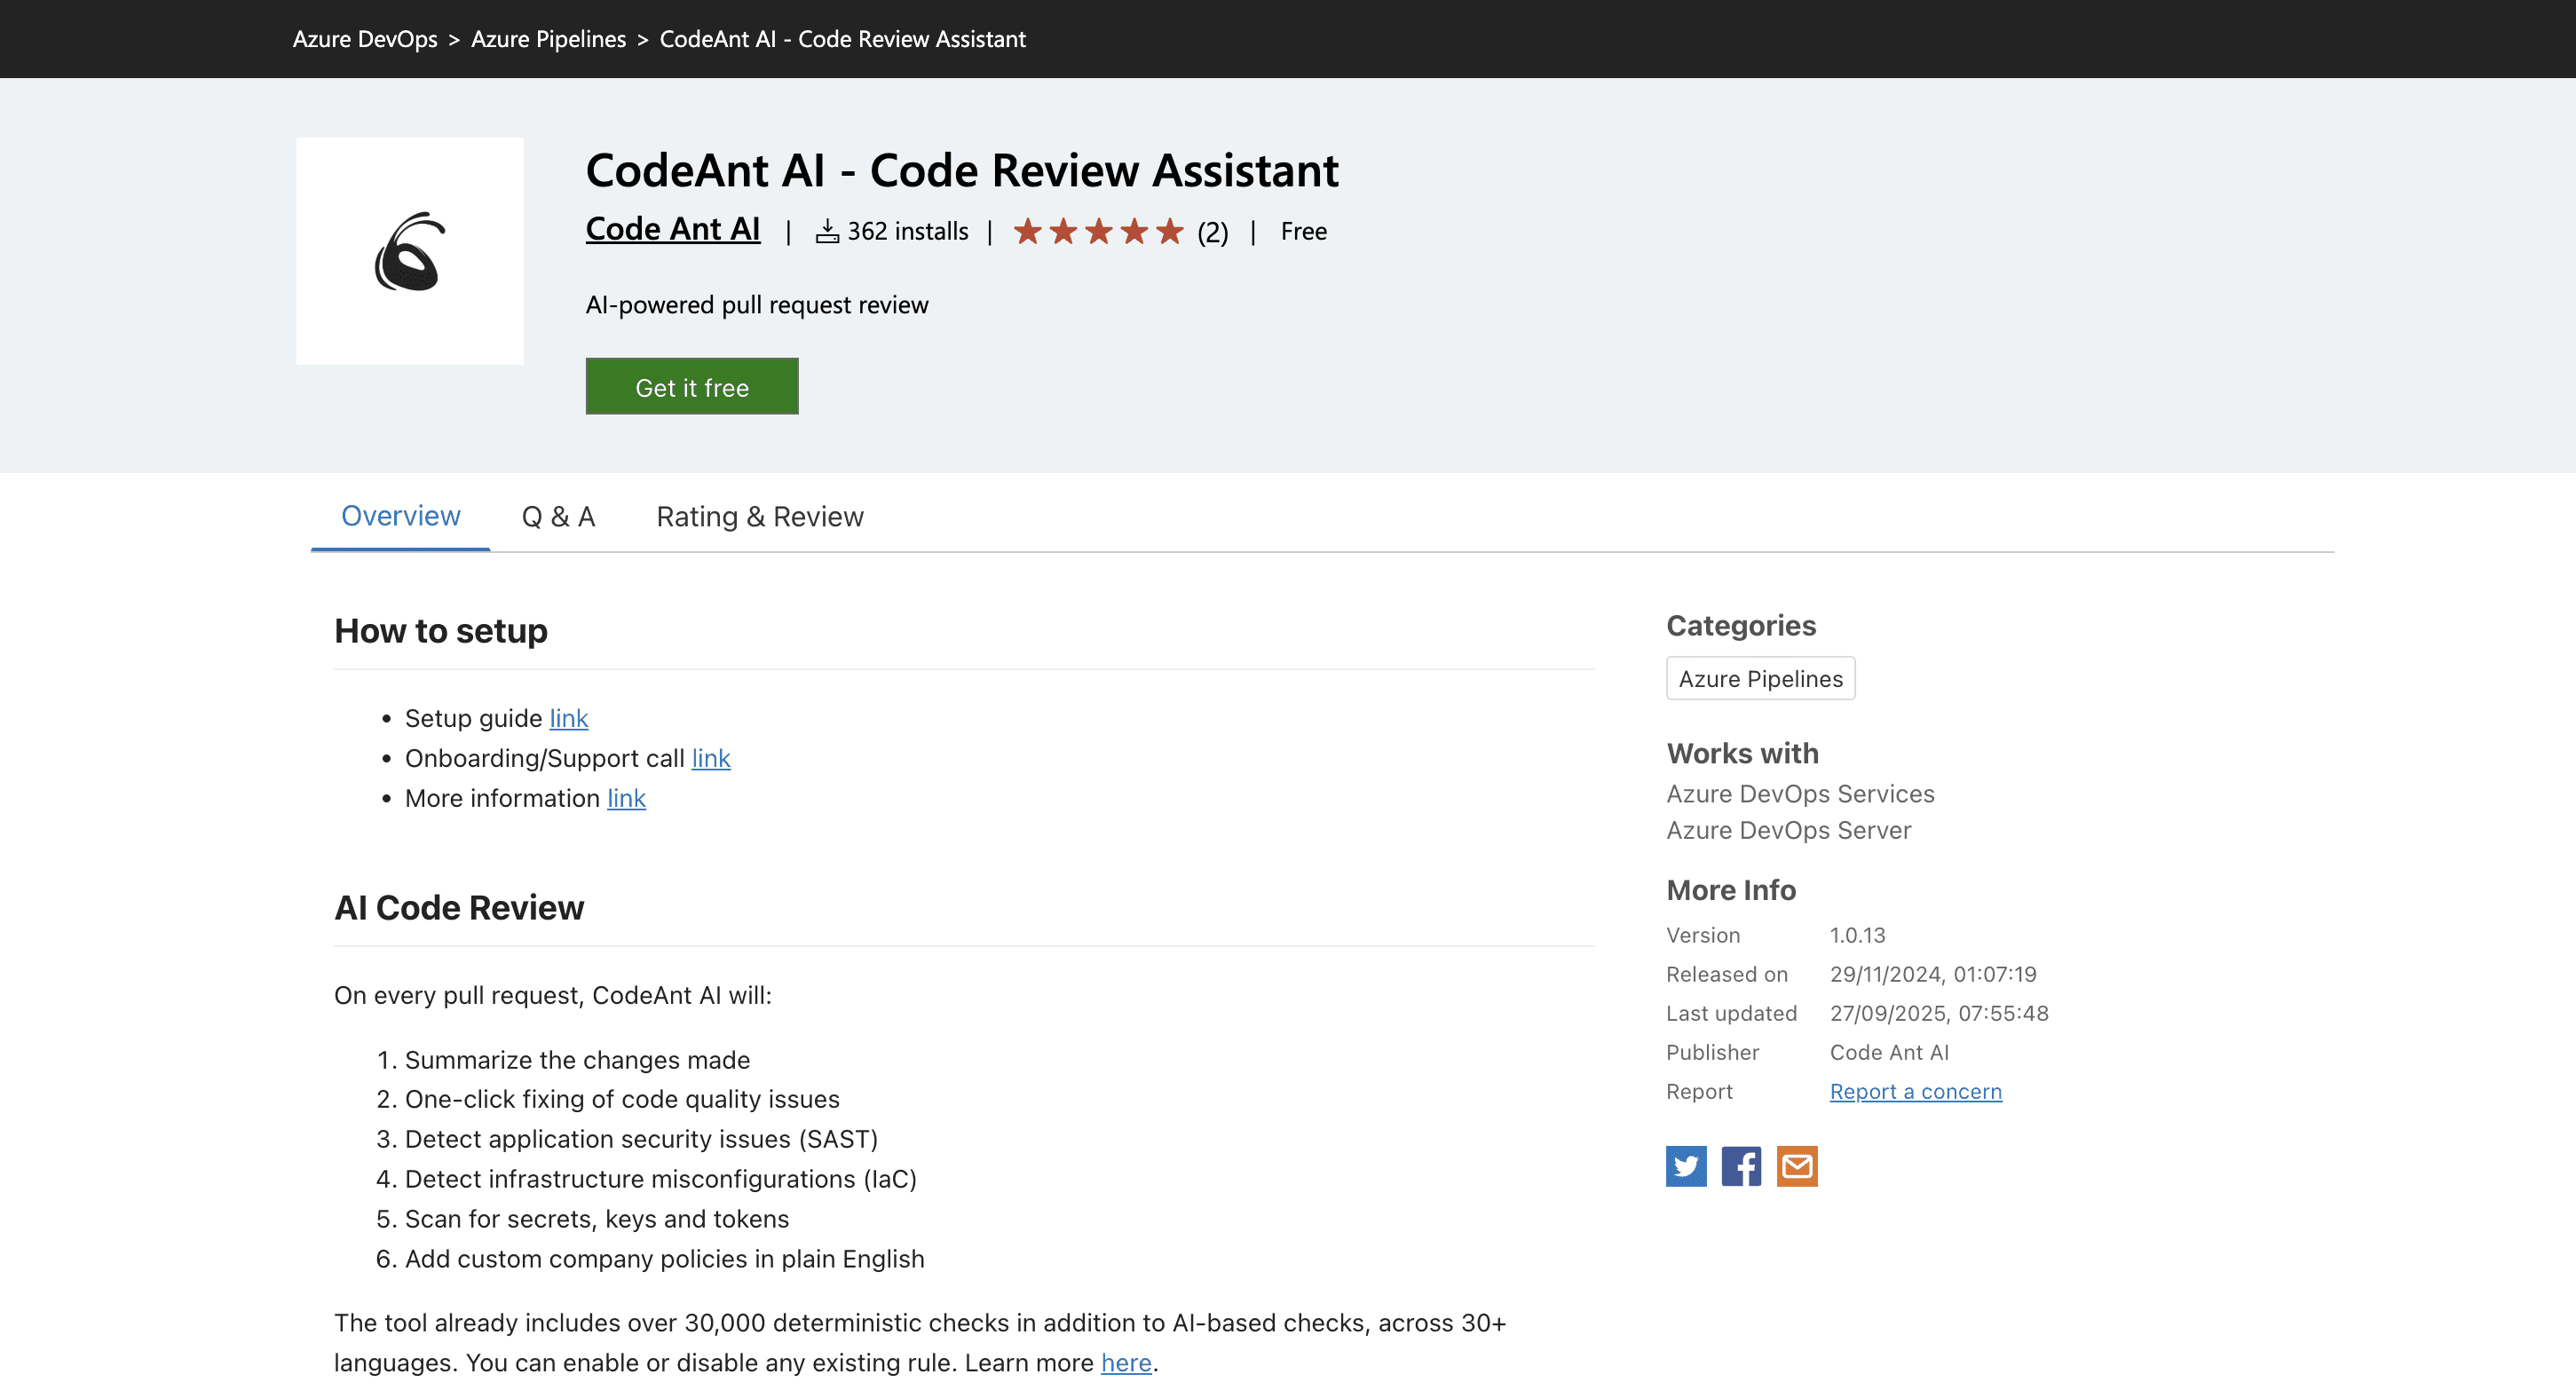
In other words, DORA metrics show you where you’re losing speed; CodeAnt.ai helps you fix it. So, from now stop staring at dashboards. Start fixing what’s broken. 🔥
Fix Code → Fix DORA | Talk to an Expert
FAQs
How do DORA metrics improve DevOps performance?
Why should I use a DORA metrics tool instead of manual tracking?
How does CodeAnt.ai help improve DORA metrics inside Azure DevOps?
Can small teams benefit from DORA metrics and AI code reviews?
Are DORA metrics and CodeAnt.ai’s insights limited to Azure DevOps?


