AI Code Review
Good vs Bad Technical Debt: Frameworks, Examples, and How to Manage It

Sonali Sood

Founding GTM, CodeAnt AI
Technical debt is now a fact of life in modern software teams, but not all technical debt is equal.
Consider the current reality:
62.4% of developers (Stack Overflow 2024) say technical debt is their #1 source of workplace frustration
CIOs estimate that 20-40% of tech estate value is lost to technical debt
Engineers spend 33-40% of their time on avoidable rework tied to poor code quality and legacy decisions
That makes technical debt one of the largest hidden costs in software delivery.
But here’s the nuance most teams miss:
Some technical debt is intentional and strategic
Other debt is accidental, compounding, and destructive
This post breaks down:
What “good” technical debt looks like (and when it makes sense)
How “bad” technical debt quietly slows teams and increases risk
Proven frameworks to evaluate debt, including:
Principal vs interest models
Debt quadrants
Wardley Mapping
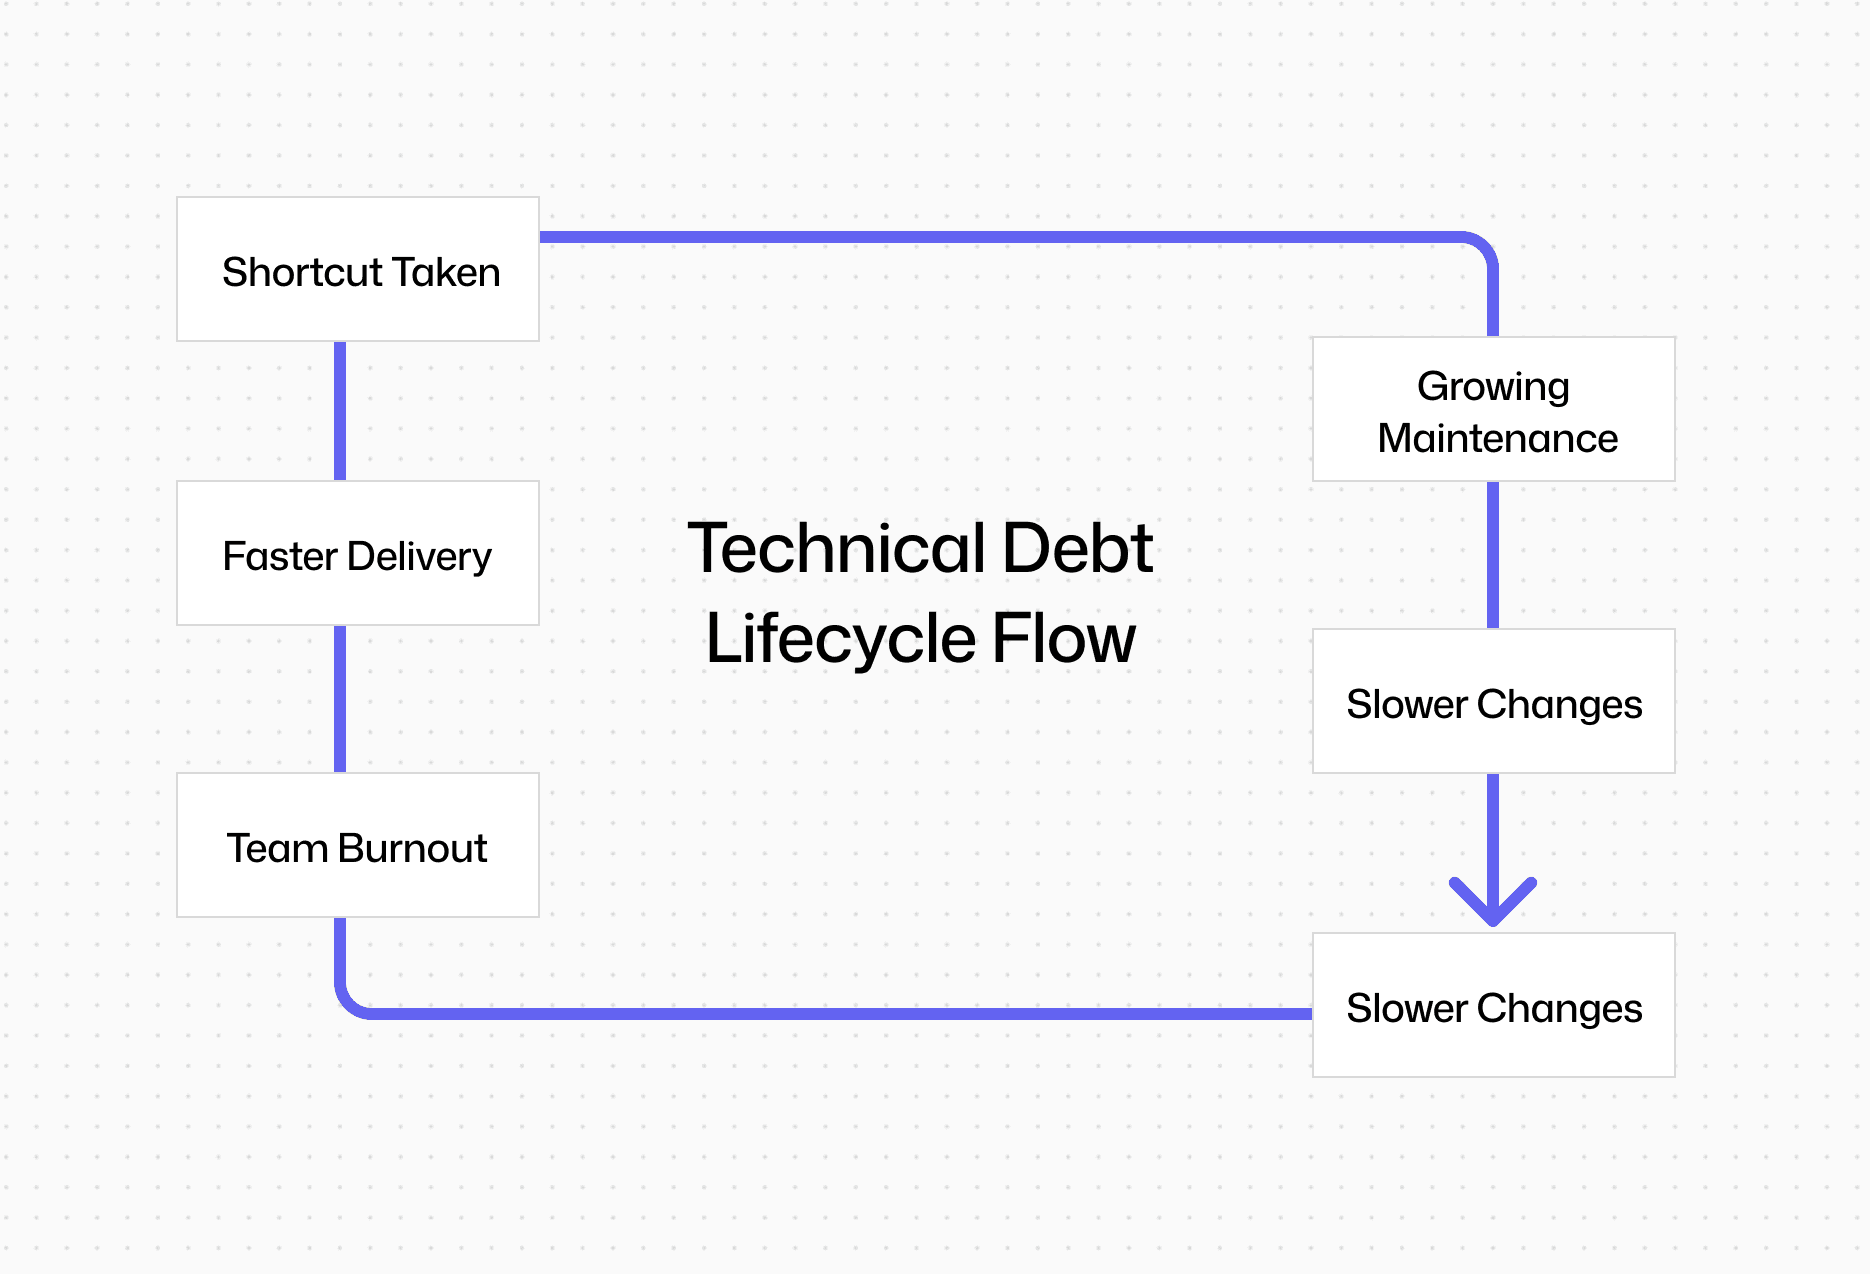
We’ll also explore the real-world cost of unmanaged technical debt:
Rising production incidents
Pull-request churn and review fatigue
Growing developer burnout
Slower shipping velocity
Finally, we’ll show how AI-driven tools help teams:
Automatically score and surface high-risk debt
Flag fragile or unsafe code paths
Prioritize fixes using:
Security posture insights
…so teams can turn technical debt from a silent liability into a strategic advantage.
What Is Technical Debt? (And Why It’s Not All Bad)
Technical debt is a metaphor introduced by Ward Cunningham to describe the trade-off of “ship now, fix later.”
At its core, it means:
You make short-term design or implementation compromises
So you can deliver faster today
At the cost of extra work tomorrow
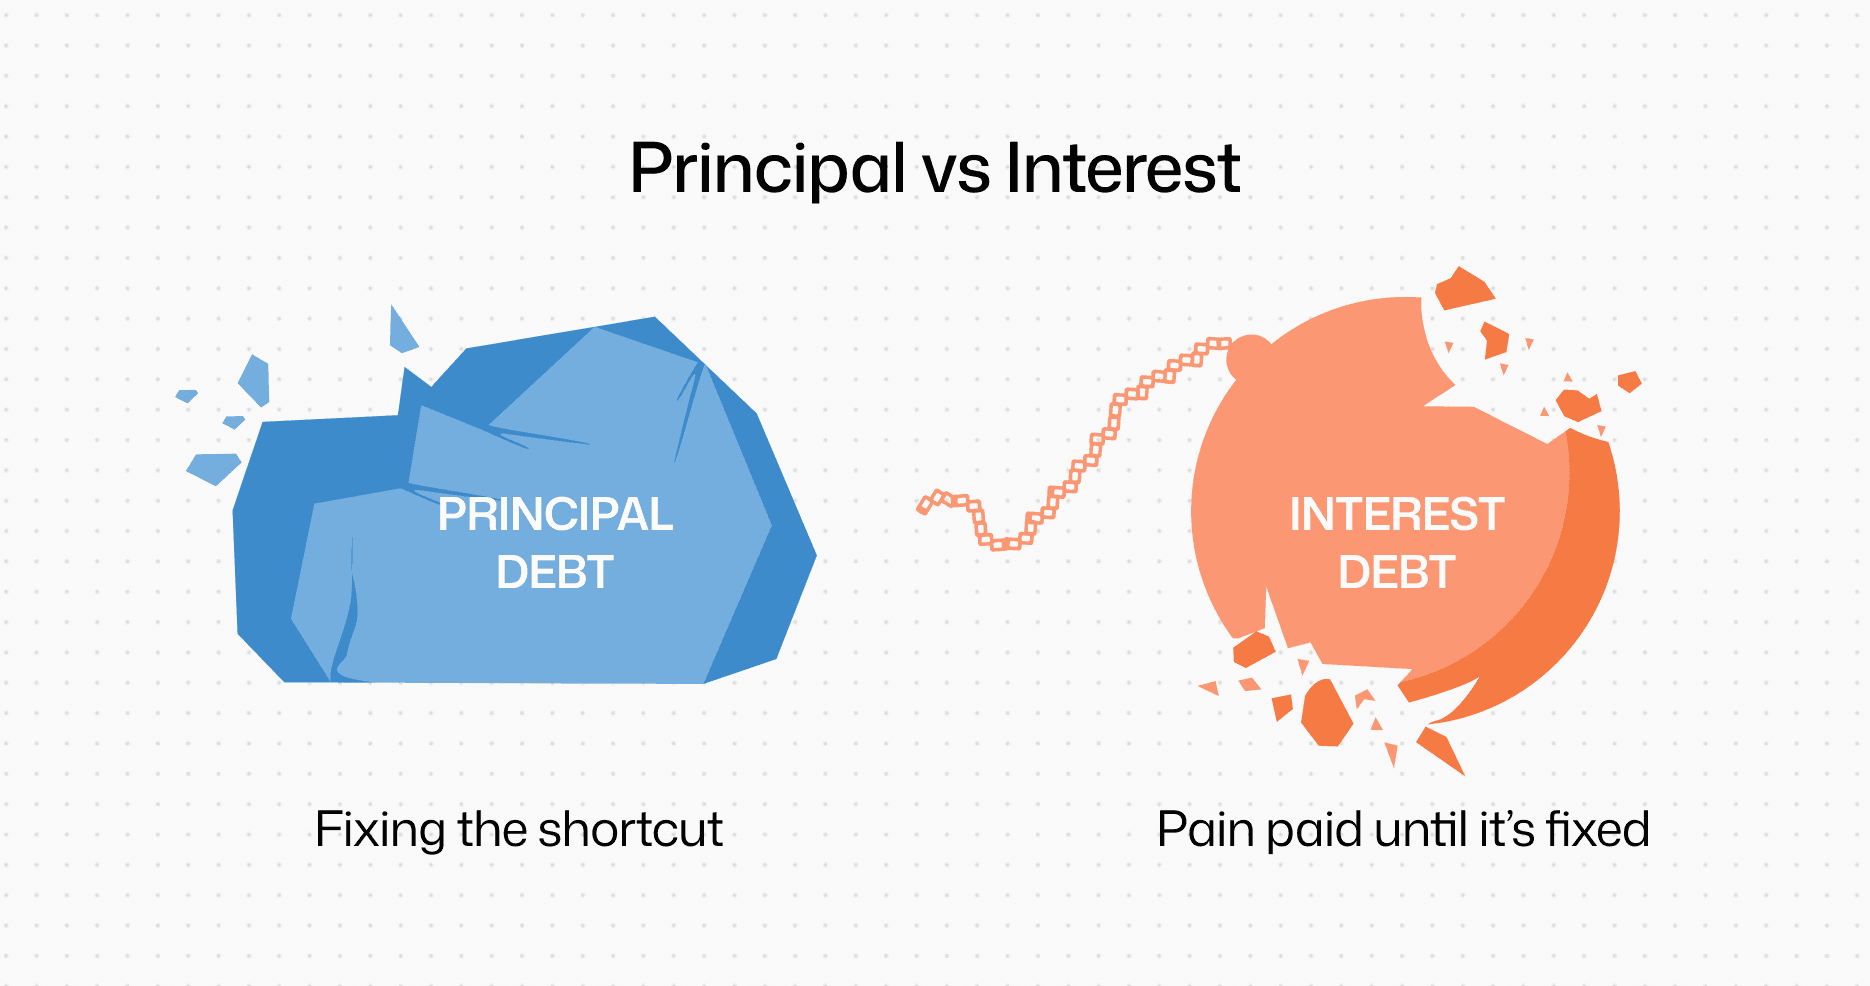
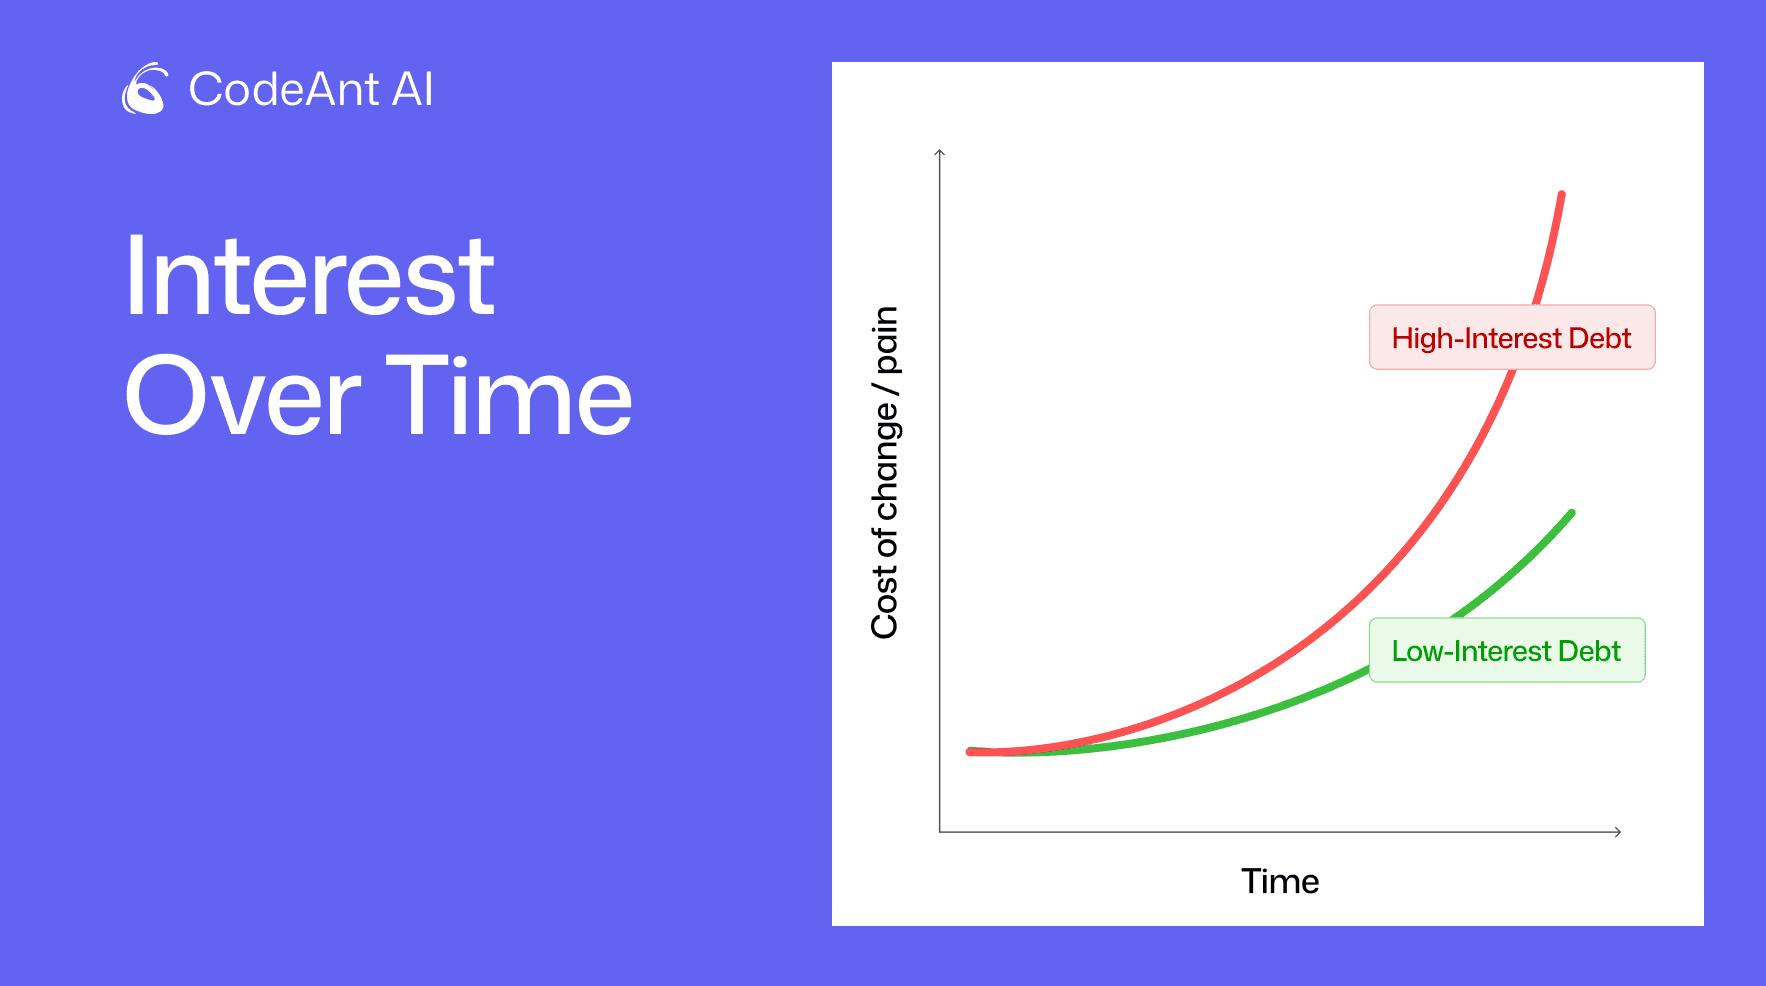
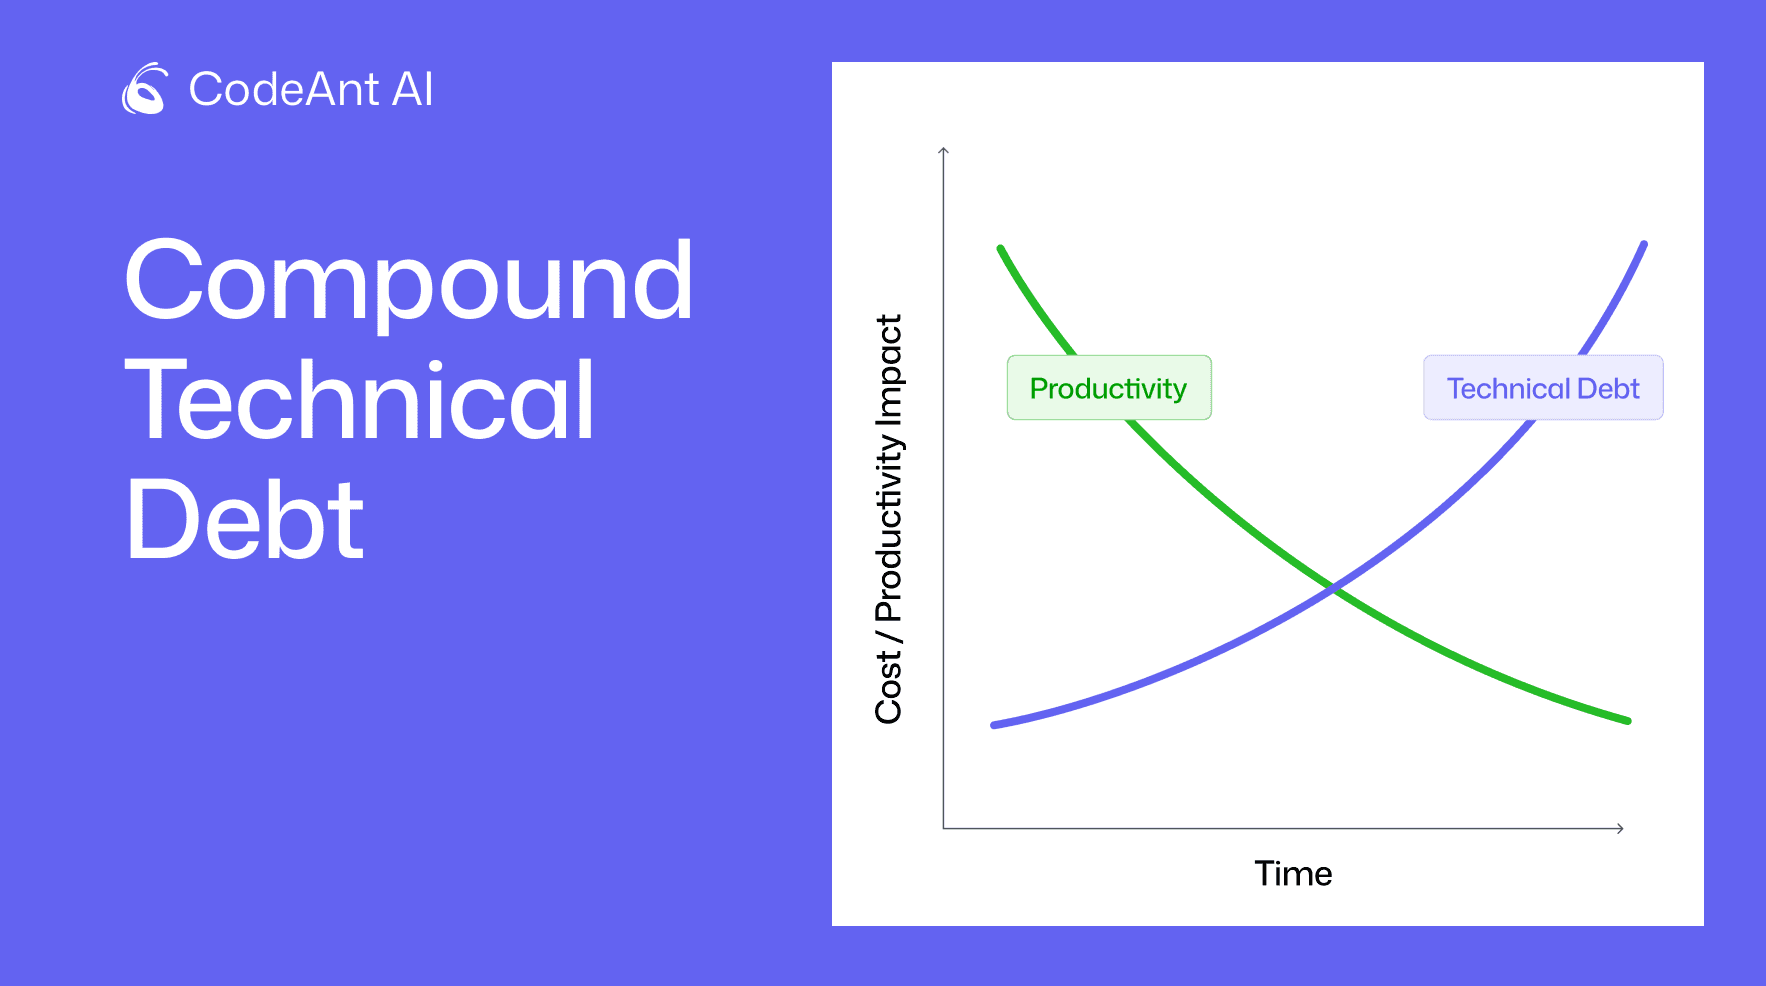
Just like financial debt, technical debt has two components:
Principal → the actual engineering work required to fix the shortcut
Interest → the ongoing cost of not fixing it (bugs, slower changes, unstable systems)
Important distinction:
Technical debt is not inherently bad
It can be strategic and useful when controlled
It becomes dangerous when ignored or unmanaged
Good vs. Bad Technical Debt (Simple Mental Model)
Think of it like finance:
Good debt:
Mortgages
Education loans
Investments that increase long-term value
Bad debt:
High-interest credit cards
Purchases that lose value quickly
The same logic applies to code.
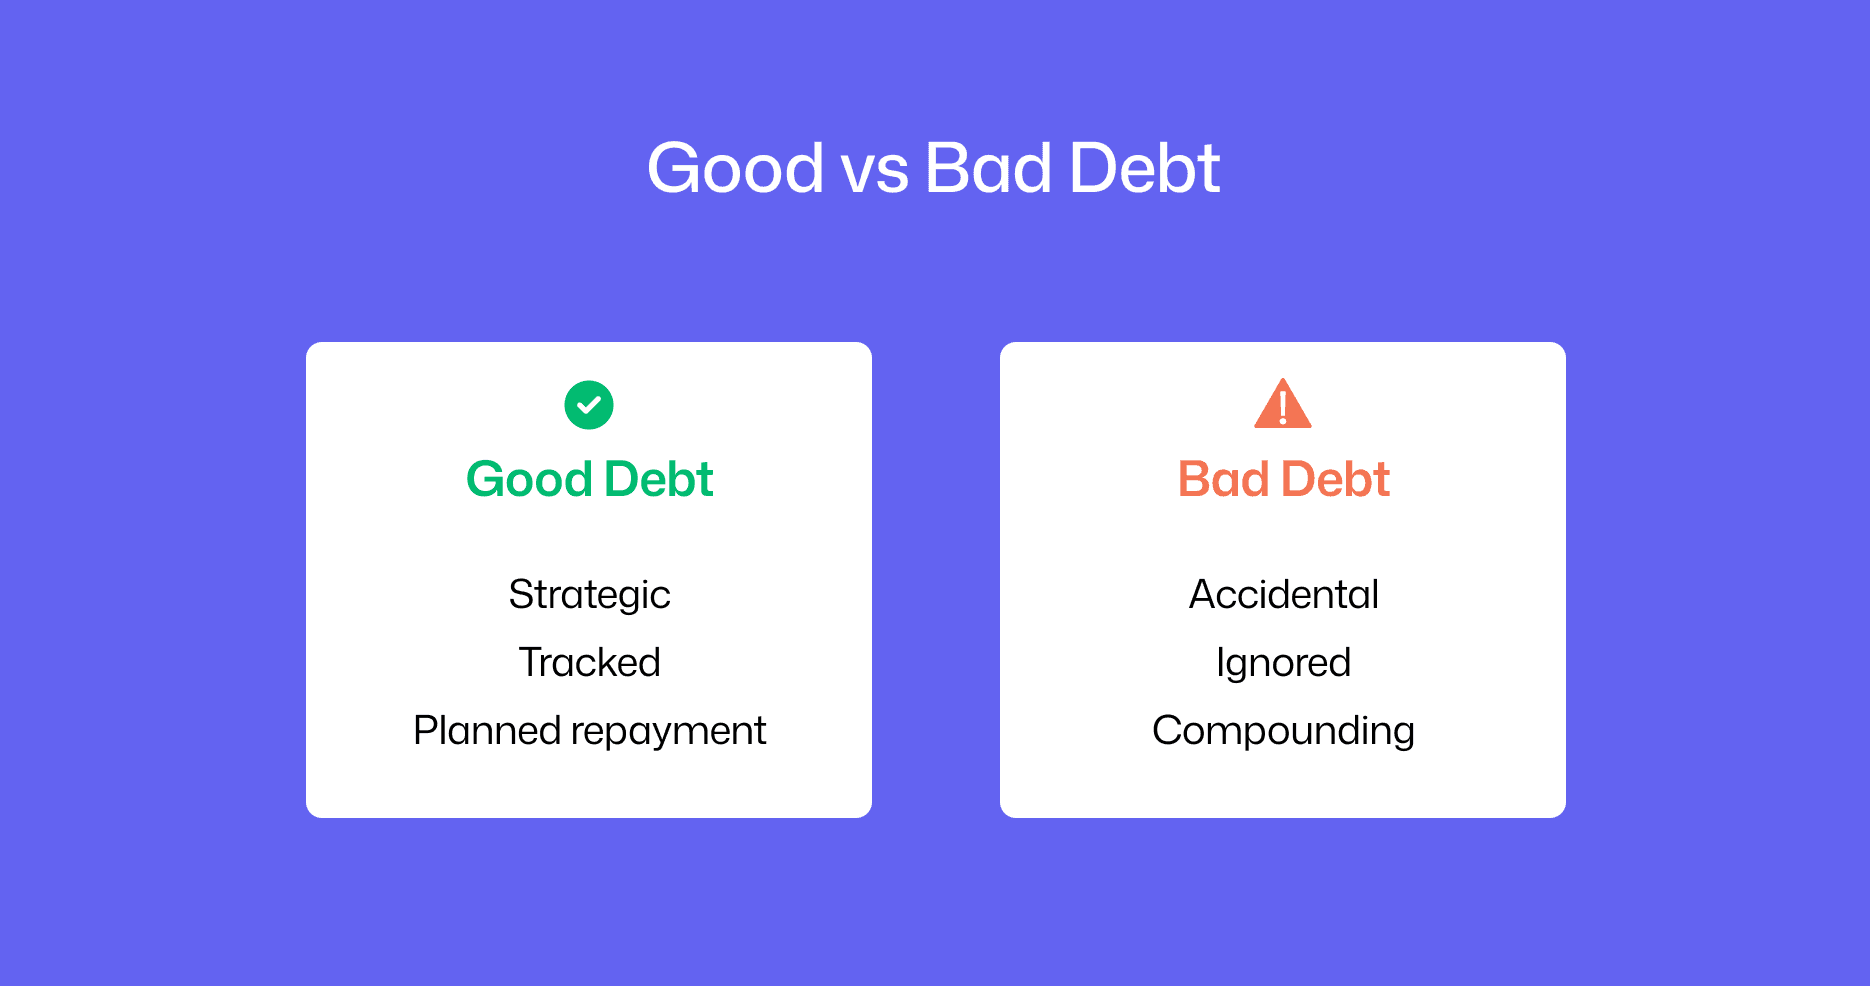
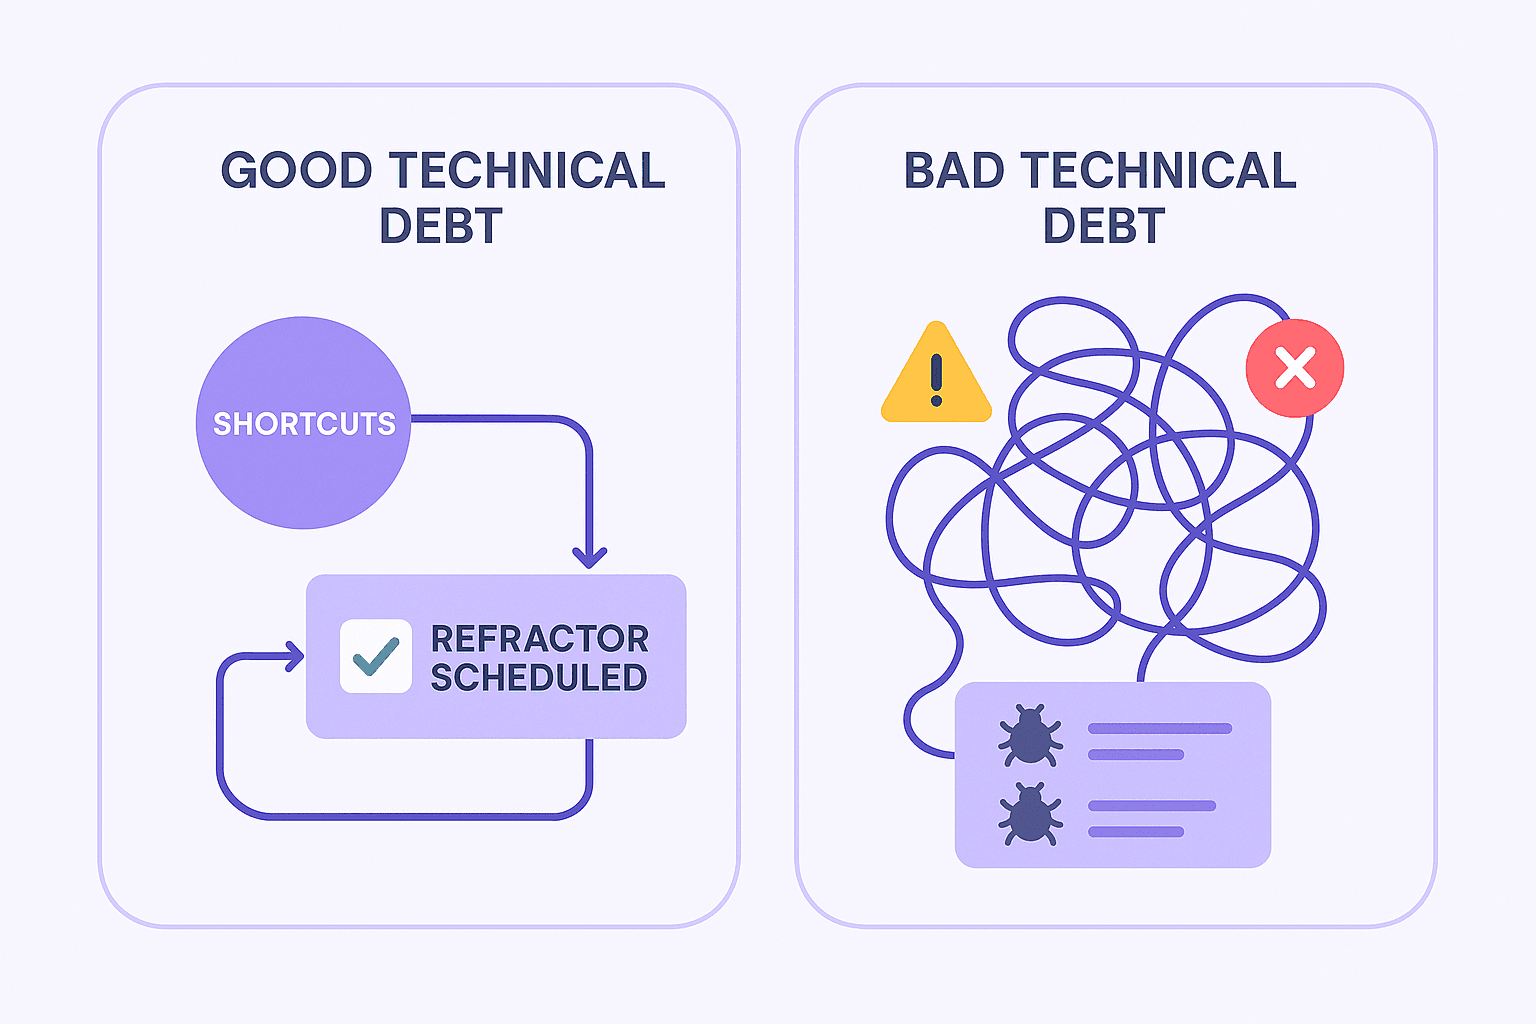
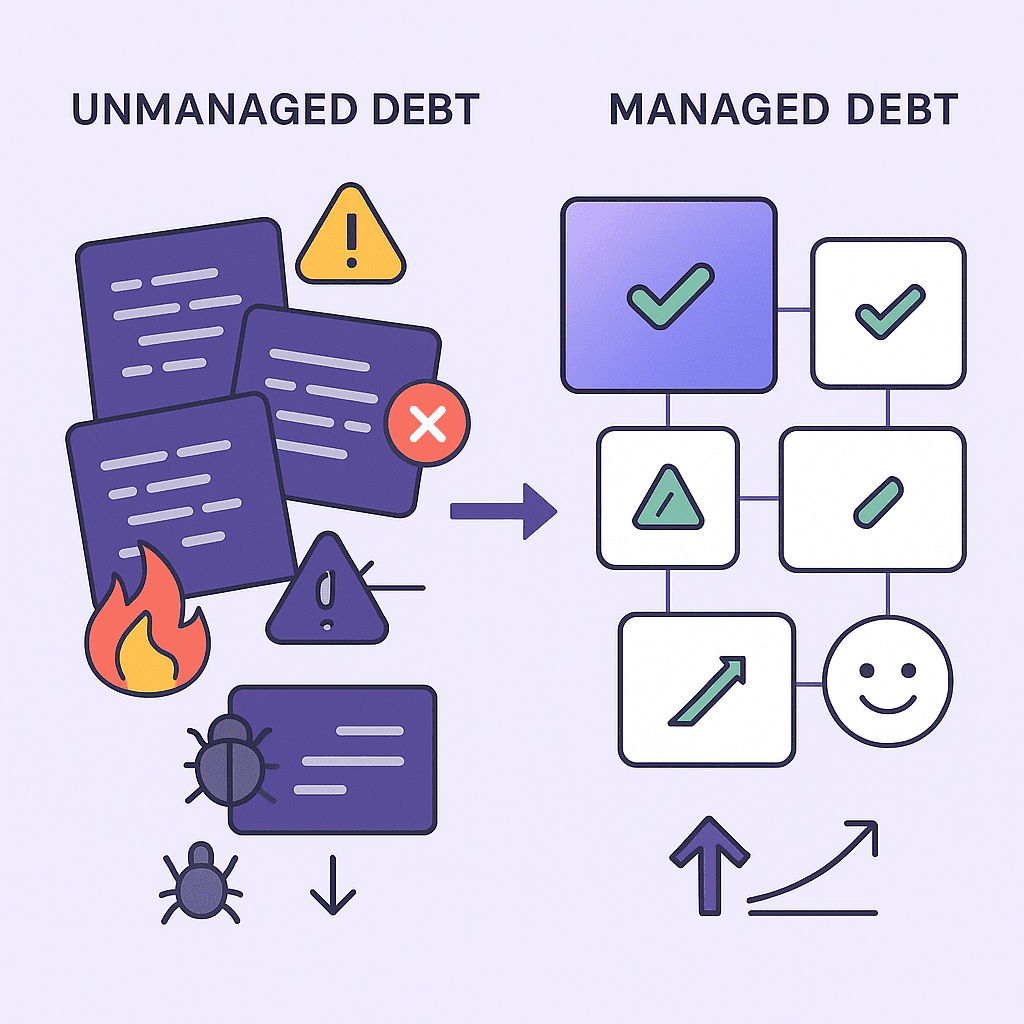
Type | Characteristics |
Good technical debt | Intentional, tracked, value-driven, has a repayment plan |
Bad technical debt | Accidental, untracked, neglected, compounding over time |
Good Technical Debt (Strategic and Intentional)
Good technical debt is an investment in speed and learning.
Teams take it on when they deliberately trade perfection for progress.
Typical examples:
Shipping a bare-bones MVP to validate real customer demand
Launching a scrappy first version to capture early market share
Making temporary architecture trade-offs to meet critical business deadlines
Real-world scenarios:
A startup releases a basic version with known performance limits to test product–market fit, planning refactors after validation
An e-commerce team temporarily denormalizes data to survive Black Friday traffic spikes, with a cleanup plan post-season
What makes it good:
It’s intentional
It’s tracked
It has a clear exit plan (refactor timeline, debt tickets, ownership)
In short: You knowingly “borrow time,” and actively manage the interest.
Bad Technical Debt (Accidental and Compounding)
Bad technical debt is pure liability with no strategic upside.
It usually grows from:
Unplanned shortcuts
Neglect
Lack of ownership
Skill gaps
Schedule pressure with no recovery plan
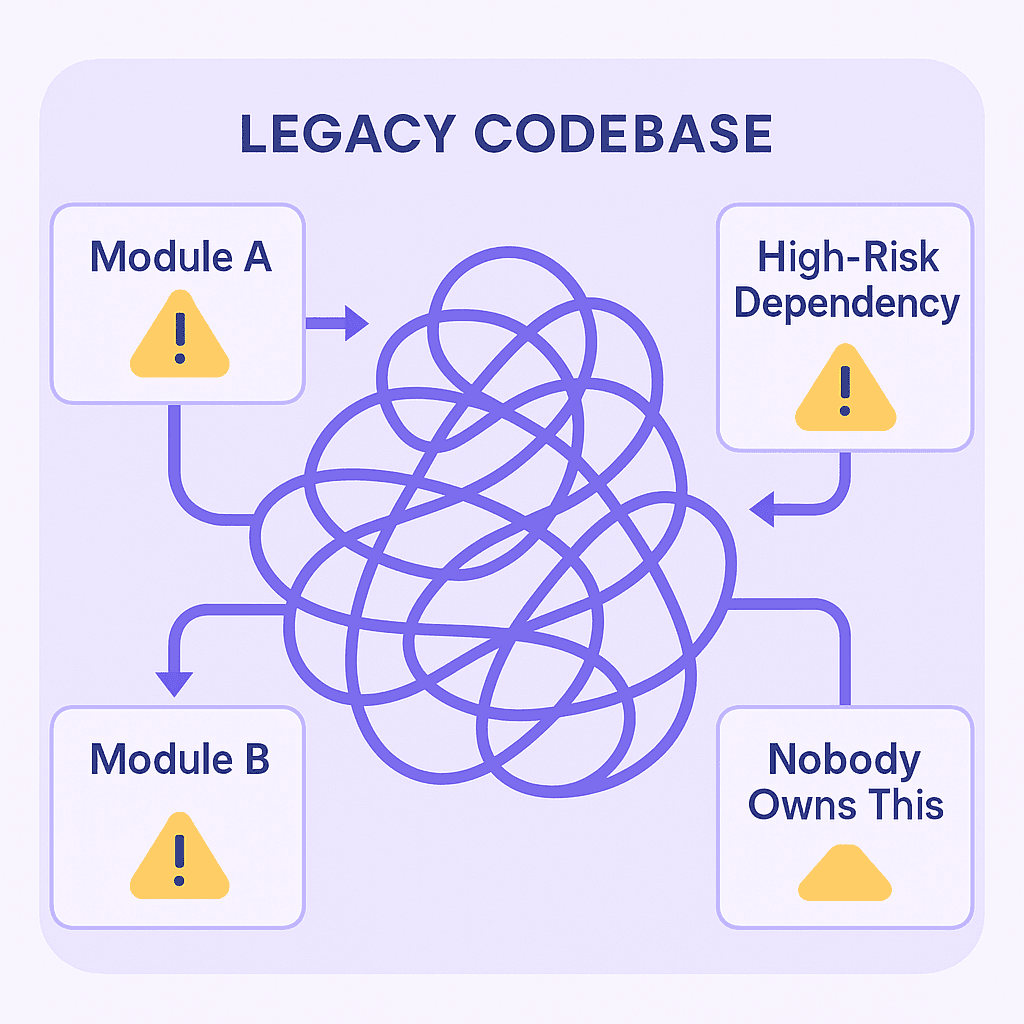
Common patterns:
Fragile legacy codebases that no longer match current business needs
“Quick hacks” that become permanent architecture
Modules with:
No tests
Copy-pasted logic
Stale dependencies
No clear owner
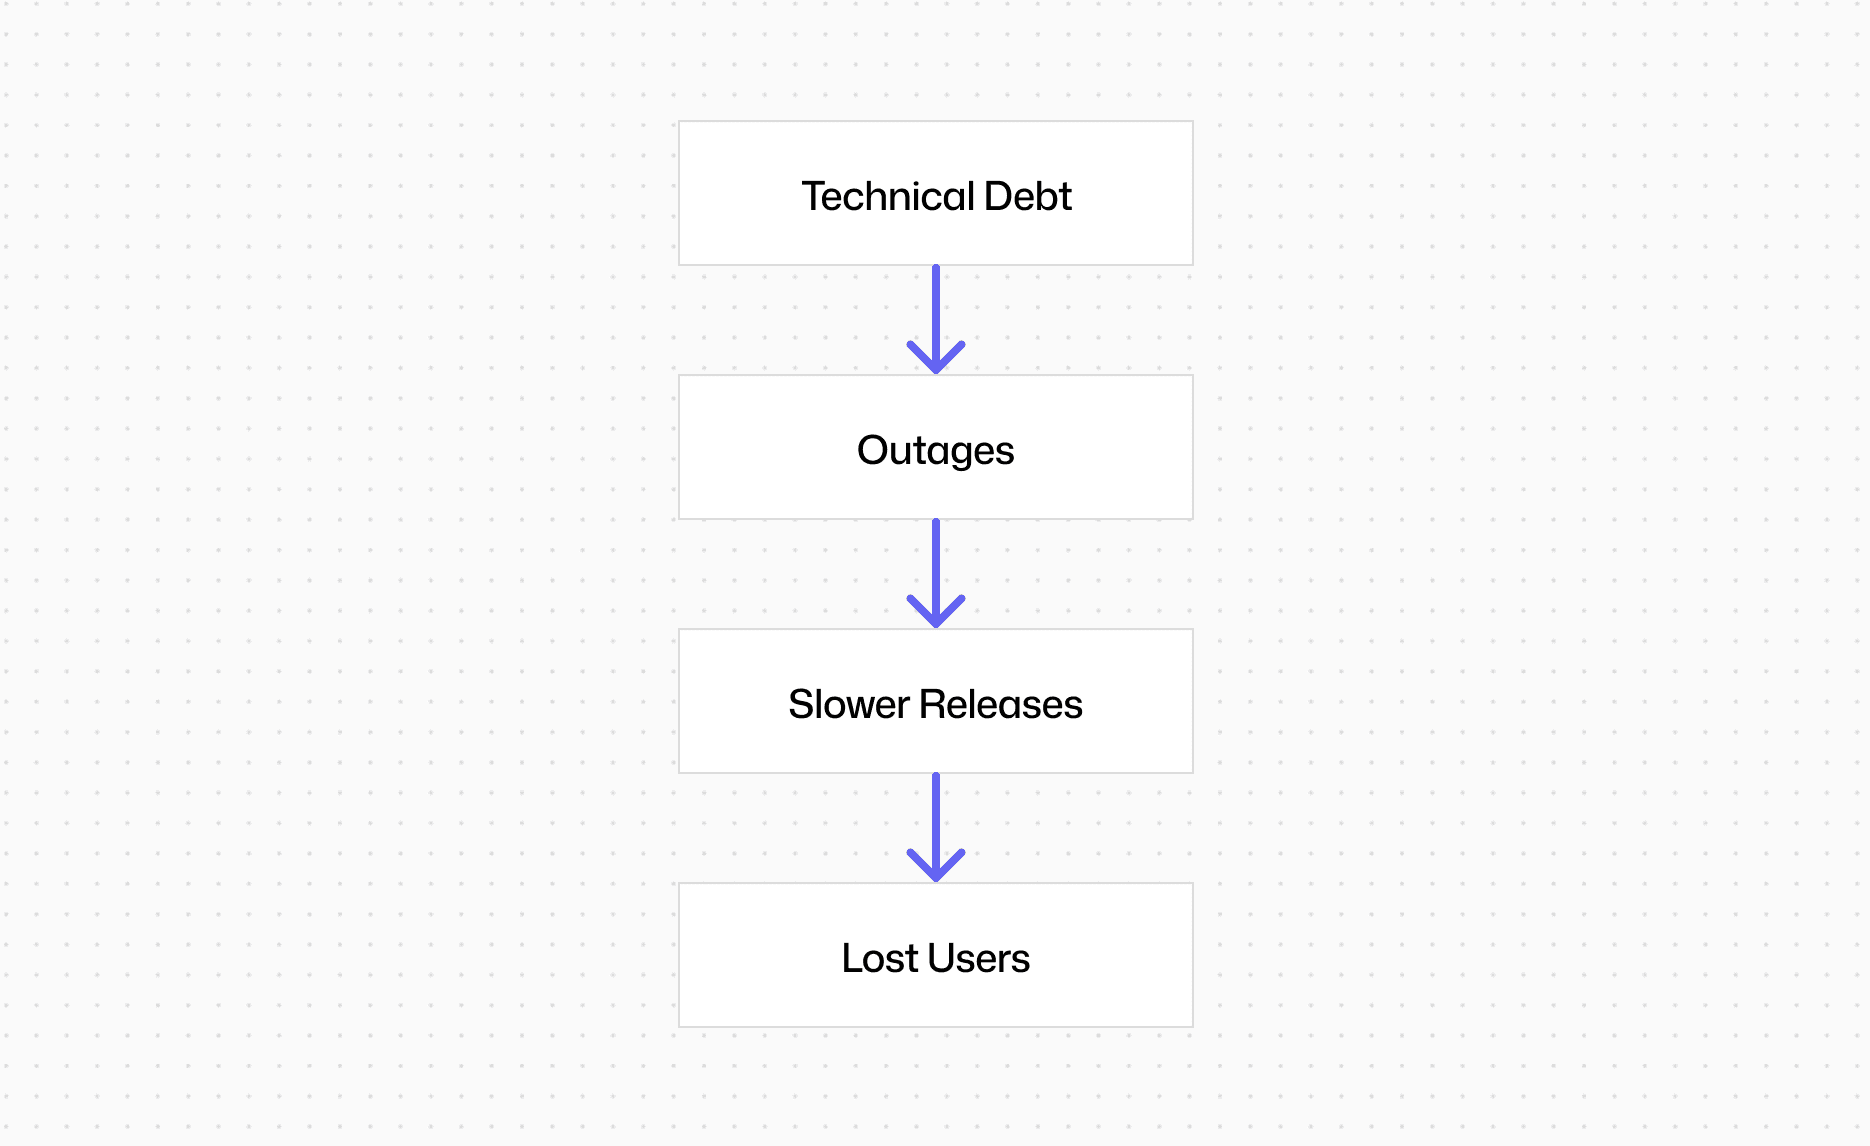
A mission-critical system becomes:
A patchwork of emergency fixes
Brittle and unpredictable
Slowly impossible to change safely
The “interest” shows up as:
Frequent bugs and outages
Security vulnerabilities
Slow PR reviews and constant rework
Burned-out engineers
Declining delivery speed
Bad technical debt is usually:
Reckless → knowingly cutting corners with no plan
Inadvertent → teams don’t even realize they’re building on a fragile foundation
The Core Difference (In One Simple Rule)
Good Debt | Bad Debt |
Clear short-term business value | Little or no real value |
Taken with eyes open | Accidental or ignored |
Tracked and managed | Untracked and compounding |
Has a repayment plan | No clear ownership or timeline |
Or as engineering leaders often describe it:
Good technical debt is like a mortgage: you gain real value today and pay it down steadily.
Bad technical debt is like high-interest credit: pain now, pain later, and no lasting upside.
Frameworks for Evaluating Technical Debt (Principal, Quadrants, and Mapping)
How can teams tell good debt from bad debt, and know when to “borrow” versus when to pay down?
Over time, engineers and industry thinkers have developed practical frameworks to bring structure to these decisions. The most useful modern ones include:
The Principal + Interest model
Technical Debt Quadrants
Wardley Mapping
Each of these helps teams understand:
The nature of a debt
Its true cost over time
And its long-term impact on product velocity and risk
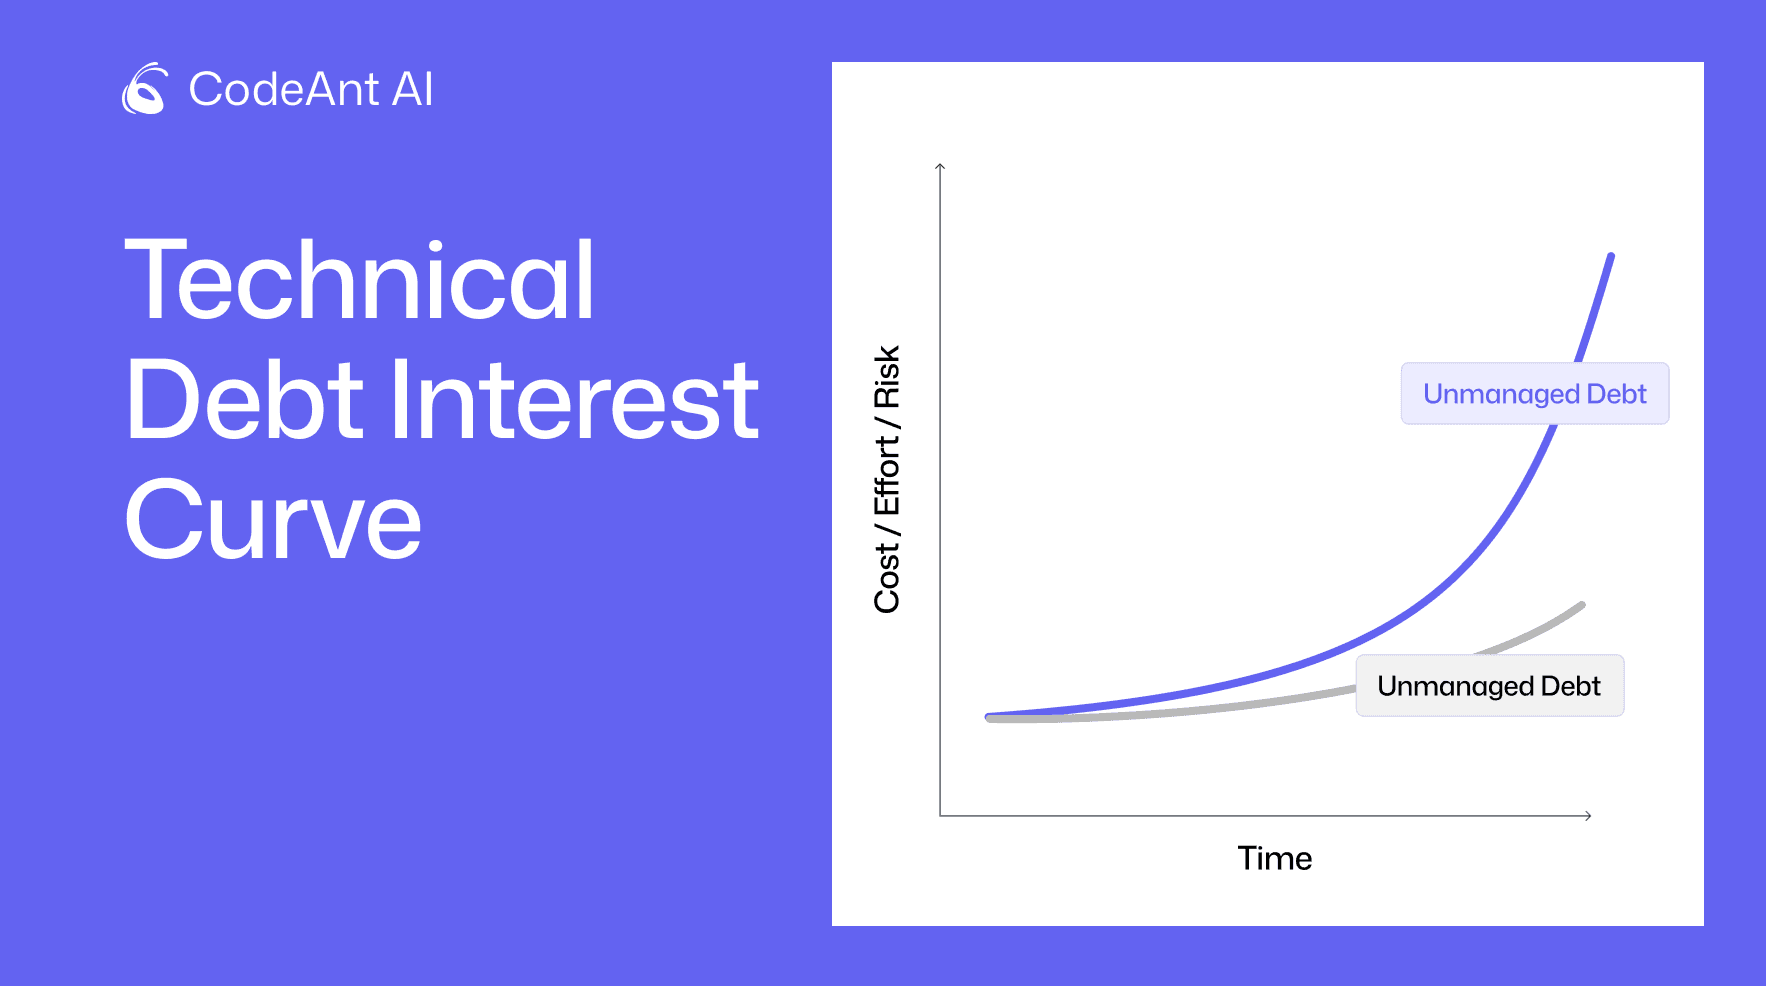
1. The Principal & Interest Model
This model mirrors financial debt.
Principal → the one-time work needed to fix the shortcut
Interest → the recurring pain you experience until it’s fixed
This forces teams to think in ROI terms instead of vague engineering intuition.
Examples:
Skipping unit tests:
Saves ~1 week now (principal)
Costs hours of debugging + regression bugs later (interest)
Quick hack in a low-traffic area:
Low impact
Low interest
Can be safely carried longer
Messy core module:
High churn
Constant hotfixes
High developer time loss → Crippling interest
Key mental shift this model creates: “We’re not asking whether this is bad, we’re asking how expensive the interest is.”
How Modern Teams Apply This
High-maturity orgs attempt to measure interest rates.
For example:
Google surveys engineers quarterly to measure:
How much tech debt slows them down
Where the worst friction lives
Their findings consistently highlight high-interest areas like:
Missing documentation
Low test coverage
Outdated libraries
And importantly:
No single metric predicts tech debt perfectly
“Interest” often shows up as subjective developer pain
Practical proxy signals teams can track:
Defect density
Incidents and rollbacks
Deployment friction
Code churn rates
When interest becomes higher than the original speed gain → the debt has turned bad.
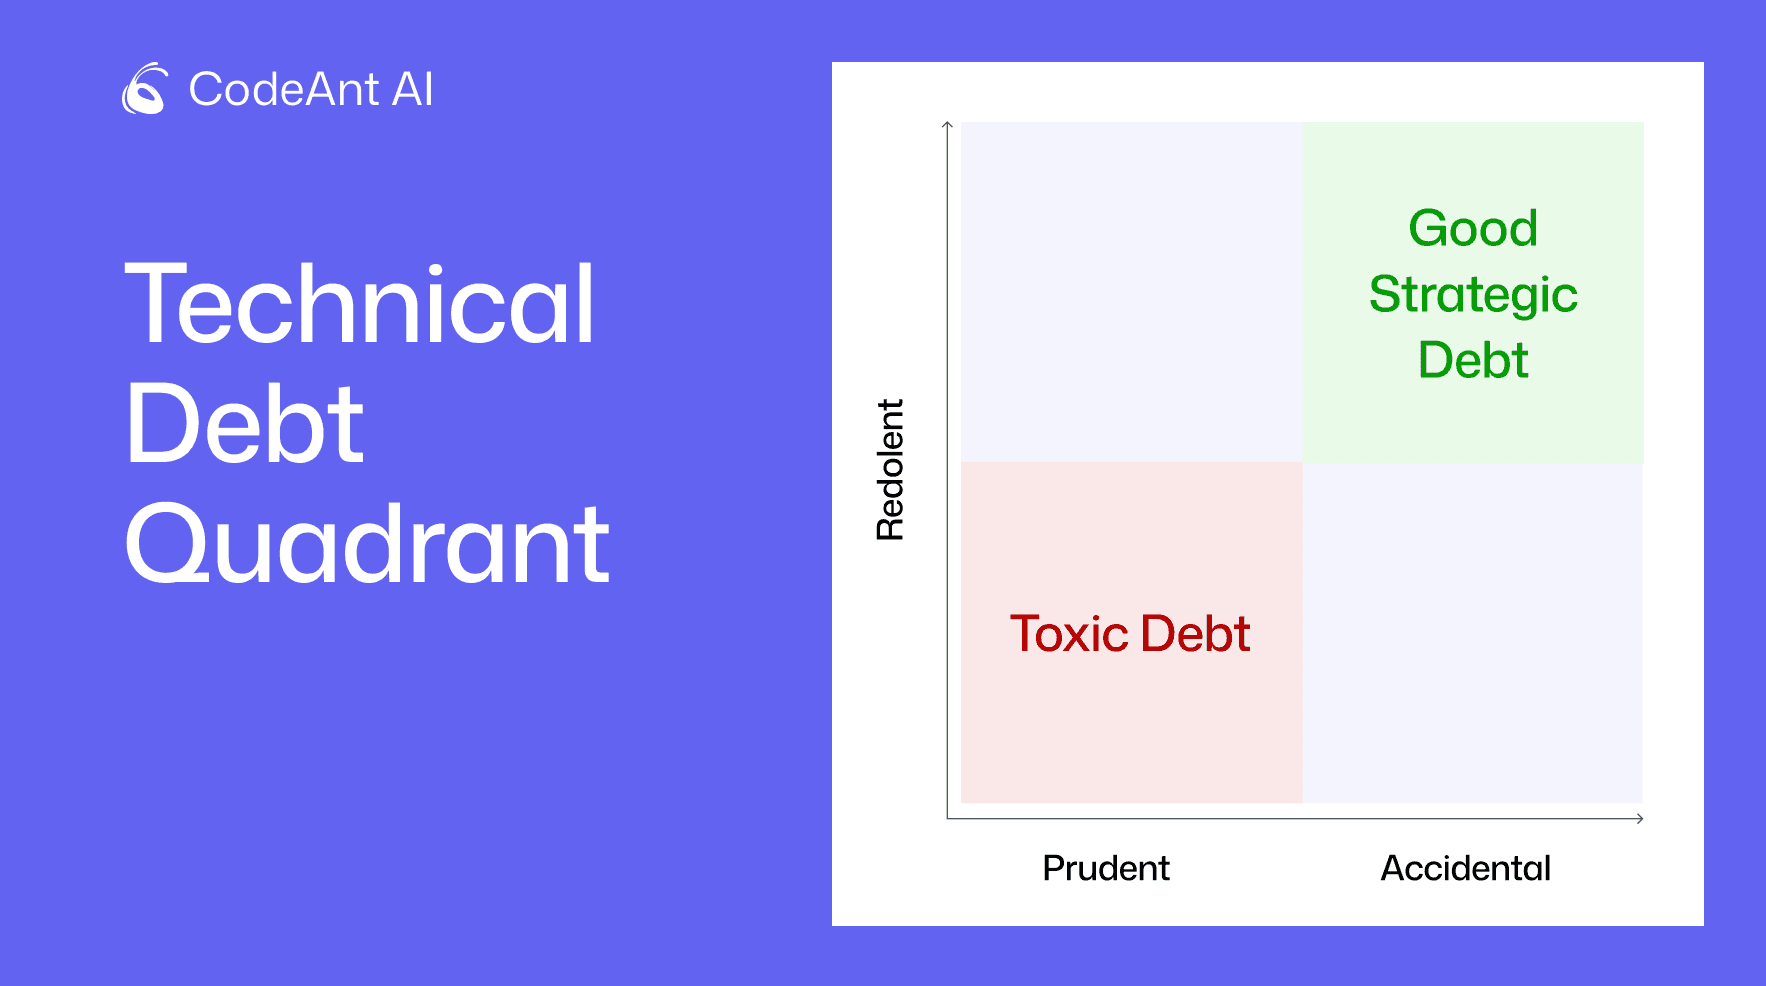
The Four Technical Debt Quadrants
One of the most widely used frameworks is Martin Fowler’s Technical Debt Quadrants.
It classifies debt across two dimensions:
Intent
Deliberate
Inadvertent
Judgement
Prudent
Reckless
This creates four quadrants:
Intent | Approach | What It Means |
Deliberate | Prudent | Strategic, planned shortcuts |
Deliberate | Reckless | Knowing shortcuts with no plan |
Inadvertent | Prudent | Honest mistakes caught early |
Inadvertent | Reckless | Hidden, compounding time bombs |
To learn more, you can check out our deep dive blog on “What Are the 4 Quadrants of Technical Debt?”
Wardley Mapping and Technical Debt Inertia
Wardley Maps bring a strategic, architectural lens to technical debt.
Instead of focusing only on code, they evaluate where a component sits in its lifecycle.
Components evolve through stages:
Genesis → experimental chaos
Custom-Built → handcrafted and unstable
Product → standardized but brittle
Commodity → stable, cheap, and safe
Where Debt Shows Up
Debt appears as “inertia” when teams:
Skip upgrades
Avoid migrations
Freeze aging infrastructure
Each skipped evolution adds:
Support gaps
Dependency risk
Knowledge loss
Visually, Wardley Maps represent this as a shadow of debt trailing behind the component.
At first:
The system still works
It sits awkwardly between Product and Commodity
Over time:
It drifts backwards
Becomes fragile
Eventually collapses off the map
Why This Matters Strategically
Wardley Mapping reframes technical debt as business risk, not just engineering inconvenience.
Example:
A bank running core systems on unmanaged mainframes
While competitors ship cloud-native systems → This isn’t just tech debt, it’s lost competitive advantage
Wardley Maps help leaders visualize:
Where modernization creates leverage
Where inertia threatens product viability
Where delayed upgrades block revenue paths
They enable conversations like: “If we don’t modernize component X now, it will prevent us from shipping feature Y later.”
Key Takeaway
Each framework gives a different lens:
Framework | What It Helps You See |
Principal & Interest | The cost of waiting |
Debt Quadrants | The type of mistake |
Wardley Mapping | The strategic threat |
Together, they make technical debt:
Visible
Measurable
Strategically defensible
Instead of vague engineering complaints, you get clear economic reasoning for when to invest, and when to consciously carry debt.
Real-World Examples: Good vs Bad Tech Debt in Action
Seeing technical debt in real scenarios makes the difference between good and bad much clearer.
Below are examples that show how each type plays out in practice.
Example of “Good” Technical Debt: Intentional Debt for Speed
Scenario 1: SaaS startup choosing speed over perfection (mid-2025)
A SaaS startup faced a make-or-break enterprise deal. A large customer wanted a complex integration immediately.
The team had two options:
Spend 3 months building a scalable, production-perfect solution, and lose the deal
Ship a working integration in 3 weeks, and win the contract
They chose speed.
What they did (intentionally):
Built a one-off integration module
Used minimal abstraction
Added hard-coded assumptions
Clearly documented shortcuts
Tagged the code with:
// TODO: cleanup after Q3
Why this was good debt:
The integration closed the deal
Secured a large enterprise contract
Gave the company resources to rewrite it properly later
This reflects the classic MVP mindset:
Ship at ~90% completeness
Learn fast
Capture ROI early
Because they tracked the debt and scheduled repayment, it never became dangerous.
As Charity Majors puts it: “Shipping should be boring and routine.”
Ship fast, then continuously improve. That’s how good debt stays healthy.
Scenario 2: E-commerce scaling under pressure
An e-commerce company hit a breaking point just before peak season.
Problem:
A perfectly normalized database became a read bottleneck
A full re-architecture wasn’t realistic before Black Friday
Their deliberate choice:
Introduced a denormalized caching layer
Duplicated data to accelerate reads
Violated ideal architecture, on purpose
Outcome:
Prevented site crashes
Protected millions in holiday revenue
Bought time for a proper redesign after the season
The team treated this as:
A temporary stopgap
With a planned removal
Not a permanent shortcut
What These “Good Debt” Examples Have in Common
These teams were:
Outcome-driven
Business-aware
Engineering-disciplined
They used technical debt as a speed lever without letting it become permanent damage.
Core traits:
Conscious decision-making
Documentation and tracking
Clear repayment plan
Example of “Bad” Technical Debt – Unowned Legacy Code and Neglect
Scenario: The abandoned enterprise CRM
A large enterprise ran a core CRM system built in the early 2000s.
Over decades:
Dozens of engineers came and went
Features were bolted on
Bugs were patched under time pressure
By 2025, the codebase had become:
An archaeological ruin
10,000-line functions
Tangled business logic
Orphaned modules
Large “don’t touch this” zones
This was not strategic debt. It was:
Accidental
Untracked
Compounded over time
The interest payments looked like:
New features taking weeks or months
Weekly regression bugs
Impossible cloud integrations
Escalating production incidents
Burnout and attrition
This is classic “big ball of mud” debt.
In one McKinsey case study:
Modernization costs ballooned by $400M
The company abandoned 25% of planned features
Debt literally blocked innovation.
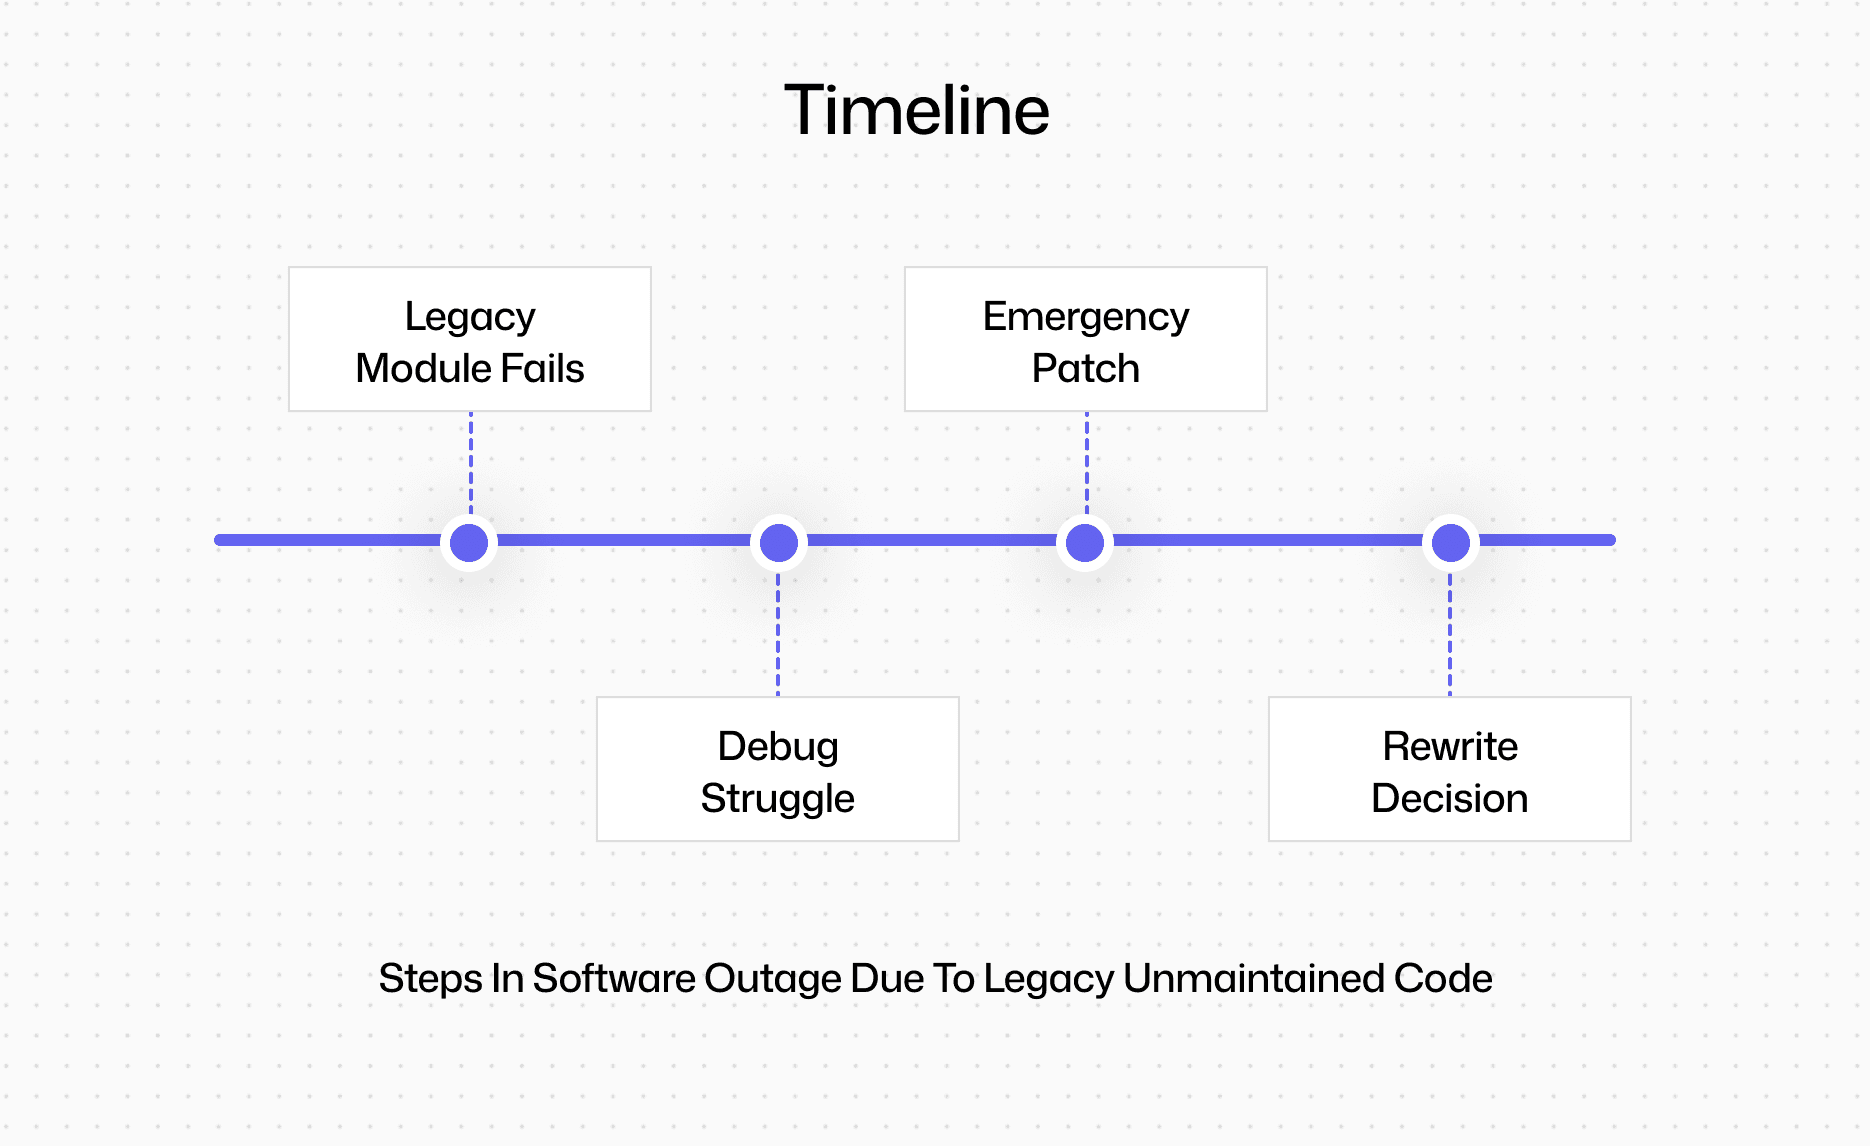
Real-World Incident: Government portal outage (2023)
A government services portal suffered a multi-day outage.
Root cause:
A legacy module in an obsolete framework
No one on the current team understood it
Inherited from multiple contractors
Poor documentation
No clear ownership
What should have been minor became catastrophic:
Debugging was slow
Workarounds stacked up
“Interest payments” exceeded team capacity
The only solution was a forced rewrite.
Google’s internal research has identified:
Orphaned codebases
Knowledge loss
Ownership gaps
…as major productivity killers.
This case showed exactly why.
Reckless, Deliberate Bad Debt (The dangerous kind)
Not all bad debt is accidental. Some is knowingly reckless.
Example:
A fintech startup:
Hardcoded encryption keys
Skipped input validation
Rushed a payments API to meet a deadline
Outcome:
Security breach
Compliance fines
Lost customer trust
This kind of debt:
Offered almost no real upside
Created massive long-term risk
Backfired exactly as expected
Many security incidents trace back to these shortcuts.
The Pattern Behind Bad Technical Debt
Bad debt almost always shares the same characteristics:
No ownership
No plan
No tracking
No standards enforcement
Outdated technology locked into critical paths
Instead of improving the system, teams:
Firefight constantly
Apply patches on top of patches
Avoid risky refactors
The outcomes:
Higher failure rates
Slowed development
Operational bottlenecks
Demoralized teams
The Cost of Unmanaged Technical Debt
Unmanaged “bad” technical debt doesn’t just slow teams down, it creates measurable damage across delivery, reliability, and team health.
When technical debt is ignored, teams experience:
More production failures
Slower delivery cycles
Higher operational risk
Lower developer morale
Below are the most common and costly impacts.
Increased Incidents and Outages
One of the clearest “interest payments” of technical debt is production instability.
Debt-heavy systems typically show:
Brittle, tightly coupled code
Ad-hoc fixes layered over fragile foundations
Unpredictable failure patterns
What this looks like in practice:
Small changes trigger cascading failures
Higher incident rates and emergency firefighting
More sev-1 outages traced back to:
Skipped updates
Hard-coded secrets
Single points of failure never refactored
These systems also tend to:
Lack modularity
Lack test coverage
Fail loudly instead of gracefully
Real-world impact:
High technical debt strongly correlates with elevated Change Failure Rate (CFR)
McKinsey found organizations drowning in debt face higher project failure rates and modernization downtime
Bottom line: Every incident becomes an “interest payment,” time spent repairing yesterday’s shortcuts instead of building tomorrow’s value.
PR Churn and Rework
Another hidden cost is what many teams call the rework tax.
When the codebase is messy:
Simple changes require unexpected refactoring
“Quick fixes” generate follow-on fixes
Pull requests bounce back and forth
Common symptoms:
Reopened PRs
Follow-up bug-fix PRs
Hotfixes and rollbacks
Reverts after release
Metrics back this up:
Teams with high debt show:
Higher PR reopen rates
Higher hotfix frequency
More reverts
Elevated Rework Rate correlates with:
Slower lead times
Lower release stability
Effect on teams:
Work gets done twice or three times
Throughput drops
Cognitive load rises
This is why technical debt is often described as a tax on future development:
You can still build, it just costs more every time.
Delayed Velocity and Missed Opportunities
As debt accumulates, delivery speed steadily declines.
Teams experience:
Longer implementation cycles
Slower design decisions
Constant workarounds instead of clean solutions
Business-level impact:
Roadmaps slip
Initiatives get scaled back
Opportunities are missed
Real examples:
Enterprises have reported abandoning 25% of modernization projects purely due to debt overhead (McKinsey)
Operational signals:
Lower Deployment Frequency
Higher Lead Time for Changes
Increasing Change Failure Rate
Longer MTTR
Behavioral signal:
Engineers begin to avoid touching risky areas
“Fear of deploys” becomes normalized
That said: Fear of deployment is the largest source of technical debt in almost every organization.
This creates a vicious loop:
Slower deploys → Riskier deploys
Riskier deploys → More fear
More fear → Even slower releases
Developer Frustration and Burnout
The most underestimated cost of technical debt is human.
Working in a debt-ridden system leads to:
Constant firefighting
More bug fixing than building
Time wasted on:
Obsolete dependencies
Giant untestable functions
Mystery legacy logic
The visible effects:
Lower job satisfaction
Higher turnover
Harder onboarding
Cultural pessimism (“the code won’t allow it”)
Long-term psychological impact:
Fear of change
Loss of creativity
Burnout
Economic impact:
Poor software quality has been estimated to cost the global economy trillions of dollars annually through lost productivity and incidents
Daily team reality:
Noisy on-call rotations
Continuous context switching
Chronic fatigue
The opposite also holds true:
When teams actively pay down debt:
Pride in the codebase increases
Motivation improves
Retention improves
Why This Actually Matters
Unmanaged technical debt is not an abstract engineering problem.
It directly impacts:
Reliability → more outages
Speed → slower time-to-market
People → unhappy, burned-out teams
Business → lost competitive advantage
This is why high-performing teams treat debt reduction as first-class work, not side work.
DORA research consistently shows:
Elite performers don’t “stop and fix debt later”
They continuously invest in maintainability
The best part is that teams no longer have to manage technical debt blindly.
Modern practices and AI-assisted tools now make it possible to:
Quantify technical debt
Prioritize high-risk areas
Systematically reduce it without sacrificing delivery speed
And that’s exactly what we’ll explore next.
Technical Debt Management and Reduction Strategies
How do you maximize “good” debt and minimize “bad” debt?
Effective technical debt management isn’t accidental. It requires:
Strong engineering culture
Strategic prioritization
Metrics-driven decision making
Modern tooling and AI-assisted workflows
The goal is simple: Make technical debt management a built-in part of everyday development, not a cleanup activity that happens only when something breaks.
Well-run teams ensure:
Debt is visible
Risk is quantified
High-interest items are fixed before they explode
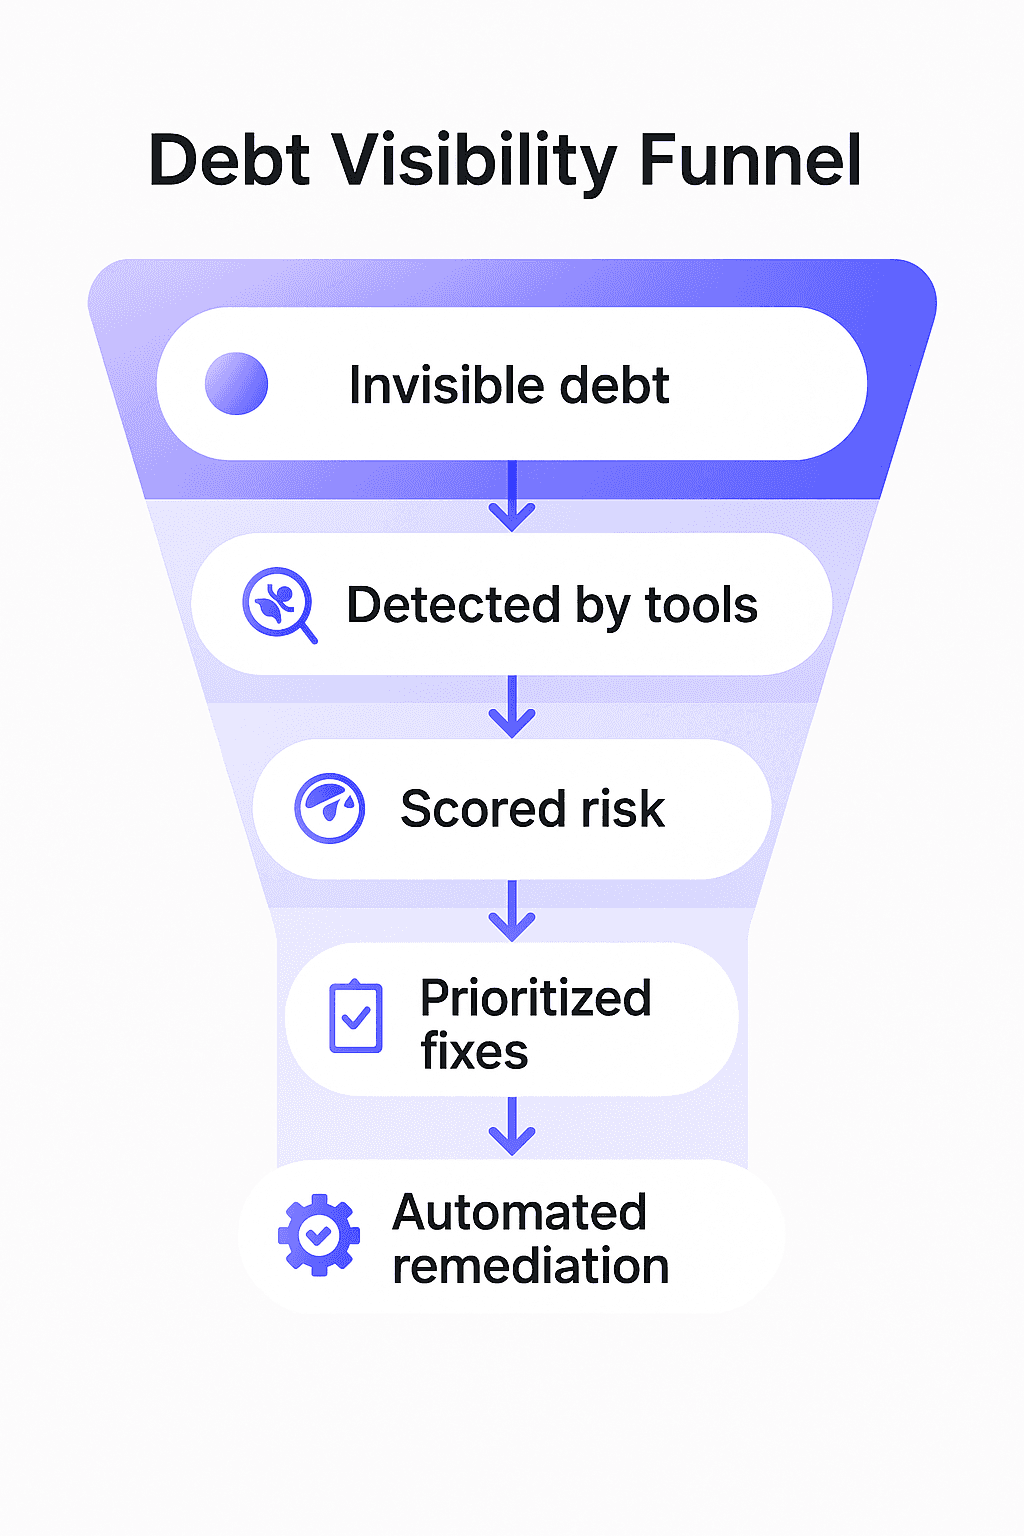
1. Measure and Surface the Debt
You can’t fix what you can’t see.
The first step is visibility, both quantitative and qualitative.
Key Technical Debt Signals to Track
High-signal metrics include:
PR churn rate → how often code is rewritten or reverted after merge
Low test coverage zones → especially in high-change modules
Complexity hotspots → high cyclomatic complexity + frequent edits
Time-to-merge vs defect correlations → slow reviews + higher failure rates
These metrics expose where debt creates friction.
Examples:
If a 5,000-line module caused 6 of the last 10 incidents, that’s a debt hotspot
If a team’s PRs frequently get reopened or rolled back, that subsystem likely hides debt
Use Automated Tooling to Surface Hidden Debt
Manual tracking is not enough. Modern teams rely on automated analysis:
Continuous scanning of repositories, branches, and commits
Detection of:
Hidden complexity
Duplication
Outdated dependencies
Fragile patterns
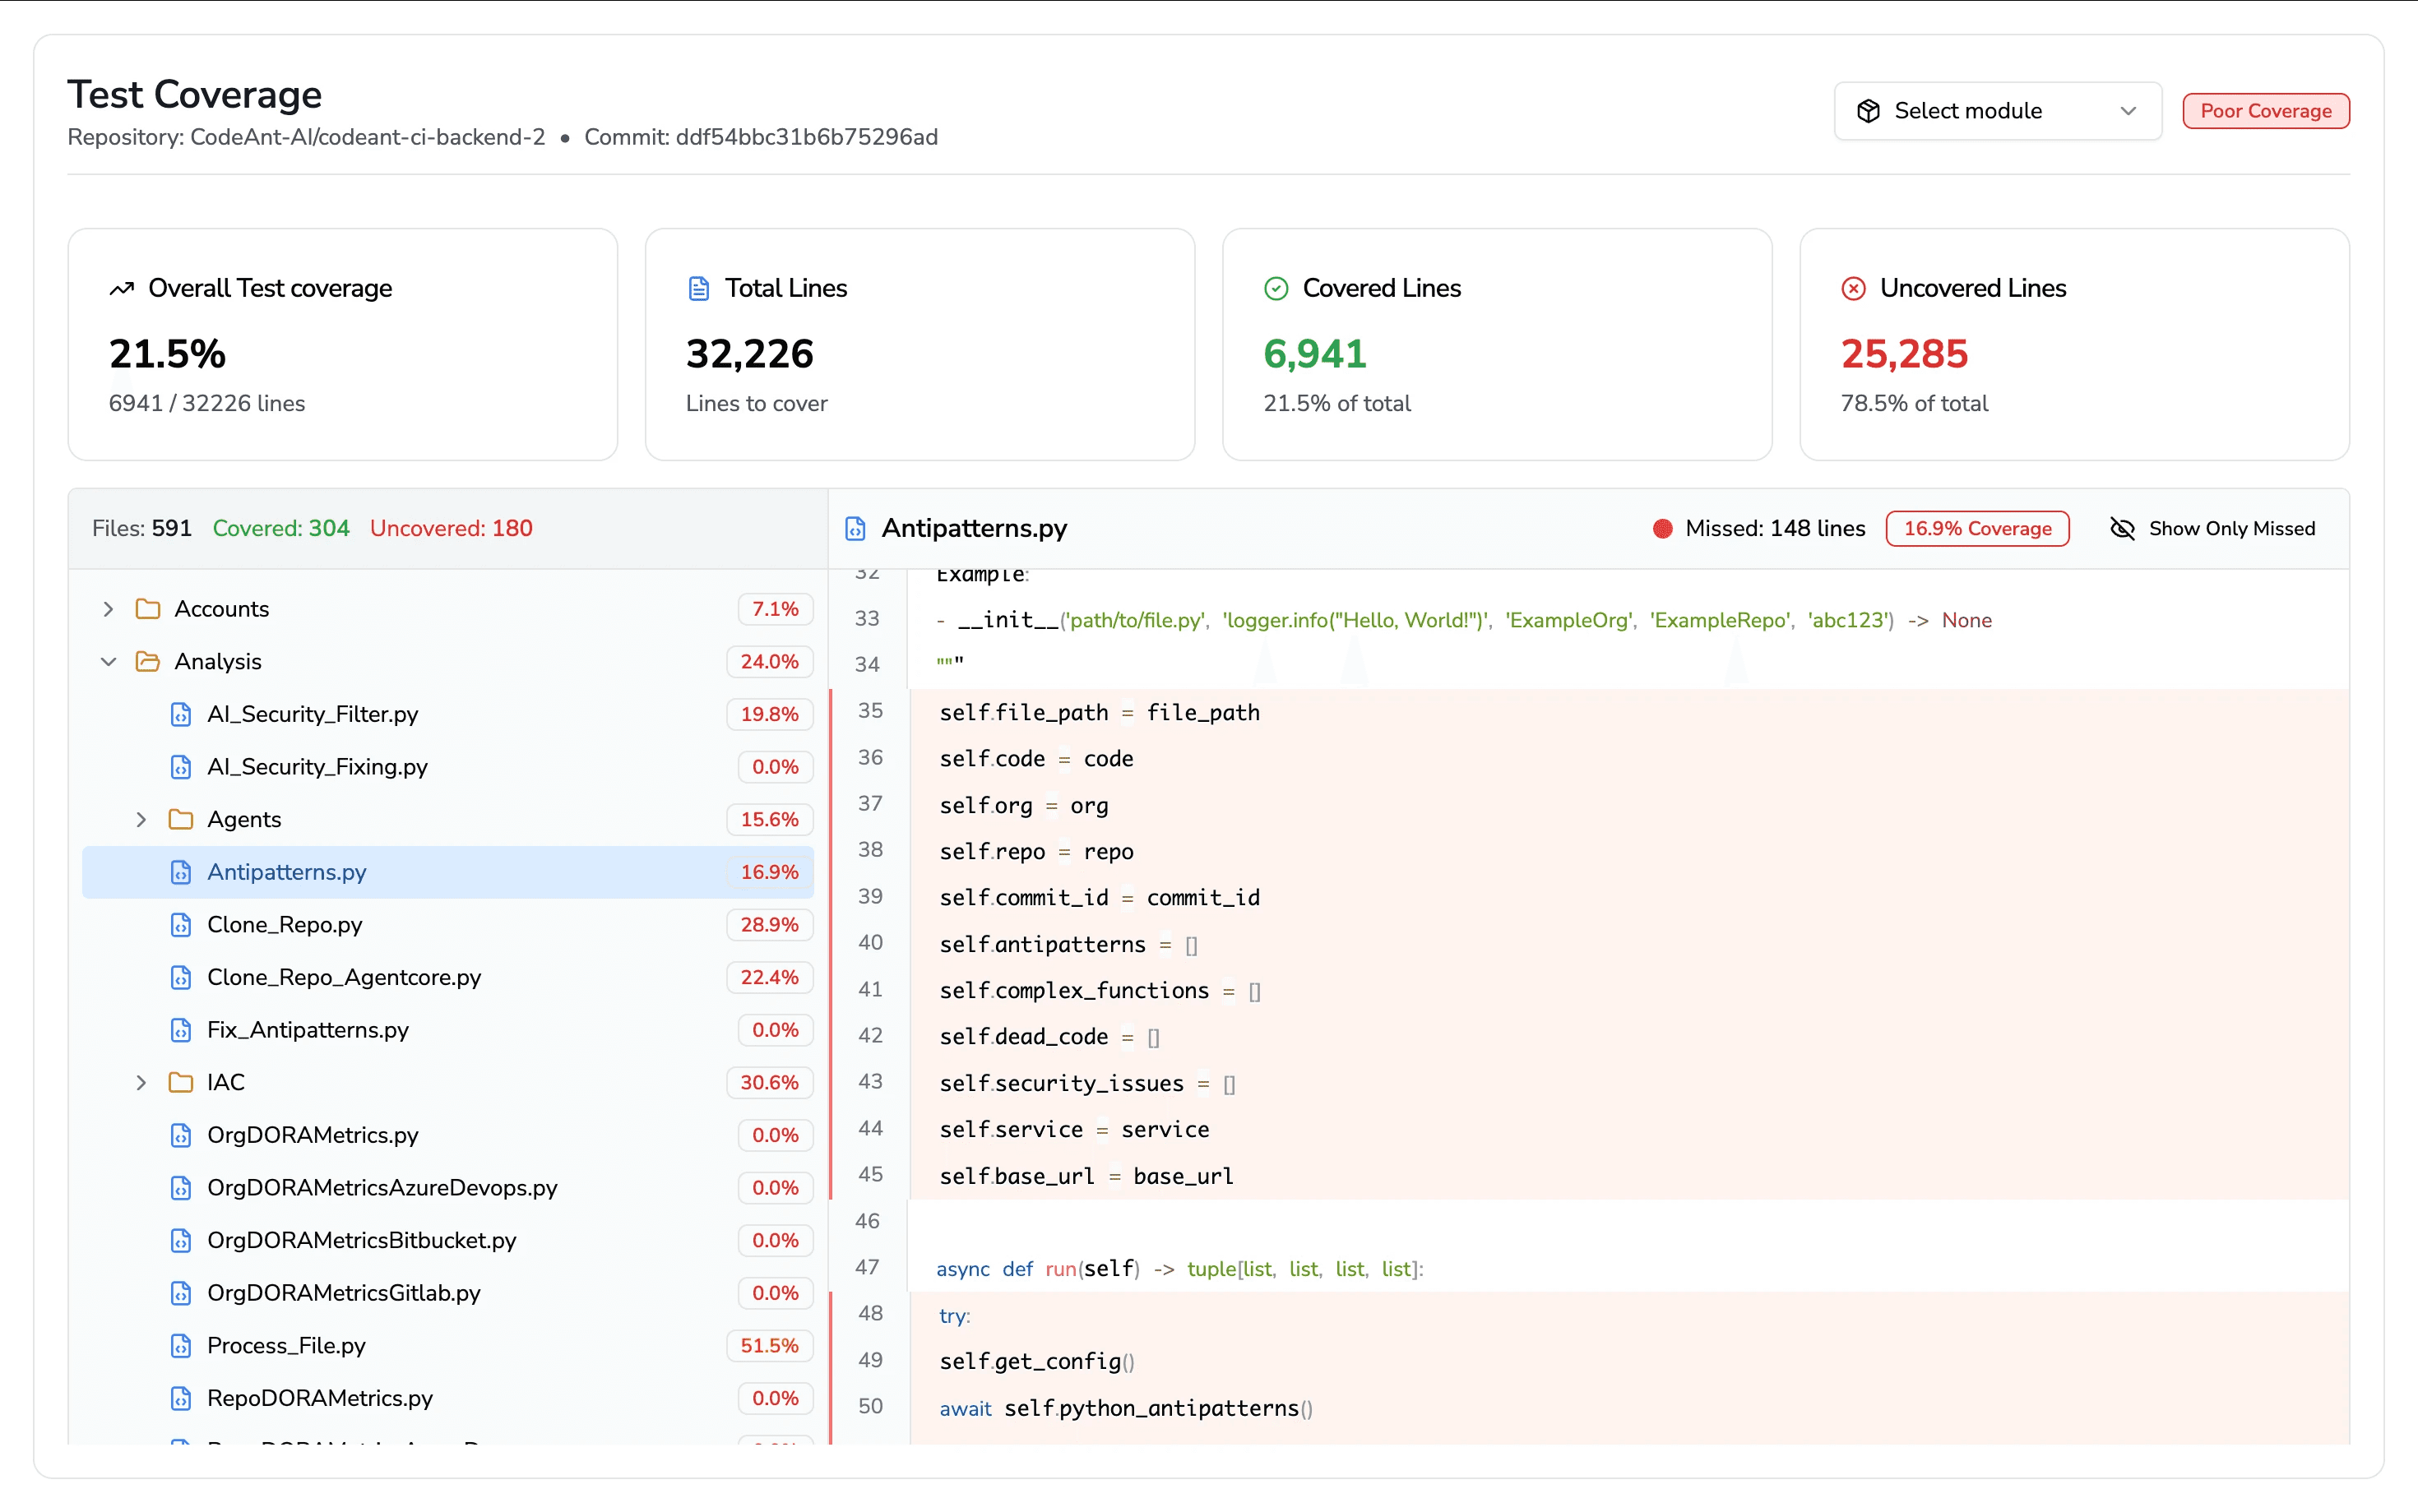
For example:
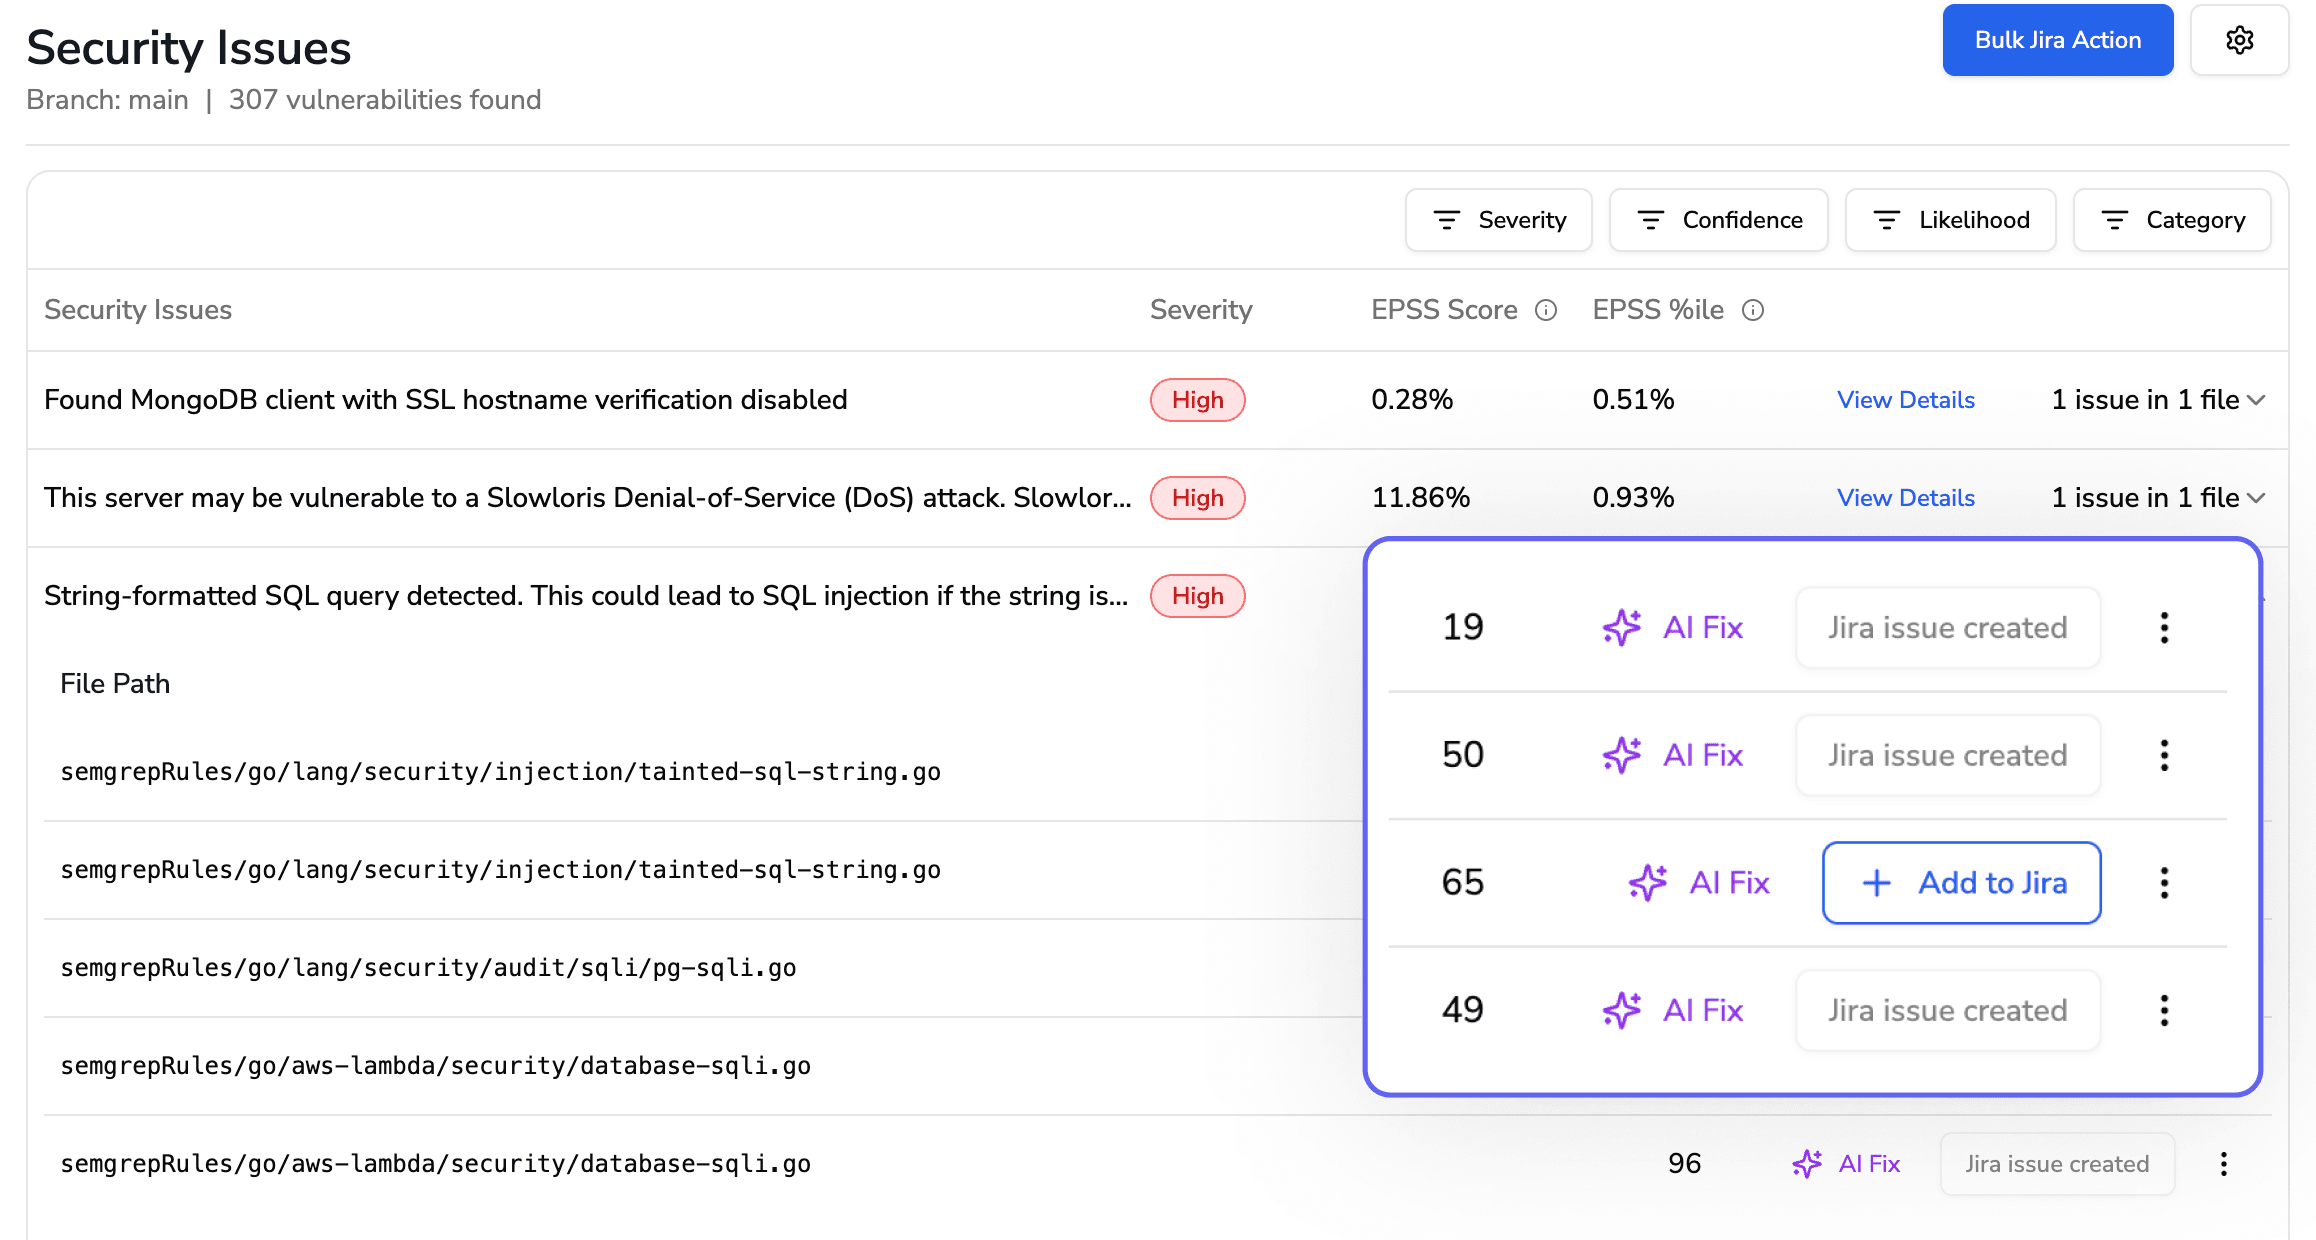
CodeAnt’s AI platform can:
Scan entire codebases
Score risk hotspots
Visualize “decay zones” inside your architecture
Surface debt that humans usually miss
Think of this as a real-time tech debt balance sheet.
Link Debt → Business Outcomes
Raw metrics aren’t enough. You need outcome mapping.
Strong teams tie debt directly to:
Deployment speed
Incident frequency
PR throughput
MTTR and change failure rates
With tools like CodeAnt.ai, teams can quantify statements like:
“Module X has a debt score of 7/10”
“It adds ~3 days of delay per release”
“It causes ~2 incidents per quarter”
This shifts the conversation from:
❌ “This code looks ugly”
✅ “This code is costing us delivery time and reliability.”
Google follows a similar philosophy:
Internal tech debt maturity models
Continuous surveys
Team-level debt impact analysis to prioritize remediation
Institutionalize Debt Tracking
High-performing teams make debt formal.
Best practices:
Maintain a Tech Debt Register (like a backlog)
Track items like:
Impact
Effort
Ownership
ROI
Example: “Refactor auth module → high PR churn, caused 2 outages last year, expected to reduce MTTR by 80%.”
Advanced teams even:
Assign tech debt scores per component
Track movement over time (like a credit score)
Tools like CodeAnt AI help automate this by:
Auto-creating debt tickets
Flagging regressions
Preventing silent accumulation
2. Prioritize What Actually Matters (80/20 Rule)
Once debt is visible, strategy matters more than activity.
You cannot fix everything, and you shouldn’t try to.
Use the Pareto Principle:
~20% of the codebase usually causes:
80% of bugs
80% of delays
80% of operational pain
Smart teams target that critical 20%.
How to Identify the Top 20%
Effective signals:
Incident overlap with complexity hotspots
Security vulnerability clustering
Low-test + high-change frequency zones
CodeAnt AI helps by overlapping multiple signals:
Hotspot analysis
Test gaps
Incident history
Dependency risk
This often reveals:
A small number of files causing most failures
A handful of libraries responsible for most known CVEs
Those are your highest-ROI refactors.
Check out these interesting reads:
CVE-2024-6800 | CVE-2024-56325 | CVE-2024-10905
CVE-2025-21535 | CVE-2025-3066 | CVE-2024-49775
Score Debt by Impact, Not Aesthetics
Not all ugly code is urgent. Score debt by outcomes:
Impact on:
Deployment speed
Incident count
Onboarding friction
Practical prioritization buckets:
Level | Meaning |
High | Actively causing incidents, outages, serious delays |
Medium | Friction exists, but tolerable (for now) |
Low | Mostly cosmetic or readability-driven |
Anything tied to:
Security risk
Compliance exposure
Fragile critical systems
…should be handled first.
This mirrors Fowler’s technical debt quadrants, reckless/high-interest debt must be paid down early.
Why This Works
This approach is like: Paying off the highest-interest credit cards before everything else.
Fixing the worst debt:
Immediately reduces failure rates
Improves developer morale
Builds momentum
3. Automate What Humans Shouldn’t (AI + Tooling)
While you’re fixing existing debt, you must stop new debt from forming.
CI/CD Guardrails
Modern pipelines should automatically prevent debt:
Common automations:
Static analysis in every PR
Linters and formatters
Dependency freshness checks
These tools detect:
Excessive complexity
Missing tests
SQL injection risks
Outdated / vulnerable packages
Core rule: Don’t waste human reviewer time on what machines can catch.
AI-Assisted Prevention
CodeAnt AI extends this further by:
Detecting debt patterns automatically
Flagging:
Outdated APIs
Insecure functions
Duplicate logic
And most importantly:
Suggesting one-click fixes inside PRs
Examples:
Detects copy-paste blocks → suggests abstraction
Flags risky patterns → proposes safe rewrites
This turns debt into a preventable event, not a future crisis.
Enforce Lightweight Quality Gates
Helpful automated rules:
PR fails if:
Test coverage drops below X%
A module exceeds size/complexity thresholds
Bots:
Remove stale TODOs
Expire old feature flags
Open dependency upgrade PRs
This prevents accumulation of “dead” debt.
AI-Assisted Code Reviews
AI tools reduce human bottlenecks:
Summarize PR risk
Highlight missing tests
Suggest safe refactors
CodeAnt AI can:
Auto-generate PR summaries
Flag fragile patterns directly to reviewers
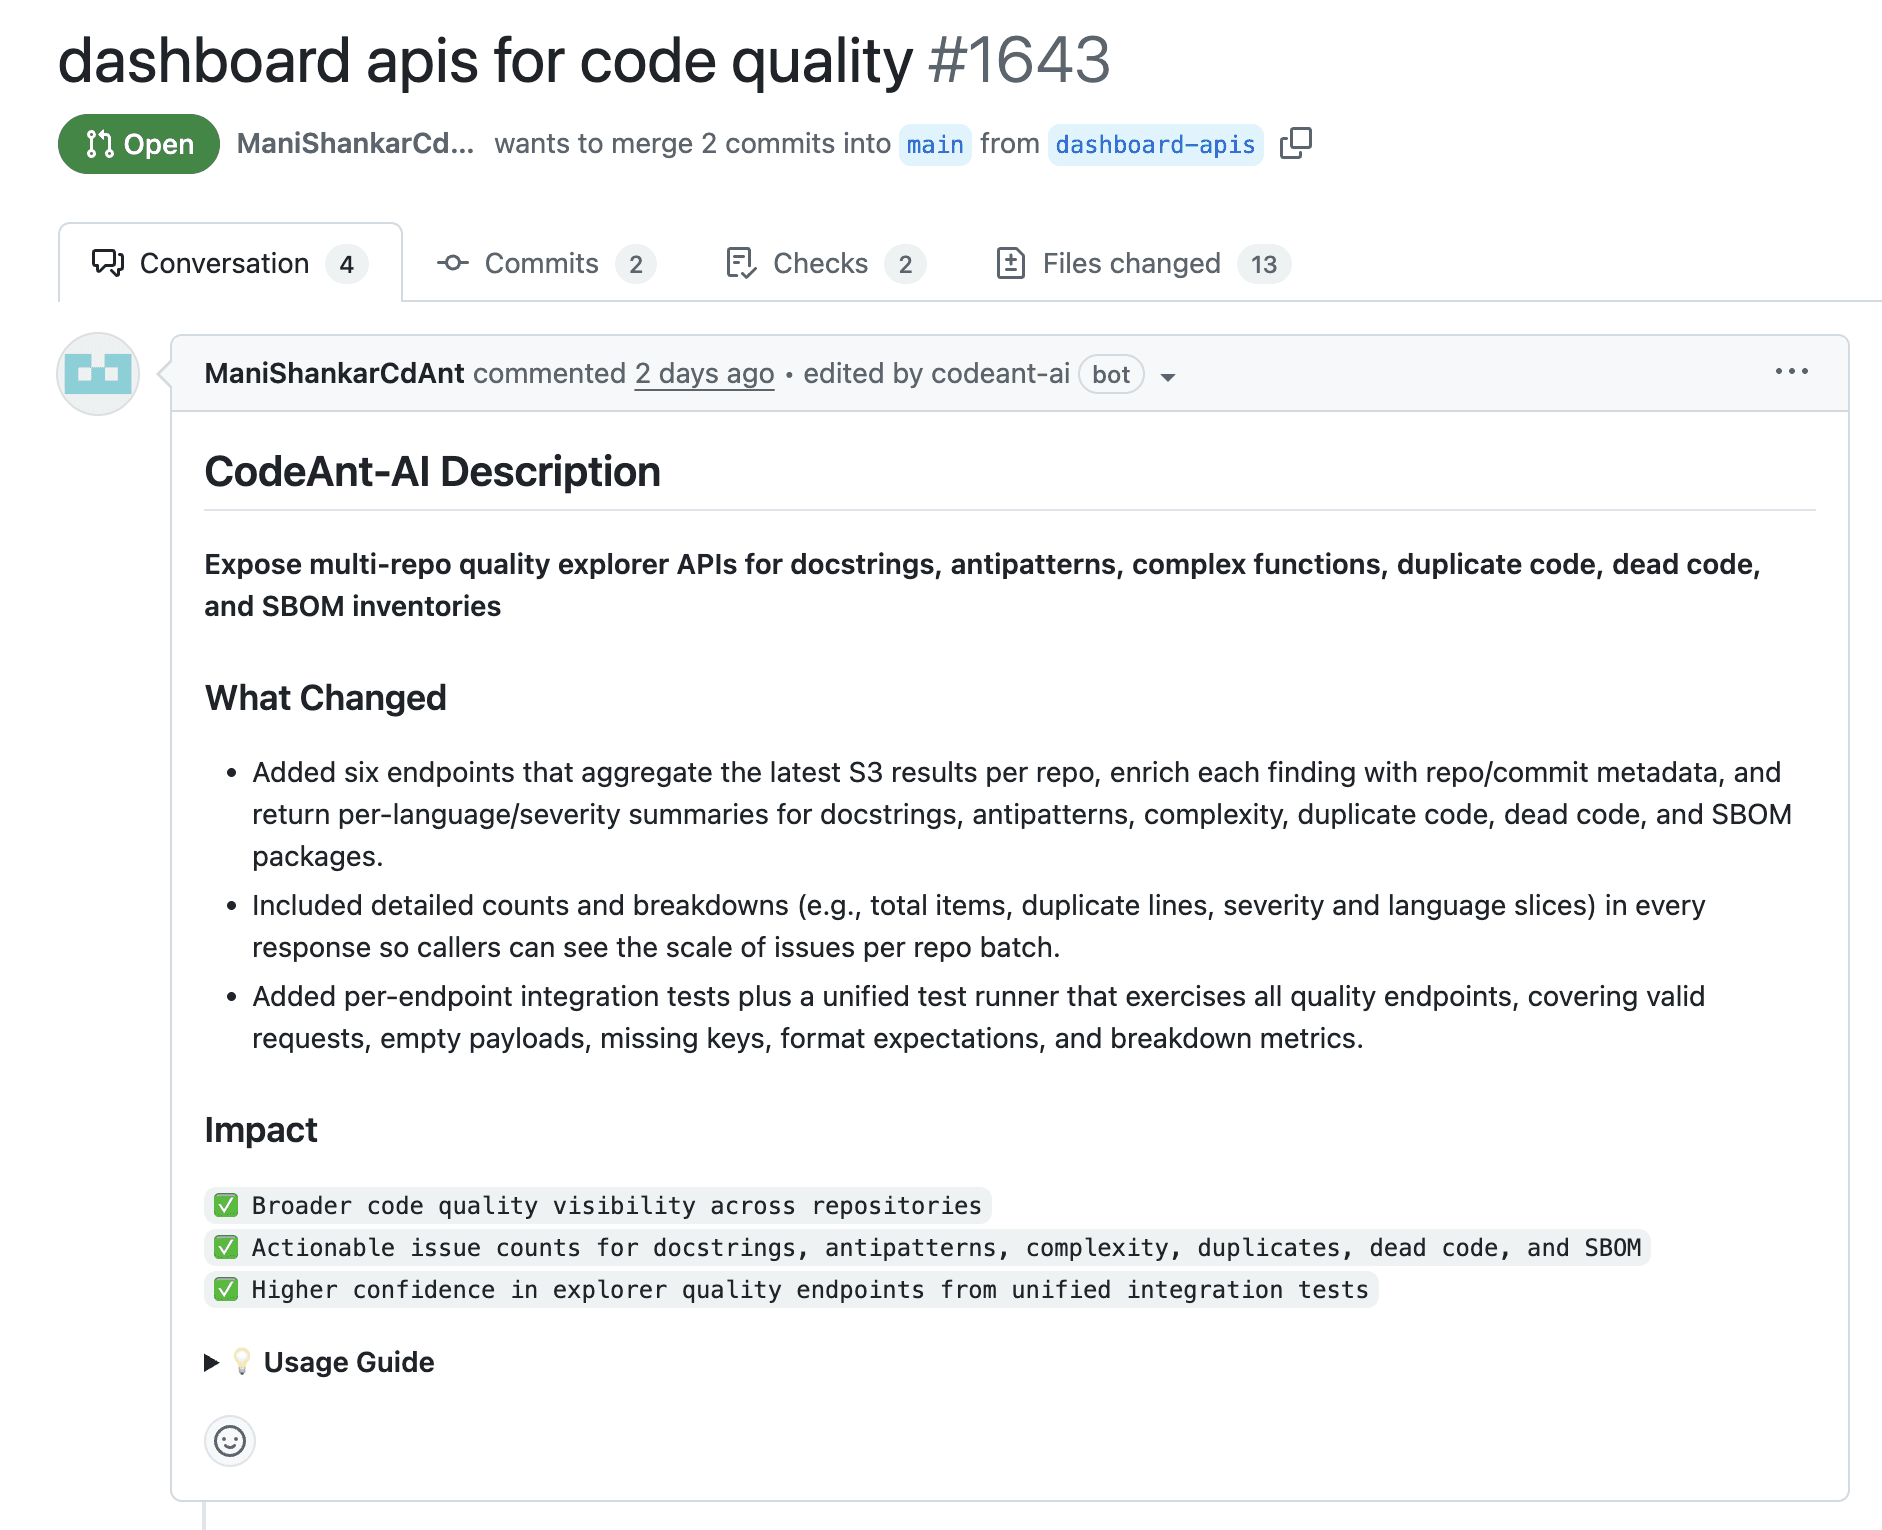
This allows humans to focus on architecture and intent.
4. Refactor Regularly and Incrementally
Automation doesn’t remove the need to pay debt. The best teams embed refactoring into daily work.
Cultural Practices That Work
Adopt:
Boy Scout Rule → Leave code better than you found it
Micro-refactors during:
Feature work
Bug fixes
Small improvements:
Better variable names
Smaller functions
Tests around legacy areas
These compounds over time.
Allocate Explicit Time for Debt Work
Proven patterns:
20% of sprint capacity for debt work
Every 5th sprint = stabilization sprint
Key rule: Debt work is first-class work, not a “when we have time” task.
Tie refactors to outcomes:
“Refactor module X → enables faster localization”
“Clean service Y → removes blocking rework”
Modernize Incrementally (Avoid Big-Bang Rewrites)
Avoid risky full rewrites.
Prefer:
Strangler patterns
Branch-by-abstraction
Feature flags
This allows:
Continuous delivery
Lower risk
Visible progress
Track and Celebrate Wins
Make progress visible:
Dead code removed
Coverage improved
Incidents reduced
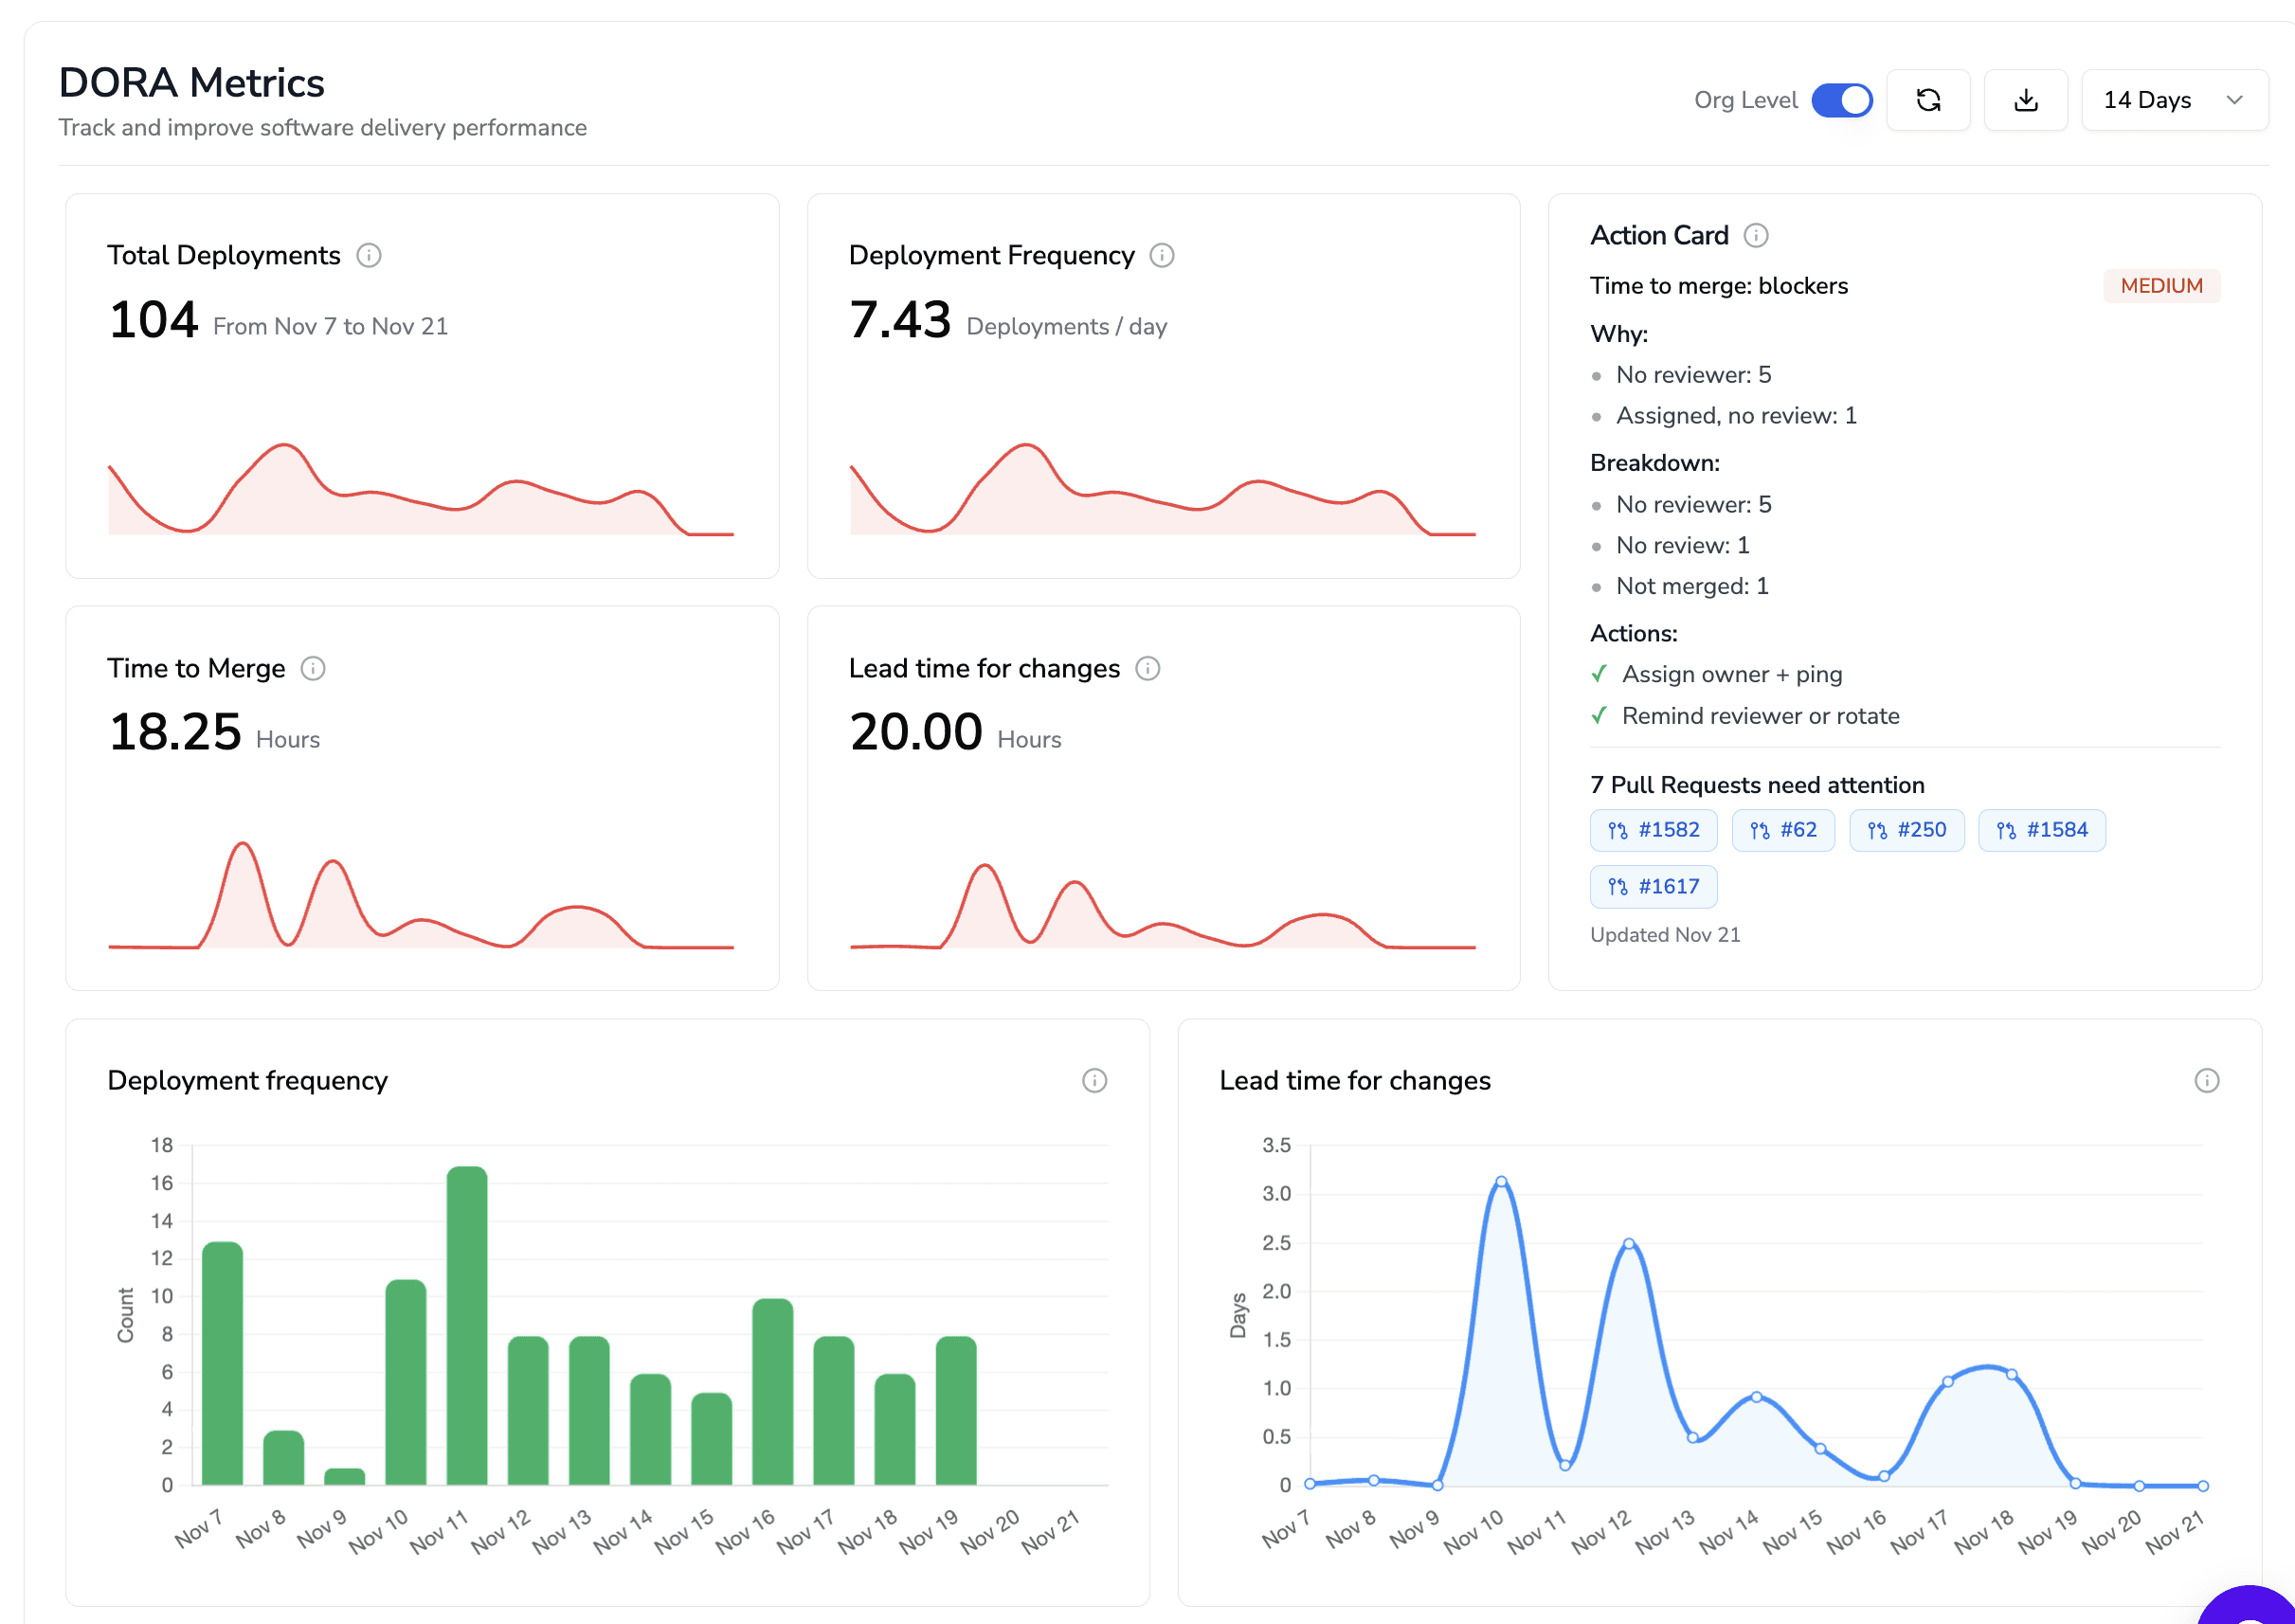
Tools like CodeAnt AI visualize:
Deploy frequency improvements
Incident drops after refactors
Tie wins back to:
Reliability KPIs
5. Use Data to Win Executive Buy-In
Technical debt is hard to justify without data.
Turn this:
❌ “The code is a mess.”
Into this:
✅ “Module X has 3× defect rate and delays releases by 2 days.”
Link debt work to business outcomes:
Deployment frequency
Change failure rate
MTTR
Customer experience
This aligns engineering and leadership.
6. Making Debt Reduction a System, Not a Project
At CodeAnt AI, the philosophy is simple: What gets measured gets improved.
Teams can:
Set improvement targets
Track progress over time
Tie metrics to delivery outcomes
Examples:
Cut rework rate by 50%
Raise critical service health score
That said, Modern technical debt management requires:
Making debt visible
Prioritizing high-impact items
Automating prevention
Refactoring continuously
Measuring outcomes
When done well, the results are tangible:
✅ Faster delivery
✅ Safer releases
✅ Happier engineers
And debt stops being a crisis, and becomes a manageable system.
Conclusion: Turning Technical Debt into a Tactical Advantage
Technical debt isn’t the problem, uncontrolled technical debt is. The best engineering teams don’t try to eliminate debt. They manage it intentionally.
They:
Use debt strategically to ship faster
Track risk before it explodes
Refactor continuously instead of reacting to outages
When done right, technical debt becomes a speed advantage, not a bottleneck.
If you want to:
Identify high-risk debt automatically
Cut down rework and review cycles
Ship faster without sacrificing code health
See how CodeAnt AI helps engineering teams turn technical debt into a growth lever. Start your free trial or book a demo today.
FAQs
What is the difference between good technical debt and bad technical debt?
How can engineering teams tell if a shortcut is good technical debt or a mistake?
What frameworks help evaluate technical debt in a structured way?
How does unmanaged technical debt impact delivery speed and reliability?
How can AI tools like CodeAnt help manage good and bad technical debt?


