Code Security
SAST Pricing Guide: How Much Do Static Analysis Tools Cost?

Sonali Sood

Founding GTM, CodeAnt AI
SAST pricing is one of the most opaque areas in the DevSecOps market. Most vendors hide their pricing behind “Contact Sales” buttons, making it nearly impossible to build a budget before engaging in a sales cycle. Engineering managers and procurement teams routinely spend weeks collecting quotes just to understand if a tool fits their budget, before evaluating a single feature.
This guide fixes that. Below you will find the four pricing models SAST vendors use, a comparison table with every price point we could verify from public sources across 15 tools, the hidden costs that inflate your actual spend beyond the sticker price, and a framework for calculating SAST ROI that does not rely on fabricated statistics. For full feature comparisons beyond pricing, see the complete SAST tools comparison.
How SAST Pricing Works: 4 Common Models
SAST tools use four fundamentally different pricing models, and the model matters as much as the price point. A tool that costs $15/user/month can be more expensive than one that costs $30,000/year depending on your team size, codebase, and growth trajectory. Understanding the model helps you predict not just what you will pay today, but what you will pay in 12 months when your team is 40% larger.
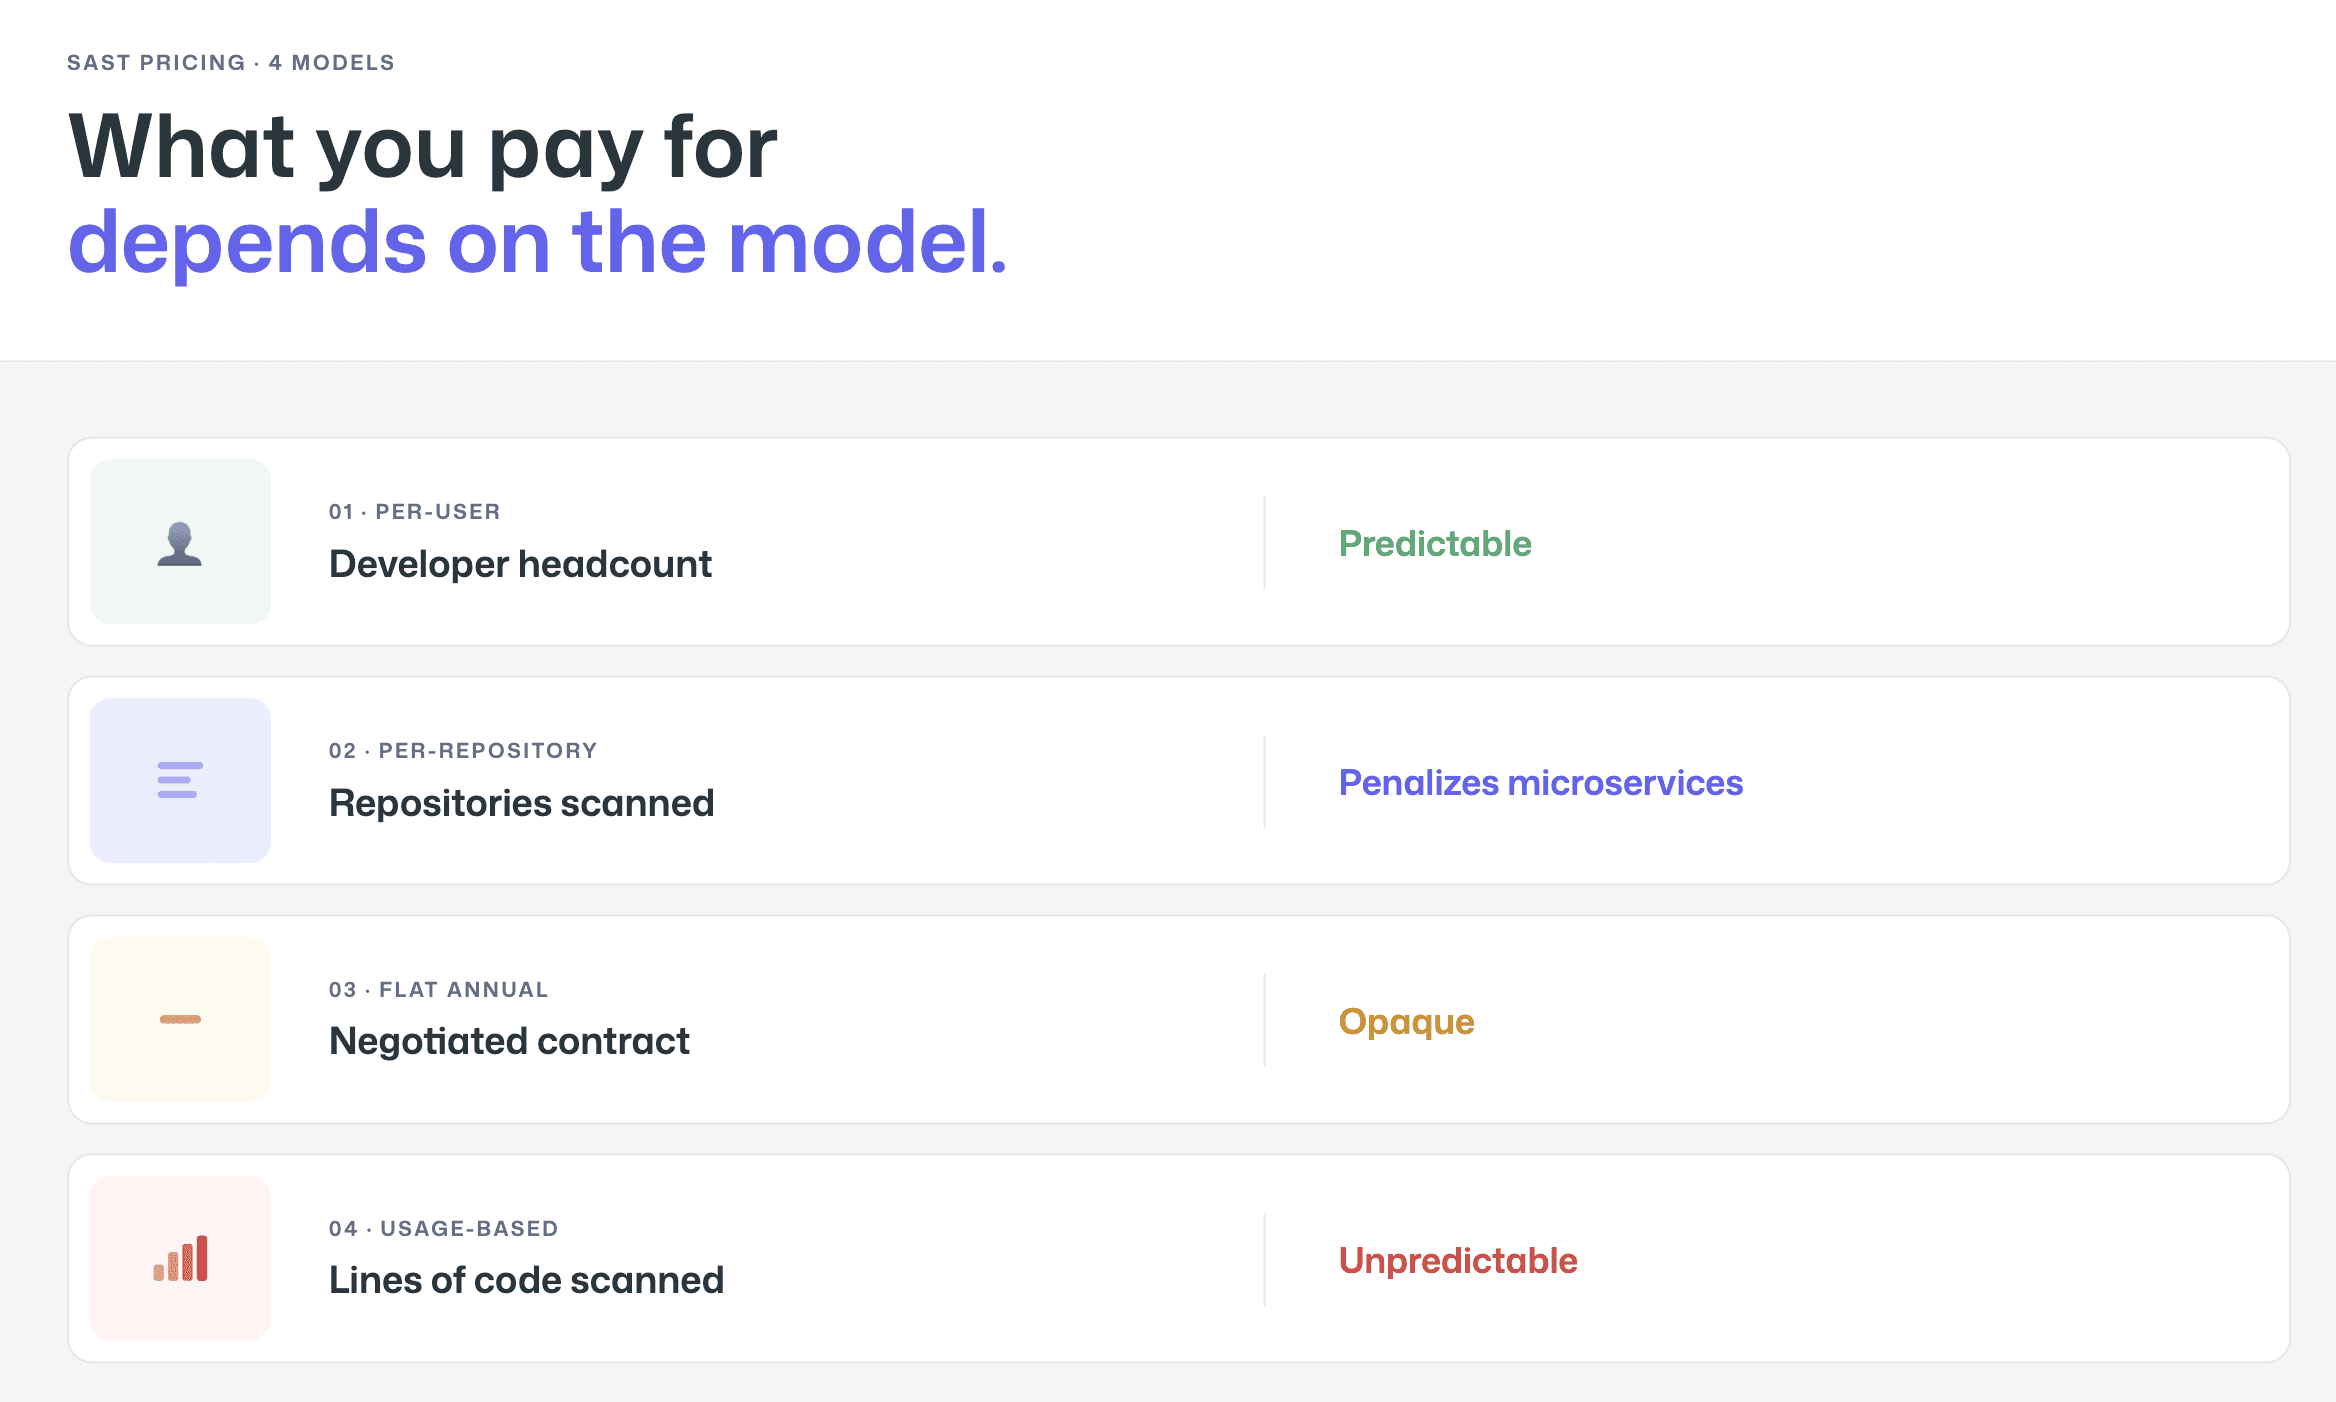
Per-User / Per-Seat
The most common model for modern SAST tools. You pay a fixed monthly or annual fee for each developer, contributor, or committer who uses the tool. This model is predictable and easy to budget, multiply your developer headcount by the per-seat price.
The nuance is in how vendors count “users.” Some count every developer in the organization (whether they trigger scans or not). Others count “active committers,” developers who actually pushed code to a scanned repository in the last 30, 60, or 90 days. The active committer model is generally more favorable because it excludes managers, part-time contributors, and inactive accounts. When evaluating per-user pricing, always ask: who counts as a user?
Tools using this model: CodeAnt AI, Snyk, GitHub Advanced Security (per active committer), GitLab SAST (bundled in per-user Ultimate plan), Aikido Security.
Per-Repository / Per-Project
Less common but used by some tools, particularly those that evolved from code quality platforms. You pay based on the number of repositories or projects scanned, regardless of how many developers contribute to them.
This model can be cost-effective for organizations with many developers working on few repositories, but it penalizes microservices architectures with hundreds of small repositories. It also creates perverse incentives, teams may avoid splitting monoliths into smaller services because each new repository increases cost.
Tools using this model: Some SonarQube configurations (though SonarQube primarily uses lines of code).
Flat Annual License
Traditional enterprise SAST vendors sell annual or multi-year contracts at a flat rate negotiated during the sales process. The price depends on a combination of factors: team size, number of applications, scan volume, language coverage, and deployment model. Two companies with identical headcount can receive wildly different quotes depending on their negotiation leverage and the vendor’s end-of-quarter pressure.
This model offers budget predictability (one number, one invoice) but makes cost comparison difficult because every customer pays a different price. It also tends to favor large enterprises, the minimum contract value is often $50,000–$100,000+, which prices out smaller teams entirely.
Tools using this model: Checkmarx One, Veracode, OpenText Fortify, HCL AppScan, Cycode, Arnica, Corgea.
Usage-Based / Scan-Based
A newer model where pricing scales with actual usage, typically measured in lines of code (LOC), number of scans, or compute time. SonarQube is the most prominent example, pricing its Server editions by lines of code per instance.
This model aligns cost with value (you pay for what you scan), but it creates unpredictability. A codebase that grows from 500K to 2M lines of code can see a 4× cost increase without adding a single developer. Teams must monitor their LOC count and plan for pricing tier jumps.
Tools using this model: SonarQube (per LOC), some Veracode configurations (per application scan).
SAST Pricing Comparison Table (2026)
The table below compiles pricing information verified from public sources as of February 2026. Where vendors do not publish pricing, we indicate the model and directional range based on publicly available data. Always verify current pricing with the vendor before making purchase decisions. For a full feature comparison alongside pricing, review all 15 tools in our SAST comparison.
Tool | Free Tier | Starting Price | Enterprise | Pricing Model | Source |
CodeAnt AI | 14-day trial | $20/dev/mo | Custom | Per user | |
Snyk | Yes (limited tests) | $25/dev/mo (Team; max 10 devs) | Custom ($5K–$70K+/yr typical) | Per contributing developer | |
Checkmarx One | No | Contact Sales | Custom ($59K–$500K+/yr reported) | Custom contract (users + apps) | |
SonarQube | Yes (Community Build; Cloud free to 50K LOC) | $720/yr (Server Dev, 100K LOC); Cloud from €30/mo | Contact Sales | Per LOC (Server) / Per LOC (Cloud) | |
Semgrep | Yes (up to 10 contributors) | ~$40/contributor/mo (Team) | Custom | Per contributor | |
Veracode | No | Contact Sales | Custom ($30K–$100K+/yr reported) | Custom contract | |
GitHub Code Security | Free (public repos) | $30/active committer/mo | Included in Enterprise Cloud | Per active committer | |
GitLab SAST | Basic SAST in all tiers | Included in Ultimate ($29/user/mo Premium; Ultimate = contact sales) | Included in Ultimate | Per user (bundled) | |
Mend.io | No | Contact Sales | Custom | Custom contract | |
OpenText Fortify | No | Contact Sales | Custom ($50K–$150K+/yr reported) | Custom contract | |
Cycode | No | Contact Sales | Custom | Custom contract | |
HCL AppScan | No | Contact Sales | Custom | Custom contract | |
Aikido Security | Yes (2 users, 10 repos) | $350/mo (Basic, 10 users included) | Custom | Platform fee + per user | |
Arnica | No | Contact Sales | Custom | Custom contract | |
Corgea | No | Contact Sales | Custom | Custom contract |
What this table reveals: The SAST market has a clear pricing gap. At the low end, CodeAnt AI, SonarQube Community, and Semgrep’s free tier let teams start for under $15/user/month or free. At the high end, Checkmarx, Veracode, and Fortify enterprise contracts can exceed $100,000 annually. There is very little in between, most tools are either under $50/user/month or “Contact Sales” with five-figure minimums. This gap means mid-market teams (20–100 developers) often find themselves choosing between tools designed for startups and tools priced for Fortune 500.
Hidden Costs to Watch For
The pricing table above shows sticker prices. Actual SAST costs include several components that do not appear on the invoice but show up in your engineering budget.
Implementation and Onboarding
Enterprise SAST tools, particularly Checkmarx, Fortify, and Veracode, often require professional services for implementation. This includes pipeline integration, scan profile configuration, rule tuning to reduce false positives, SSO/SAML setup, and training for developers and security teams. Implementation costs of $15,000–$50,000 are common for large deployments. Some vendors include basic implementation in the contract; others charge separately.
Modern developer-first tools (CodeAnt AI, Snyk, Semgrep) typically offer self-service onboarding that takes hours rather than weeks. The tradeoff is that you may spend more internal engineering time on initial configuration, but you avoid the professional services line item.
Rule Customization and Tuning
Out-of-the-box SAST rules generate noise. Every tool requires tuning, suppressing false positives, adjusting severity thresholds, and creating custom rules for your codebase’s specific patterns. This tuning is an invisible cost: it consumes security engineer time for the first 2–4 months after deployment.
The key question to ask vendors: how long does it take a typical customer to reach a stable false positive rate? Tools with AI-powered triage (CodeAnt AI, Semgrep Assistant, Snyk DeepCode AI) can reduce this tuning period significantly by automatically suppressing likely false positives.
Tool Sprawl (Running Multiple Overlapping Tools)
The most expensive hidden cost in SAST is not any single tool, it is running multiple overlapping tools simultaneously. Many enterprises end up with SonarQube for code quality, Snyk for SCA, Checkmarx for SAST compliance, and GitHub Advanced Security because it is already in their GitHub Enterprise license. Each tool has its own dashboard, its own alert pipeline, and its own learning curve.
The cost of this sprawl is not just license fees. It is the developer time spent context-switching between dashboards, the security team time spent deduplicating findings across tools, and the organizational friction of maintaining four vendor relationships instead of one. Consolidating to a platform that covers code review, code quality, and security scanning from a single dashboard can reduce total AppSec tooling cost by 30–50% not by paying less per tool, but by eliminating redundant tools entirely. For a deeper look at how consolidation works in practice, see how AI-powered code review replaces multiple overlapping tools.
Calculating SAST ROI
SAST ROI calculations are notoriously difficult because the primary value, vulnerabilities prevented from reaching production, is a counterfactual. You cannot prove that a specific breach would have occurred without SAST. Instead, focus on three measurable cost components where SAST provides direct, observable savings.
Developer Time Saved per False Positive Eliminated
Every false positive a SAST tool generates costs developer time: reading the finding, understanding the code context, determining it is not a real vulnerability, and marking it as suppressed. Industry surveys suggest developers spend 15–30 minutes per false positive, including the context-switching cost of leaving their current work.
Here is the framework to estimate your cost. Take the number of findings your current SAST tool generates per month, multiply by your estimated false positive rate, multiply by the average time per false positive (in hours), and multiply by your blended developer hourly cost.
Example: 500 findings/month × 40% false positive rate × 0.4 hours per false positive × $75/hour = $6,000/month in developer time spent on false positives. A tool that reduces your false positive rate from 40% to 15% saves $3,750/month, $45,000/year, in developer productivity alone.
This is the most defensible ROI argument because it uses numbers your organization already has (finding volume, developer cost) and requires only one estimate (false positive rate, which you can measure by auditing a sample of recent findings).
Cost of Production Vulnerabilities vs. PR-Level Fixes
Fixing a vulnerability at the pull request level, when the developer is actively working on the code, the context is fresh, and the change has not been deployed, is dramatically cheaper than fixing the same vulnerability in production. NIST research and industry experience consistently show that production remediation requires re-learning code context, regression testing, emergency deployment, and sometimes incident response.
Rather than citing a specific multiplier (the commonly quoted “100×” figure from IBM’s Systems Sciences Institute has been questioned for lack of primary source data), use your own organization’s data. Compare the average time to close a vulnerability found in a PR (typically under 1 hour) with the average time to close a vulnerability found in a penetration test or production incident (typically 1–4 weeks including triage, scheduling, fix, review, and deployment). The ratio for your organization is your actual cost multiplier.
SAST tools that operate at the PR level, providing inline findings and fix suggestions before code is merged, shift vulnerability discovery to the cheapest remediation point. Tools that only scan main branches or run periodic scans miss this window.
Consolidation Savings
If your organization currently runs multiple security and code quality tools, calculate the fully loaded cost of the current stack: license fees for each tool, the proportion of security engineer time spent managing each tool, developer time spent in each tool’s dashboard, and integration maintenance cost.
Then compare against a consolidated platform that covers the same capabilities. The license fee comparison is straightforward. The hidden savings are in reduced management overhead (one vendor relationship, one dashboard, one alert pipeline) and reduced developer context-switching (one place to look for findings instead of four).
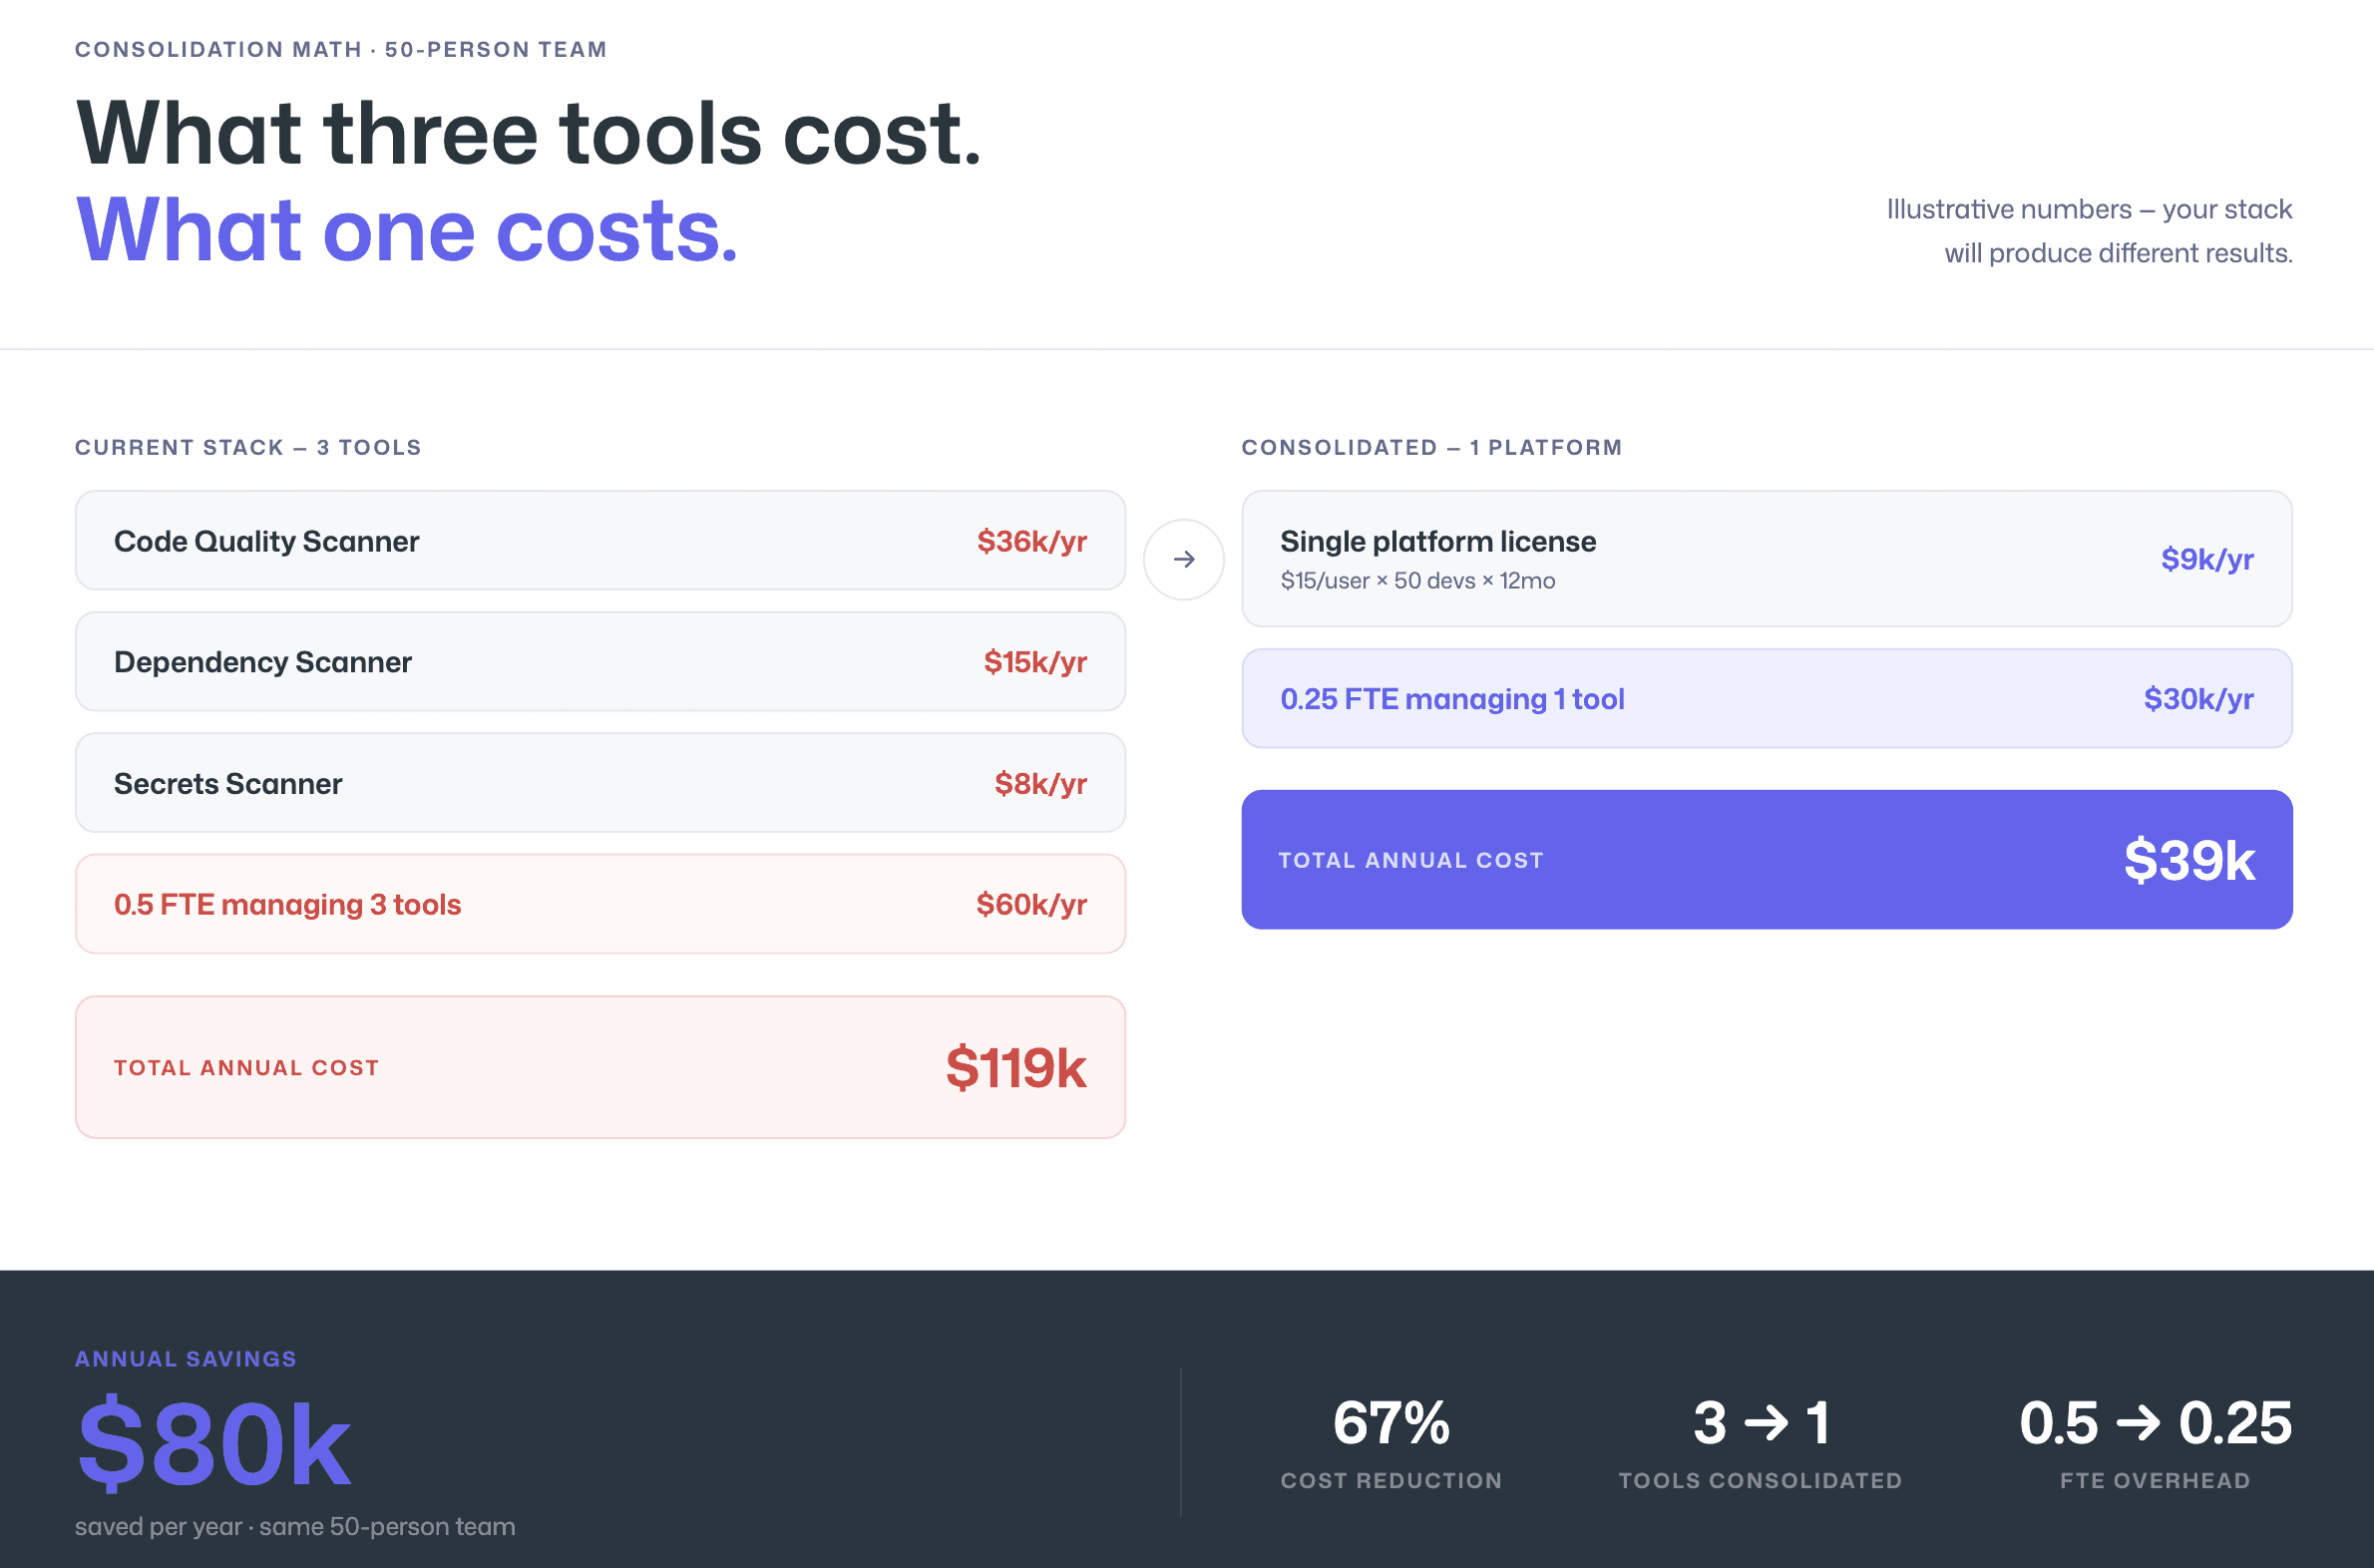
Example framework (use your own numbers):
Current stack: SonarQube Enterprise ($36K/yr) + Snyk Team ($25/dev × 50 devs × 12mo = $15K/yr) + secrets scanner ($8K/yr) = $59K/yr in license fees, plus 0.5 FTE security engineer managing three tools ($60K/yr burdened) = $119K/yr total.
Consolidated alternative: Single platform at $15/user/mo × 50 devs × 12mo = $9K/yr, plus 0.25 FTE managing one tool ($30K/yr burdened) = $39K/yr total.
Delta: $80K/yr. These numbers are illustrative, your stack and team size will produce different results, but the consolidation math is real and measurable.
For a detailed comparison of how SonarQube pricing compares to modern alternatives, see SonarQube alternatives.
CodeAnt AI Pricing
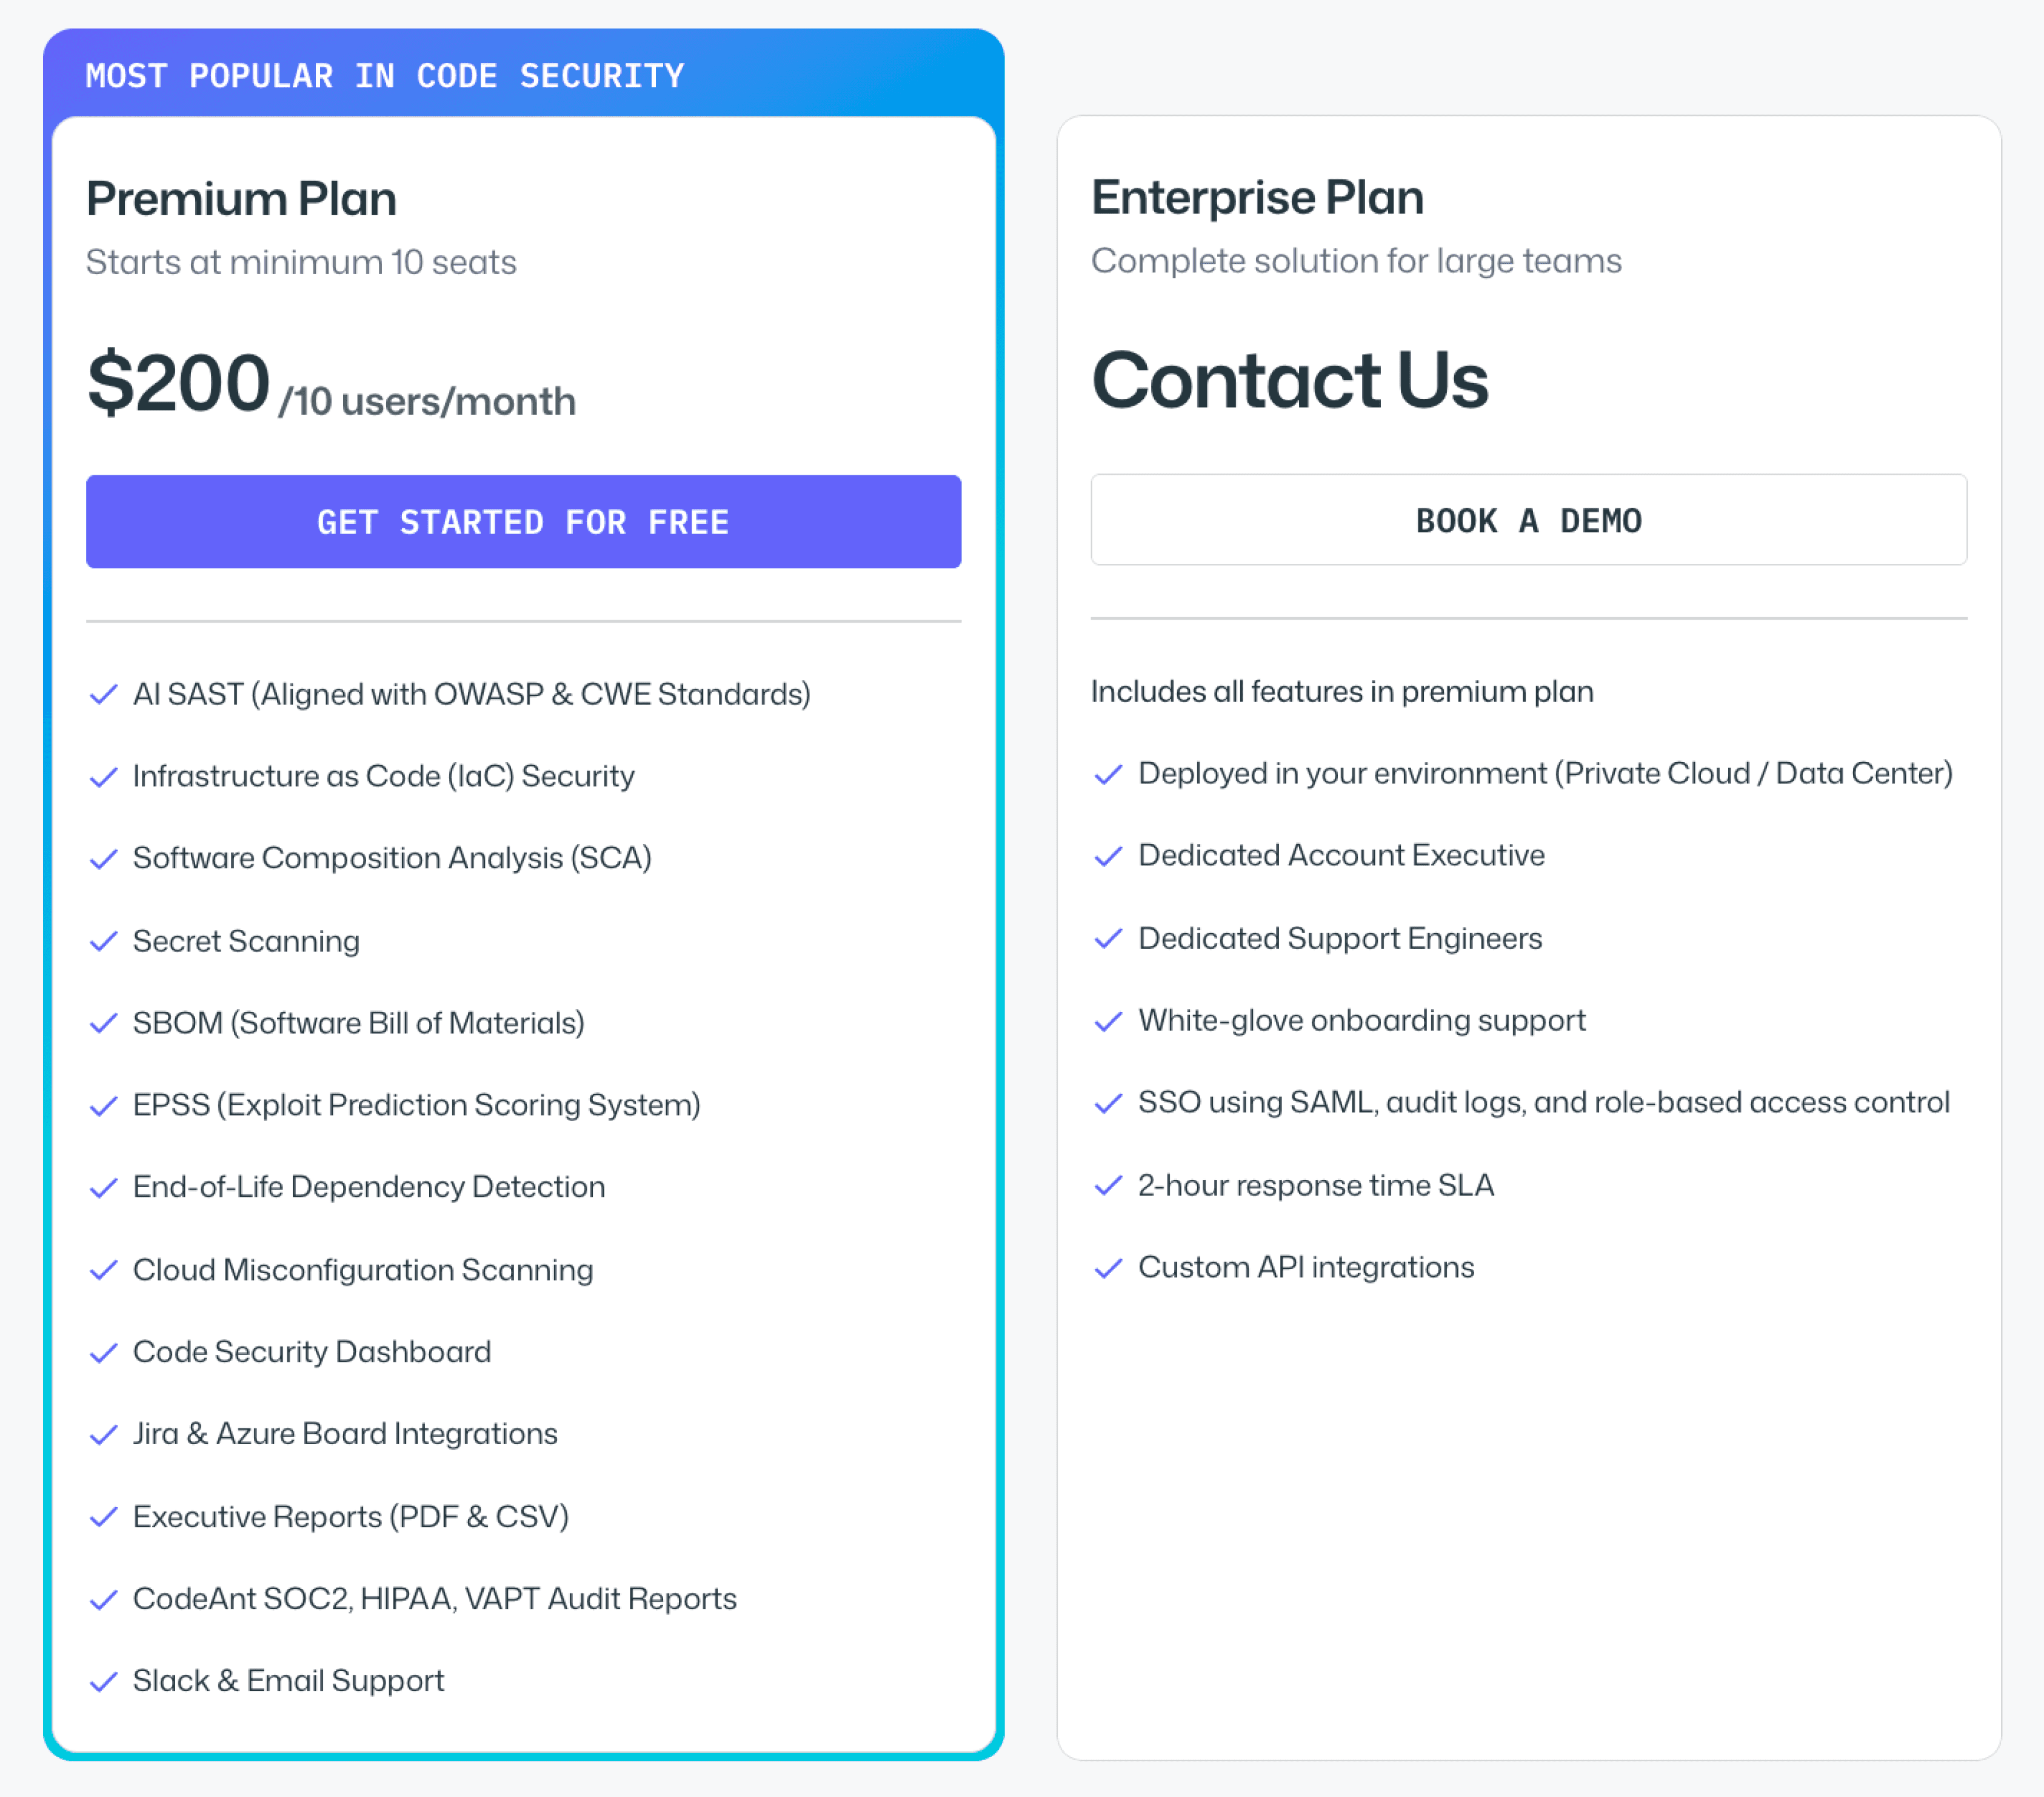
CodeAnt AI publishes its pricing directly, no “Contact Sales” required for standard plans.
AI Code Review starts at $24 per user per month. This includes AI-powered PR reviews, code quality analysis, and auto-fix suggestions across GitHub, GitLab, Azure DevOps, or Bitbucket.
Code Security (SAST + SCA + Secrets + IAC + SBOM) starts at $20 per user per month. This adds static application security testing, software composition analysis with EPSS-based prioritization, secrets detection, and infrastructure-as-code scanning, all surfaced as inline PR comments with Steps of Reproduction and one-click fixes.
Enterprise plans with custom pricing are available for organizations that need SSO/SAML, dedicated support, custom integrations, or specific deployment configurations.
That per-user price includes the full end-to-end security workflow:
CLI and pre-commit hooks for shift-left secret prevention
IDE integration (VS Code, JetBrains, Cursor, Windsurf) for in-context scanning with AI-prompted fixes
PR-native AI code review and security analysis with one-click fixes
CI/CD policy gates across all major pipeline platforms
SecOps dashboard with vulnerability trends, OWASP/CWE/CVE mapping
remediation tracking via Jira and Azure Boards
audit-ready compliance reporting
Final Verdict on SAST Pricing
SAST pricing is not just about the sticker price. It is about the pricing model, the hidden operational costs, the false positive burden, and the number of overlapping tools you are paying for.
Per-LOC tools can spike as your codebase grows. Enterprise contracts can exceed six figures before negotiation. Tool sprawl quietly doubles your AppSec budget.
The real decision is this: do you want another isolated scanner, or a consolidated platform that replaces multiple tools and reduces developer friction?
If you want transparent pricing, predictable per-user costs, and a platform that combines AI code review, SAST, SCA, secrets, and IaC scanning in one workflow, evaluate it directly.
See CodeAnt AI pricing. The numbers speak for themselves.
FAQs
How much does a SAST tool cost in 2026?
Is per-user pricing better than per-LOC pricing for SAST?
Why are enterprise SAST tools so expensive?
What hidden costs should teams consider when buying SAST?
How do you calculate ROI for a SAST tool?


