AI Code Review
The Promise and Peril of DORA Metrics

Sonali Sood

Founding GTM, CodeAnt AI
Your DORA metrics probably look fine. Your dashboard is green. Your deploy frequency looks “healthy.”
And yet…
Your PRs are rotting in review queues.
Your best engineers are burning out quietly.
Your codebase is aging faster than you think.
Your team feels “busy” but nothing feels fast.
This is the uncomfortable truth:
DORA can say everything is working… while your engineering system is quietly drifting toward chaos.
High-performing teams aren’t better because they stare harder at four metrics.
They’re better because they know what DORA doesn’t show:
Where velocity is actually dying
Where quality is quietly collapsing
Where developers are bleeding time and focus
If you’ve ever felt this gap between what your dashboard says and what your team feels, this blog is for you. Let’s expose the blind spots.
Common Blind Spots of DORA Metrics
While DORA metrics excel at highlighting throughput and reliability outcomes, they miss key dimensions of engineering performance. Understanding these blind spots helps you know when not to lean on DORA alone:
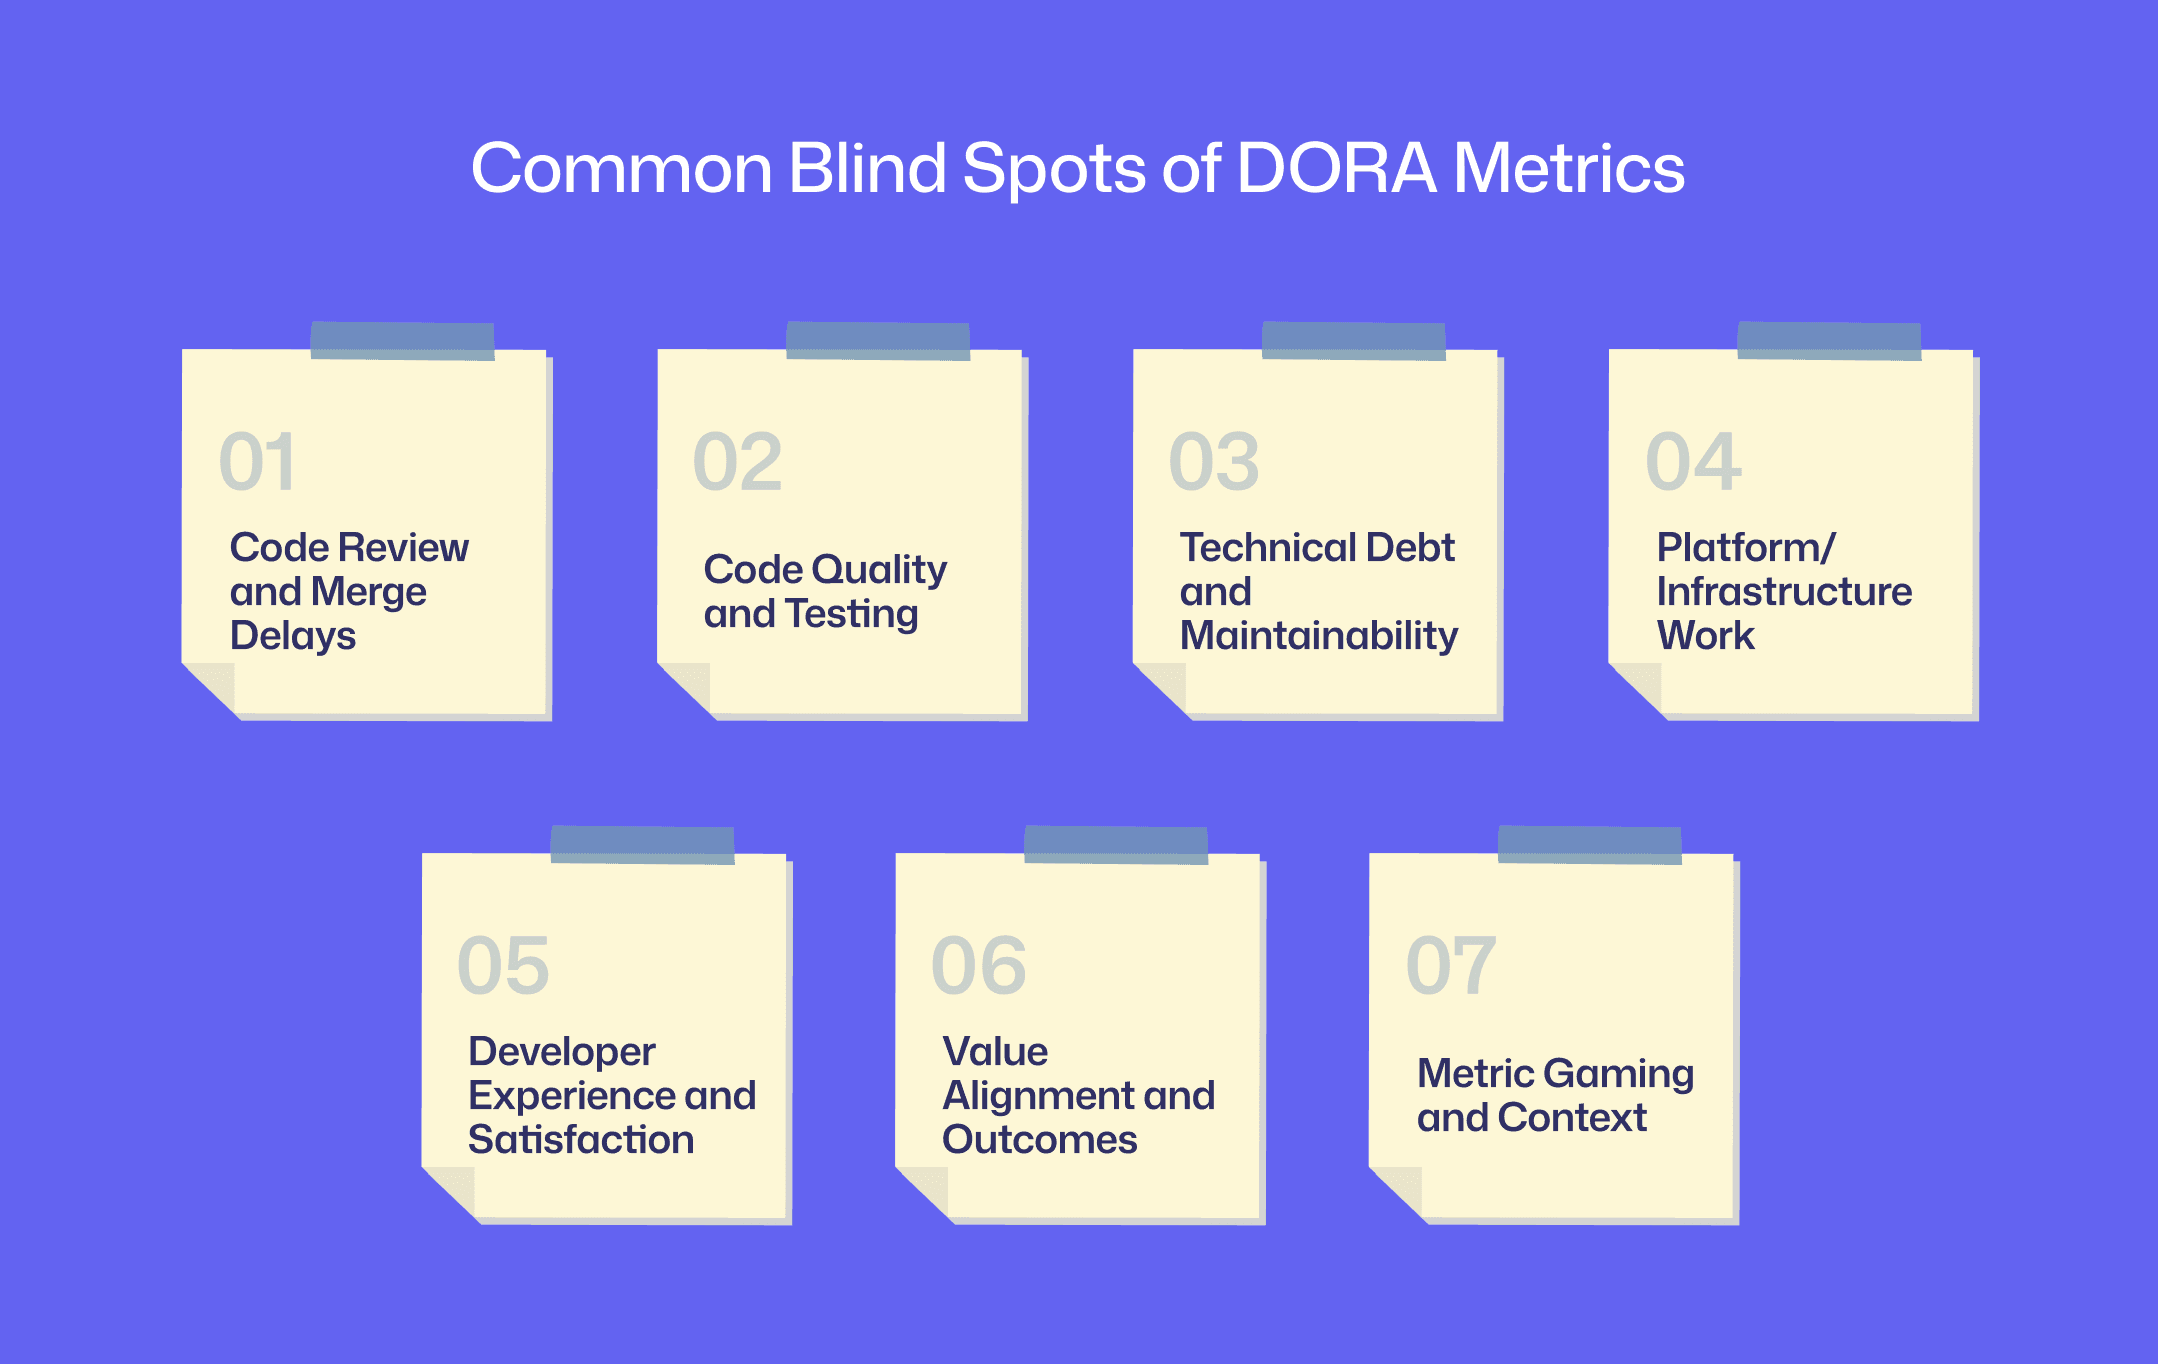
1. Code review and merge delays
DORA measures from commit to production, but ignores time code waits in reviews. Long review queues or slow approvals hurt velocity without affecting DORA values. That said, teams should also measure review metrics like time-to-first-review and PR cycle time to spot bottlenecks. (For example, CodeAnt’s dashboard tracks PR cycle time, review response time, and approval delays to expose hidden wait times.)
2. Code quality and testing
DORA doesn’t reflect what’s inside the code. A team may deploy often (high deployment frequency) but ship poor quality or untested code. Code review metrics or static analysis are needed to ensure code health. Indeed, industry leaders urge tracking test coverage and code quality directly. Google’s DORA documentation itself recommends, “measure how long code reviews take or the quality of your tests” as leading indicators for delivery health. Without these, a team could build up crippling technical debt while DORA numbers look fine.
3. Technical debt and maintainability
DORA metrics are silent on accumulated debt. If teams cut corners, swap to legacy frameworks, or accumulate cruft, DORA won’t flag it – the only impact would be if a change actually fails in production. That said, “Tech debt is invisible to DORA metrics. Unless that debt causes failed releases, all the cruft in the world won’t hurt your DORA numbers.” In practice, this means a stable but outdated system can have great DORA scores while veering toward a maintenance crisis.
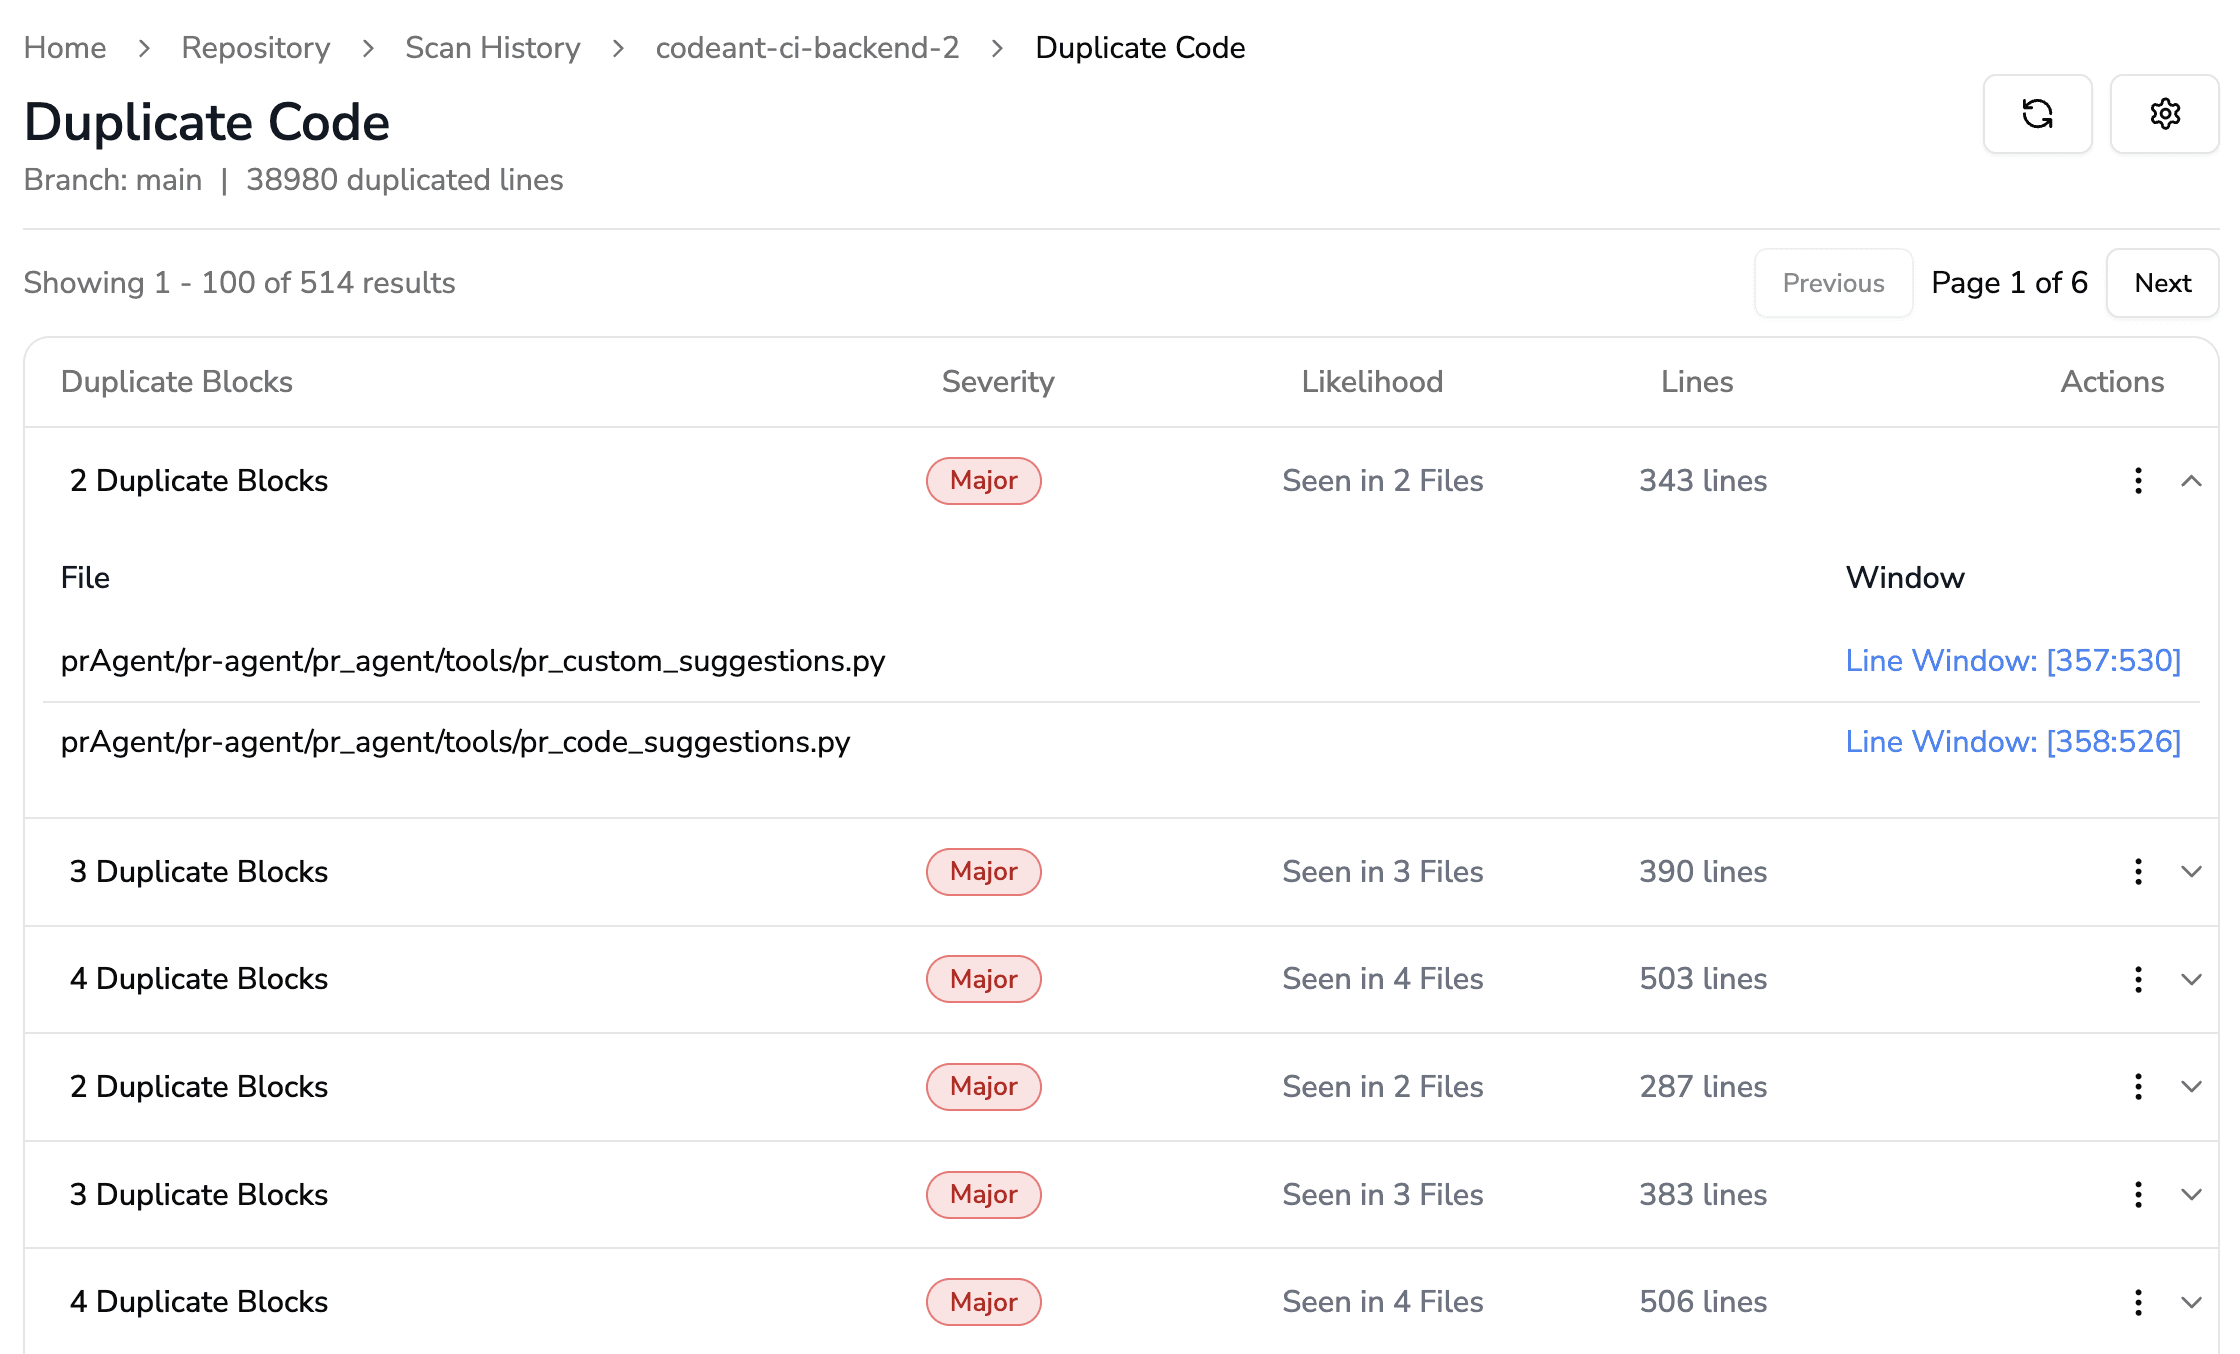
Tracking maintainability metrics (e.g. code complexity, duplication) or debt ratios is essential to reveal this risk.
4. Platform/infrastructure work
Teams doing non-feature work, building dev platforms, refactoring, or improving infrastructure, won’t see much change in DORA metrics, since the deploy cadence or fail rate may not move. That said, platform engineering tasks (like standardizing config or improving dev tooling) “might not affect DORA metrics whatsoever” even as developer experience dramatically improves. In these cases DORA data can misleadingly make the team look stagnant. Leaders should measure platform impact differently (e.g. internal user surveys, platform adoption rate) rather than penalize them for lower deploy frequencies.
5. Developer experience and satisfaction
DORA includes no measure of how engineers feel. A dip in deployment frequency, for instance, could mean burnout or poor tools rather than a process issue. That said, developer satisfaction is itself a key productivity driver: high-performing organizations “consistently correlate with high developer satisfaction scores”. And McKinsey’s SPACE framework explicitly adds satisfaction and well-being to supplement DORA’s focus on process metrics. Ignoring these human factors can lead to churn and disengagement, even if deployments are fast.
6. Value alignment and outcomes
DORA metrics measure delivery, not value. A team could push 10 features a day (great DORA scores) but if they are the wrong features, business value suffers. That said, DORA tells you “how” but not “what” is being built. Leaders need metrics that tie engineering to business outcomes (customer satisfaction, feature usage, ROI) to ensure teams are doing the right work, not just working fast.
7. Metric gaming and context
All metrics can be gamed if misused. Goodhart’s Law warns: when a measure becomes a target, it ceases to be effective. Over-emphasizing DORA numbers can have perverse effects, e.g. pushing many trivial deployments (inflating frequency) or rushing changes (raising failure rate and debt). Moreover, DORA values must be interpreted in context: a 24-hour deployment frequency at a legacy banking system isn’t comparable to a microservices startup, yet differences are often misinterpreted.
To avoid these pitfalls, teams should use DORA as a directional guide, not an absolute goal, and always consider the underlying context of the system and workload.
What to Track Alongside (or Instead of) DORA
Because DORA metrics skip over these blind spots, engineering leaders should supplement them with additional, complementary metrics. Here are key dimensions to monitor:
1. Code Review and Delivery Velocity
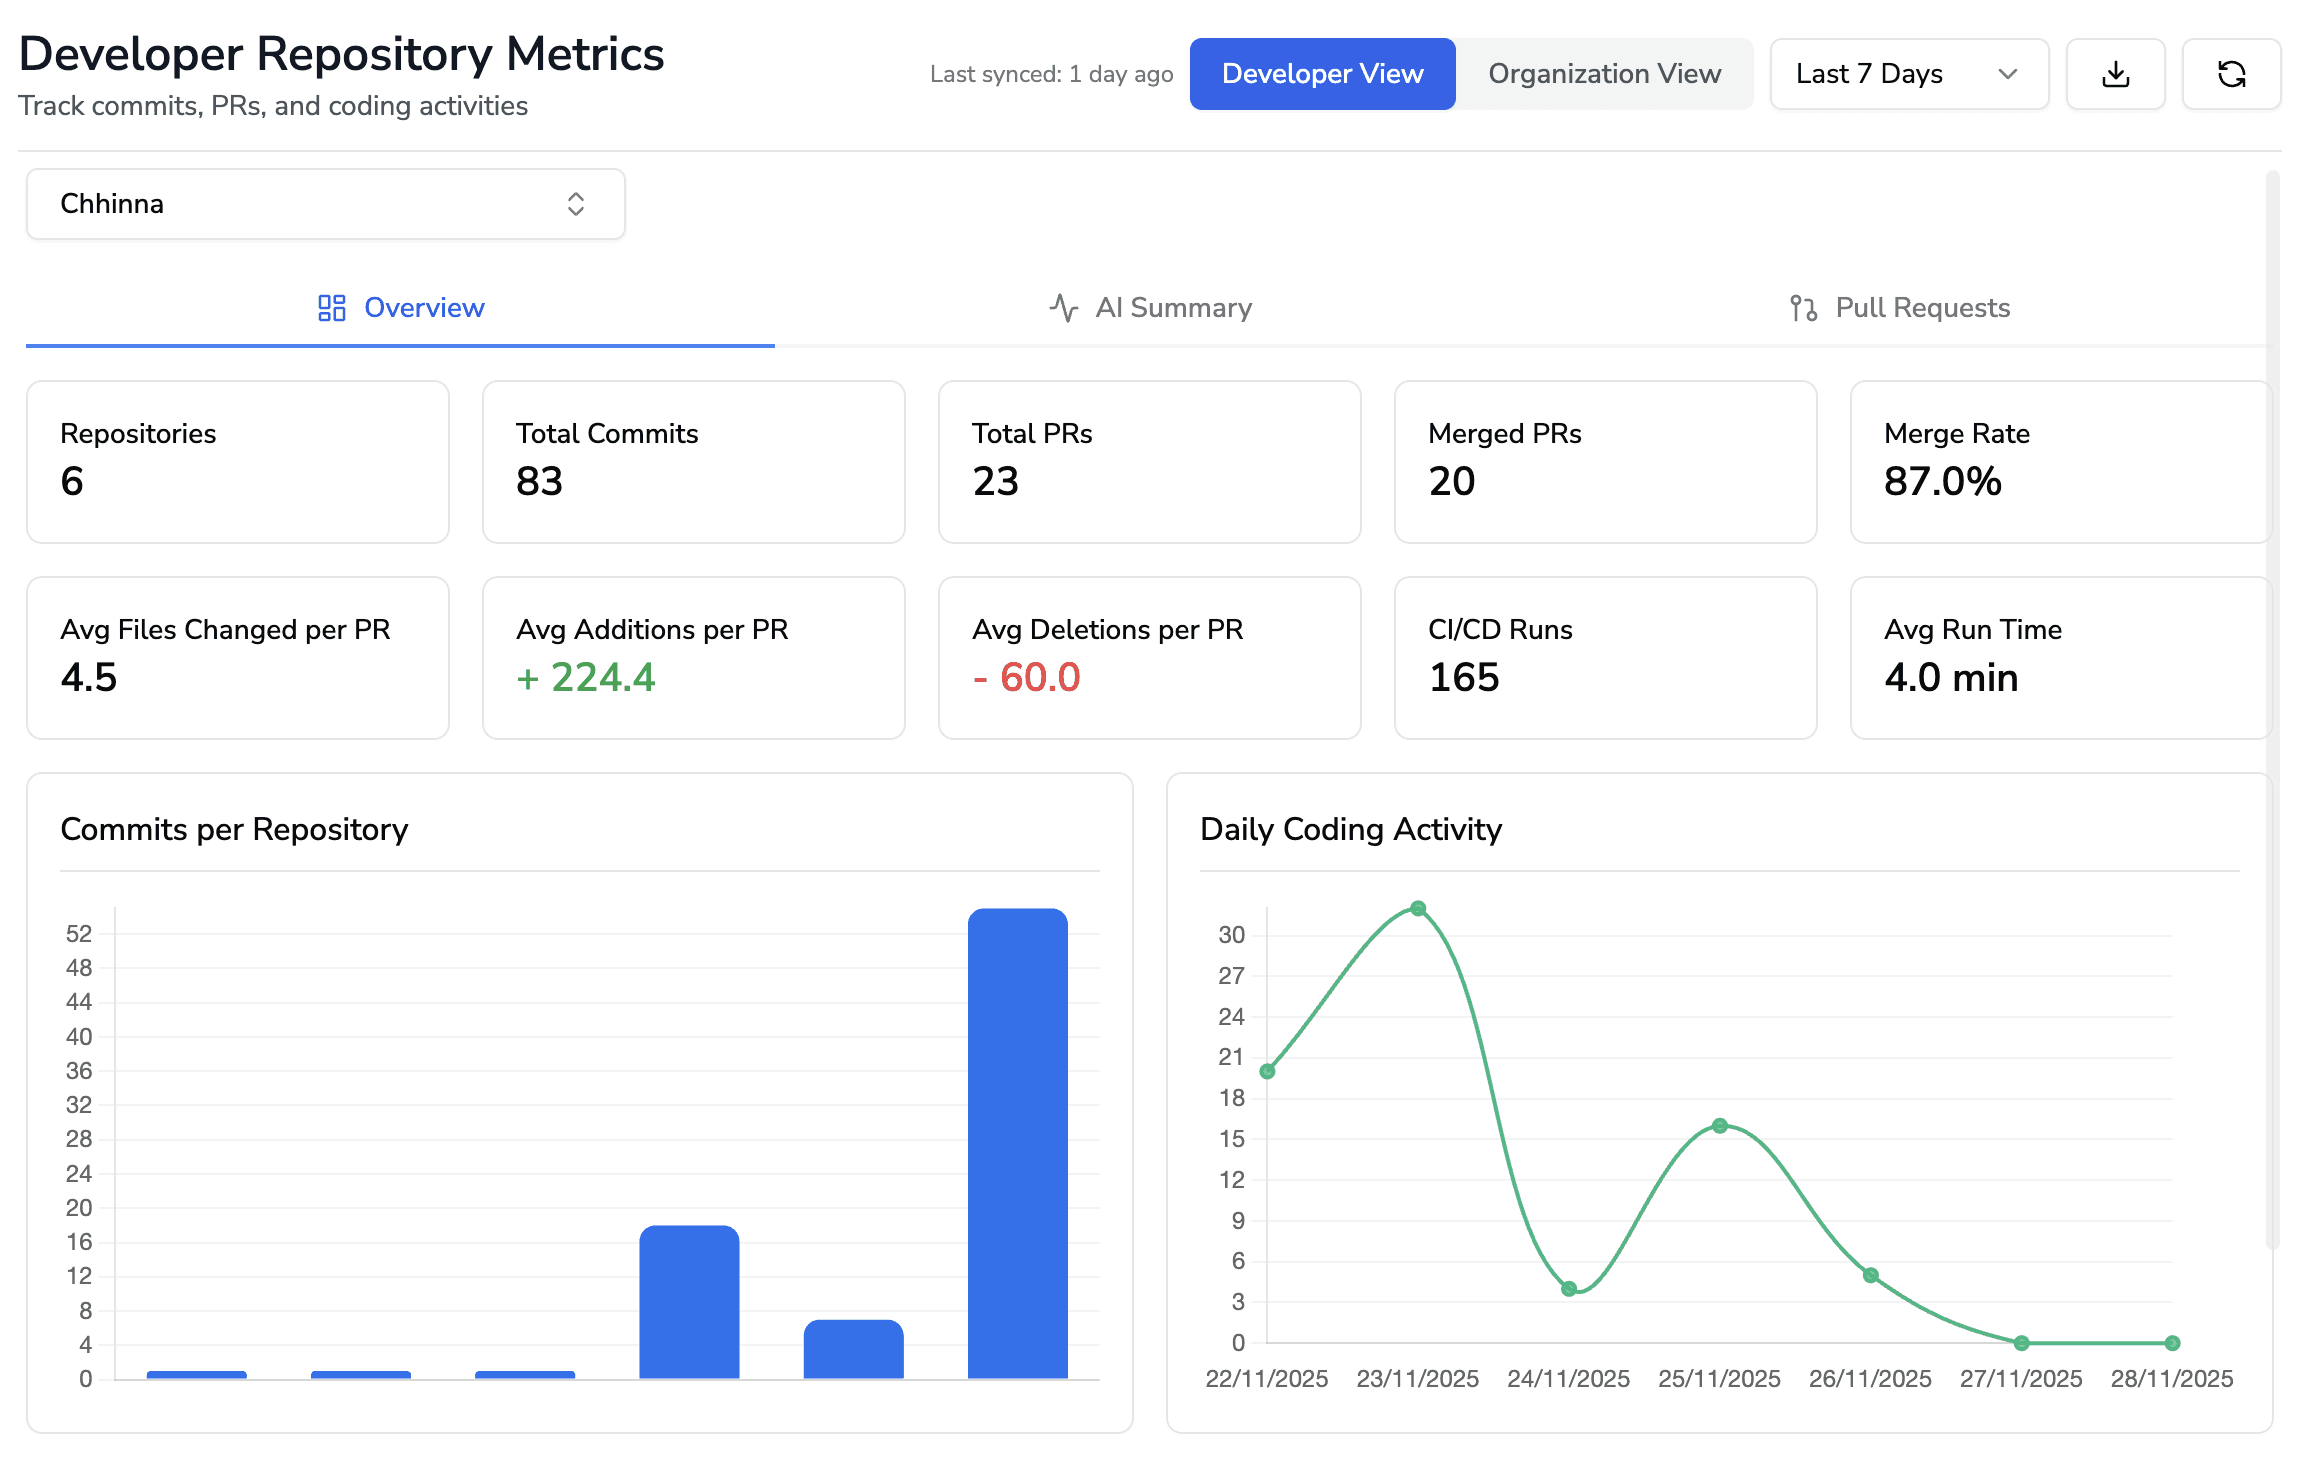
Beyond deployment frequency and lead time, measure pull request (PR) cycle time, first-response time, and review participation. For example, track the average time from PR creation to first review comment, and PR merge time. CodeAnt’s Developer Productivity dashboard, for instance, includes PR cycle time and review response metrics to expose bottlenecks. The DORA guide itself suggests measuring “how long code reviews take” as a leading indicator. Focused review metrics prevent hidden slowdowns in the pipeline.
Related doc: https://docs.codeant.ai/engineering_productivity/dev_metrics
2. Code Quality and Test Coverage
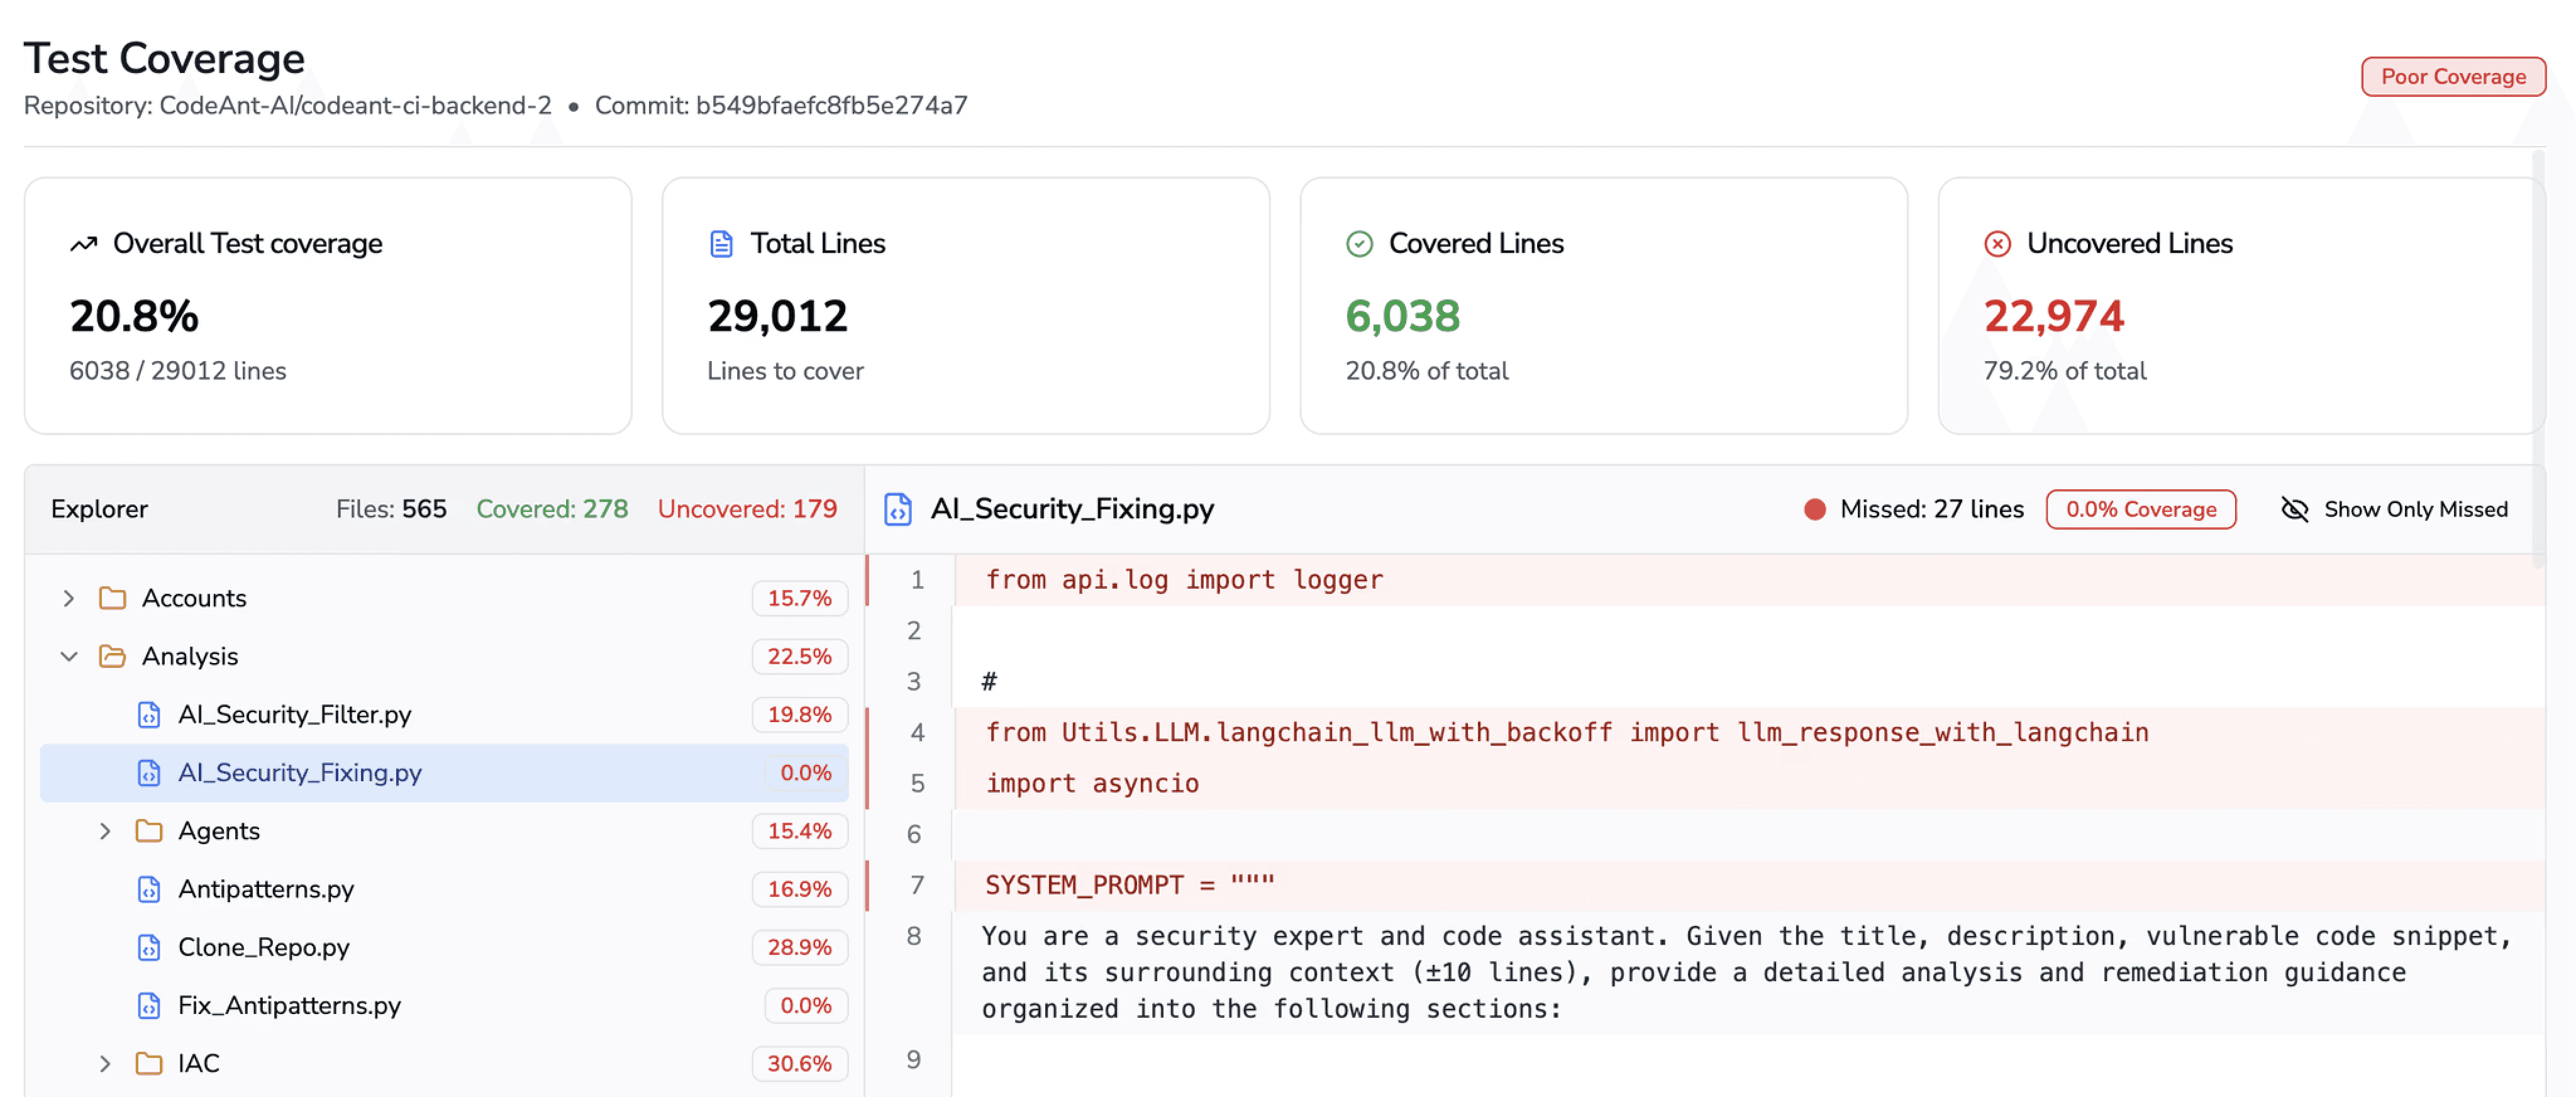
Quantify the quality of code with static analysis scores (e.g. code maintainability, complexity, duplication) and track test coverage. Low coverage or mounting code smells often precede stability issues and technical debt. CodeAnt’s Code Quality platform shows metrics like maintainability, complexity, duplication, and test coverage to highlight debt across repos. It even blocks deployments when coverage thresholds drop, enforcing quality gates. By measuring coverage and security issues per PR, teams get immediate feedback on code health that DORA misses.
3. Technical Debt Visibility
Track metrics that reflect debt buildup. This could include churn metrics (how often recently touched code is reworked), number of static-analysis violations, or a “debt ratio” from tools like SonarQube. CodeAnt’s code scanning continually surfaces risky diffs and security issues, mapping them to contributors to guide fixes. Similarly, measuring trends in code maintainability or duplication (as CodeAnt’s AI Code Analysis does) gives visibility into growing debt over time.
Related read:
Are Your Code Reviews Helping or Hurting Delivery?
4. Developer Experience and Satisfaction
Measure team sentiment and health. Run periodic developer surveys (eNPS), track feature requests for new tools, and monitor burnout indicators. That said, the best predictor of engineering excellence is developer satisfaction. SPACE metrics add layers like well-being, communication, and collaboration that DORA doesn’t capture. Metrics such as mean time in focus mode vs. context-switching, number of interruptions, or even quantitative feedback (pride, stress levels) help close the loop on team morale. High satisfaction often precedes better code and innovation, so treat it as a leading metric, not an afterthought.
5. Alignment and Business Impact
Connect engineering output to outcomes. Track KPI-aligned metrics like time to market for critical features, customer-reported defect rates, or usage/engagement of new releases. For example, monitor release adoption or customer satisfaction scores alongside deployment cadence. This ensures teams don’t optimize DORA at the expense of value. McKinsey stresses aligning metrics with business goals and using “opportunity-focused” indicators to identify high-impact improvements.
6. Reliability and Risk
In addition to DORA’s MTTR and change-fail rate, use site-reliability metrics (SLIs/SLOs) like error budgets or uptime percentages. Monitoring error rates and latency from the user’s perspective, which captures issues DORA’s per-deployment view might not. If a service has a 99.9% availability SLO, track the burn rate of the error budget, a meaningful risk metric beyond simple counts of incidents.
Using these broader metrics gives a richer, actionable picture.
For instance, a sudden spike in PR review time or a drop in test coverage might explain why lead time worsened, something DORA alone cannot pinpoint. Developer surveys or focus-time analysis might reveal dissatisfaction that could otherwise drive turnover and degrade performance.
By combining quantitative data (cycle times, code metrics) with qualitative signals (surveys, incident retrospectives), engineering leaders can see both the machine (process) and the human (people) sides of performance.
How CodeAnt AI Fills the Gaps
Tools and platforms have evolved to address these blind spots, and CodeAnt AI is built precisely to round out the view beyond DORA. Here’s how CodeAnt’s platform complements and extends DORA metrics:
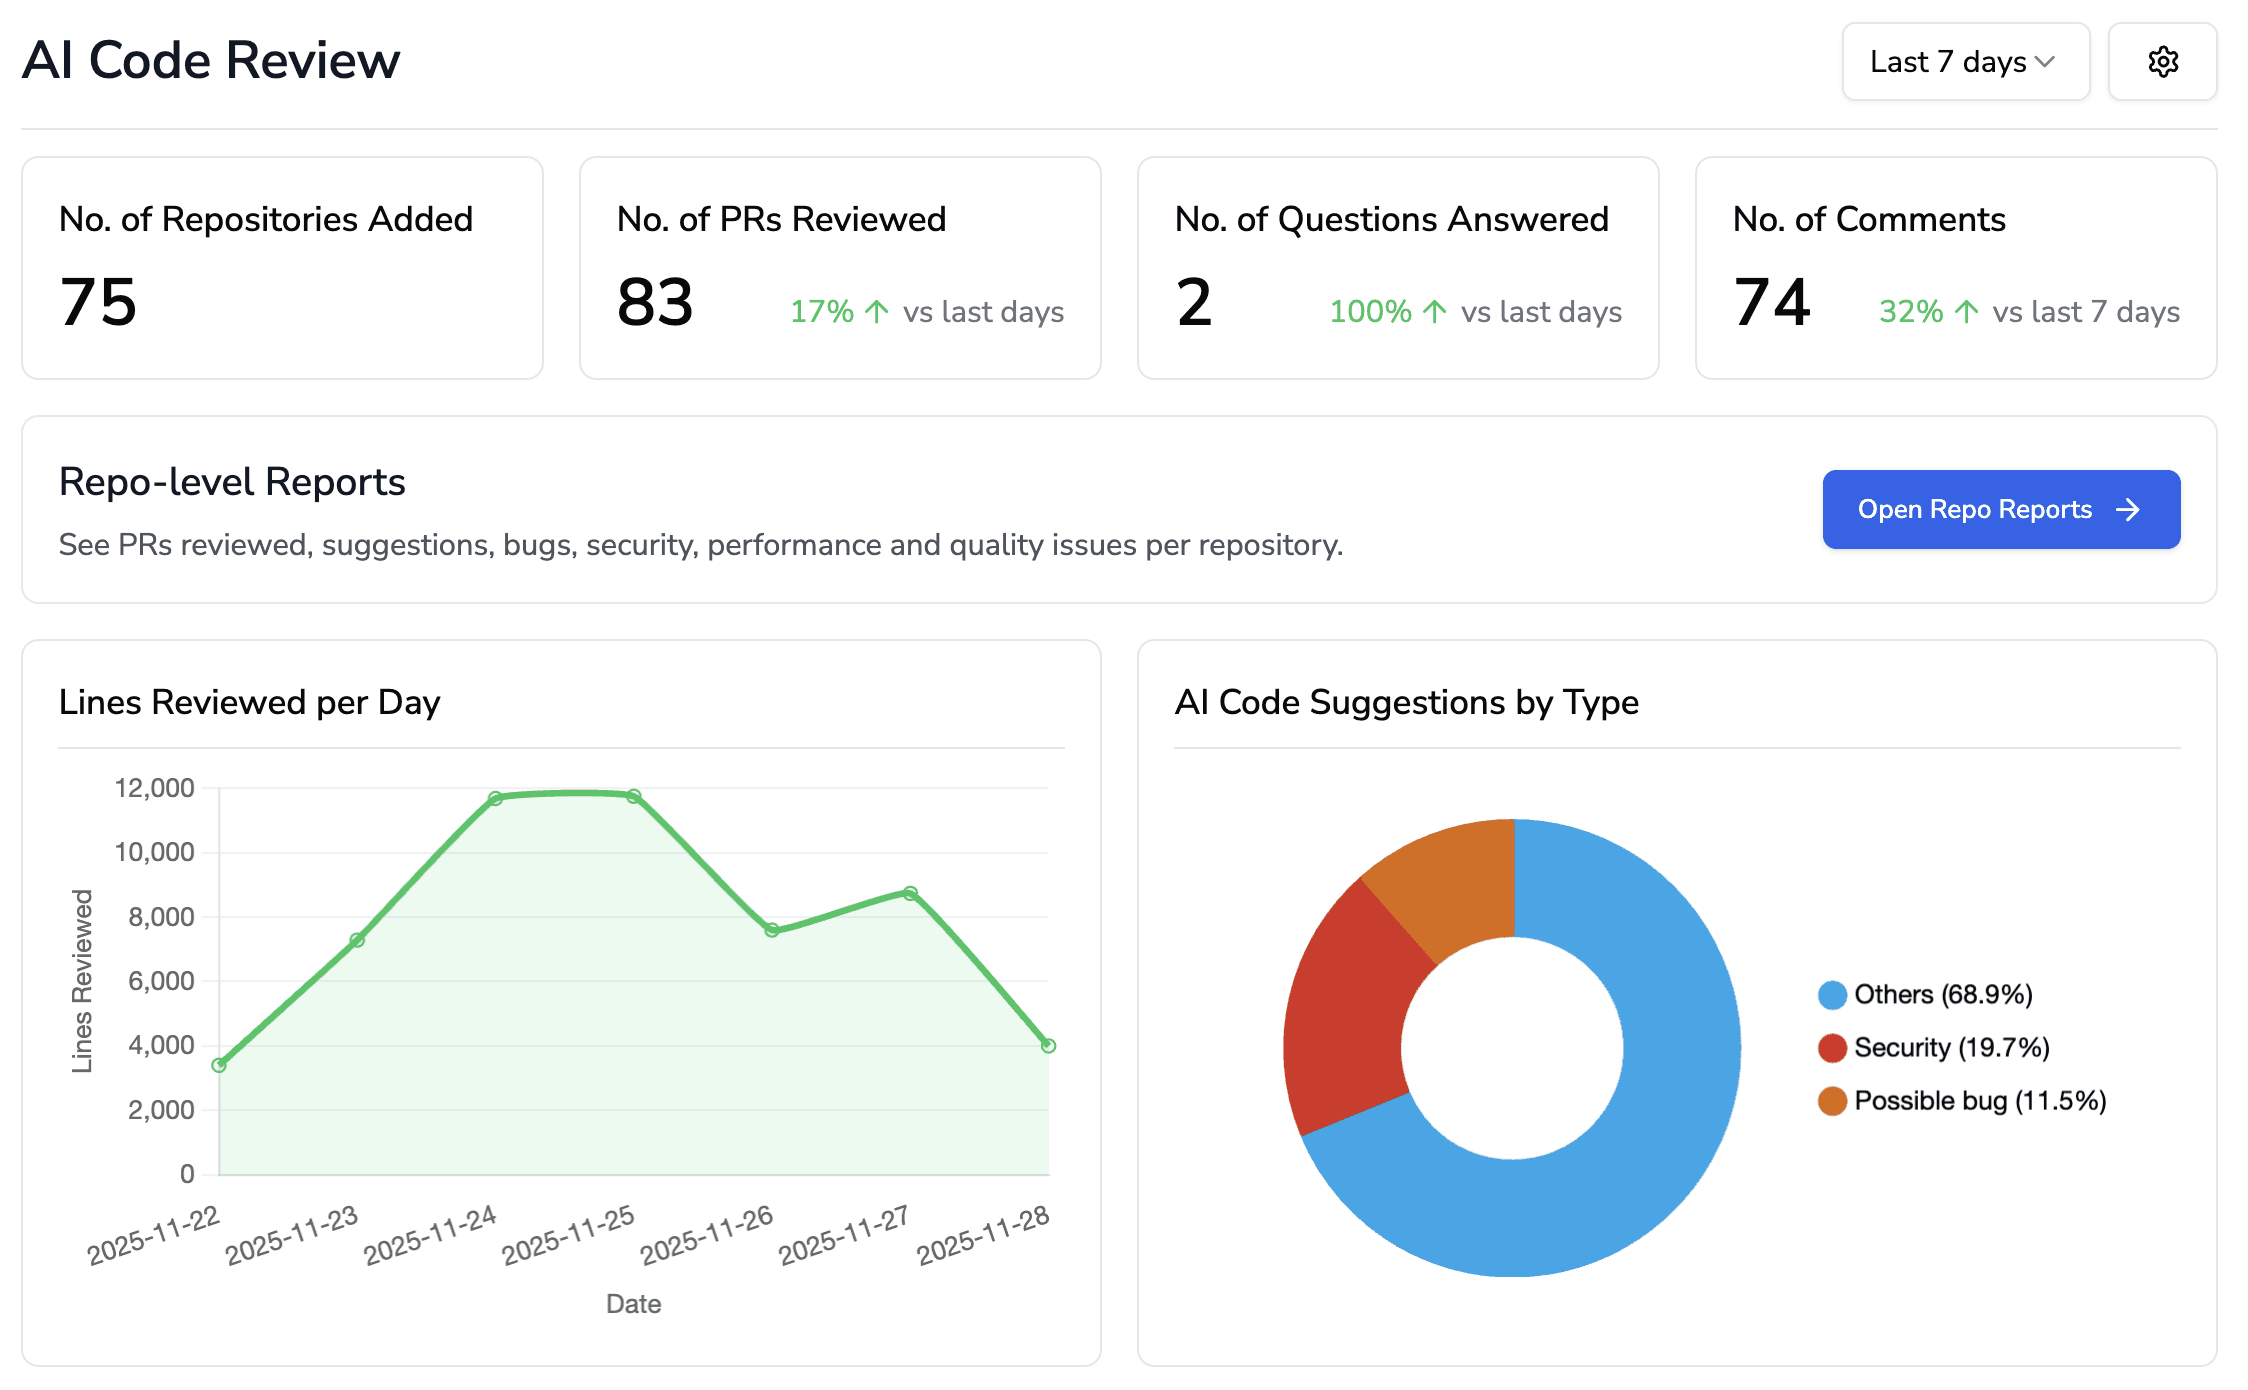
1. Review-Velocity and Developer Analytics
CodeAnt automatically tracks detailed PR metrics. Its Developer Productivity dashboards report PR cycle time (from creation to merge), time to first review/approval, review depth, and reviewer participation. This surfaces review bottlenecks and workflow variances.
For example, organizations using CodeAnt see alerts when certain reviewers or teams are overloaded, enabling managers to rebalance workloads. CodeAnt can even break out metrics by team or developer, helping leaders spot who needs help rather than using PR stats as a personal scorecard.
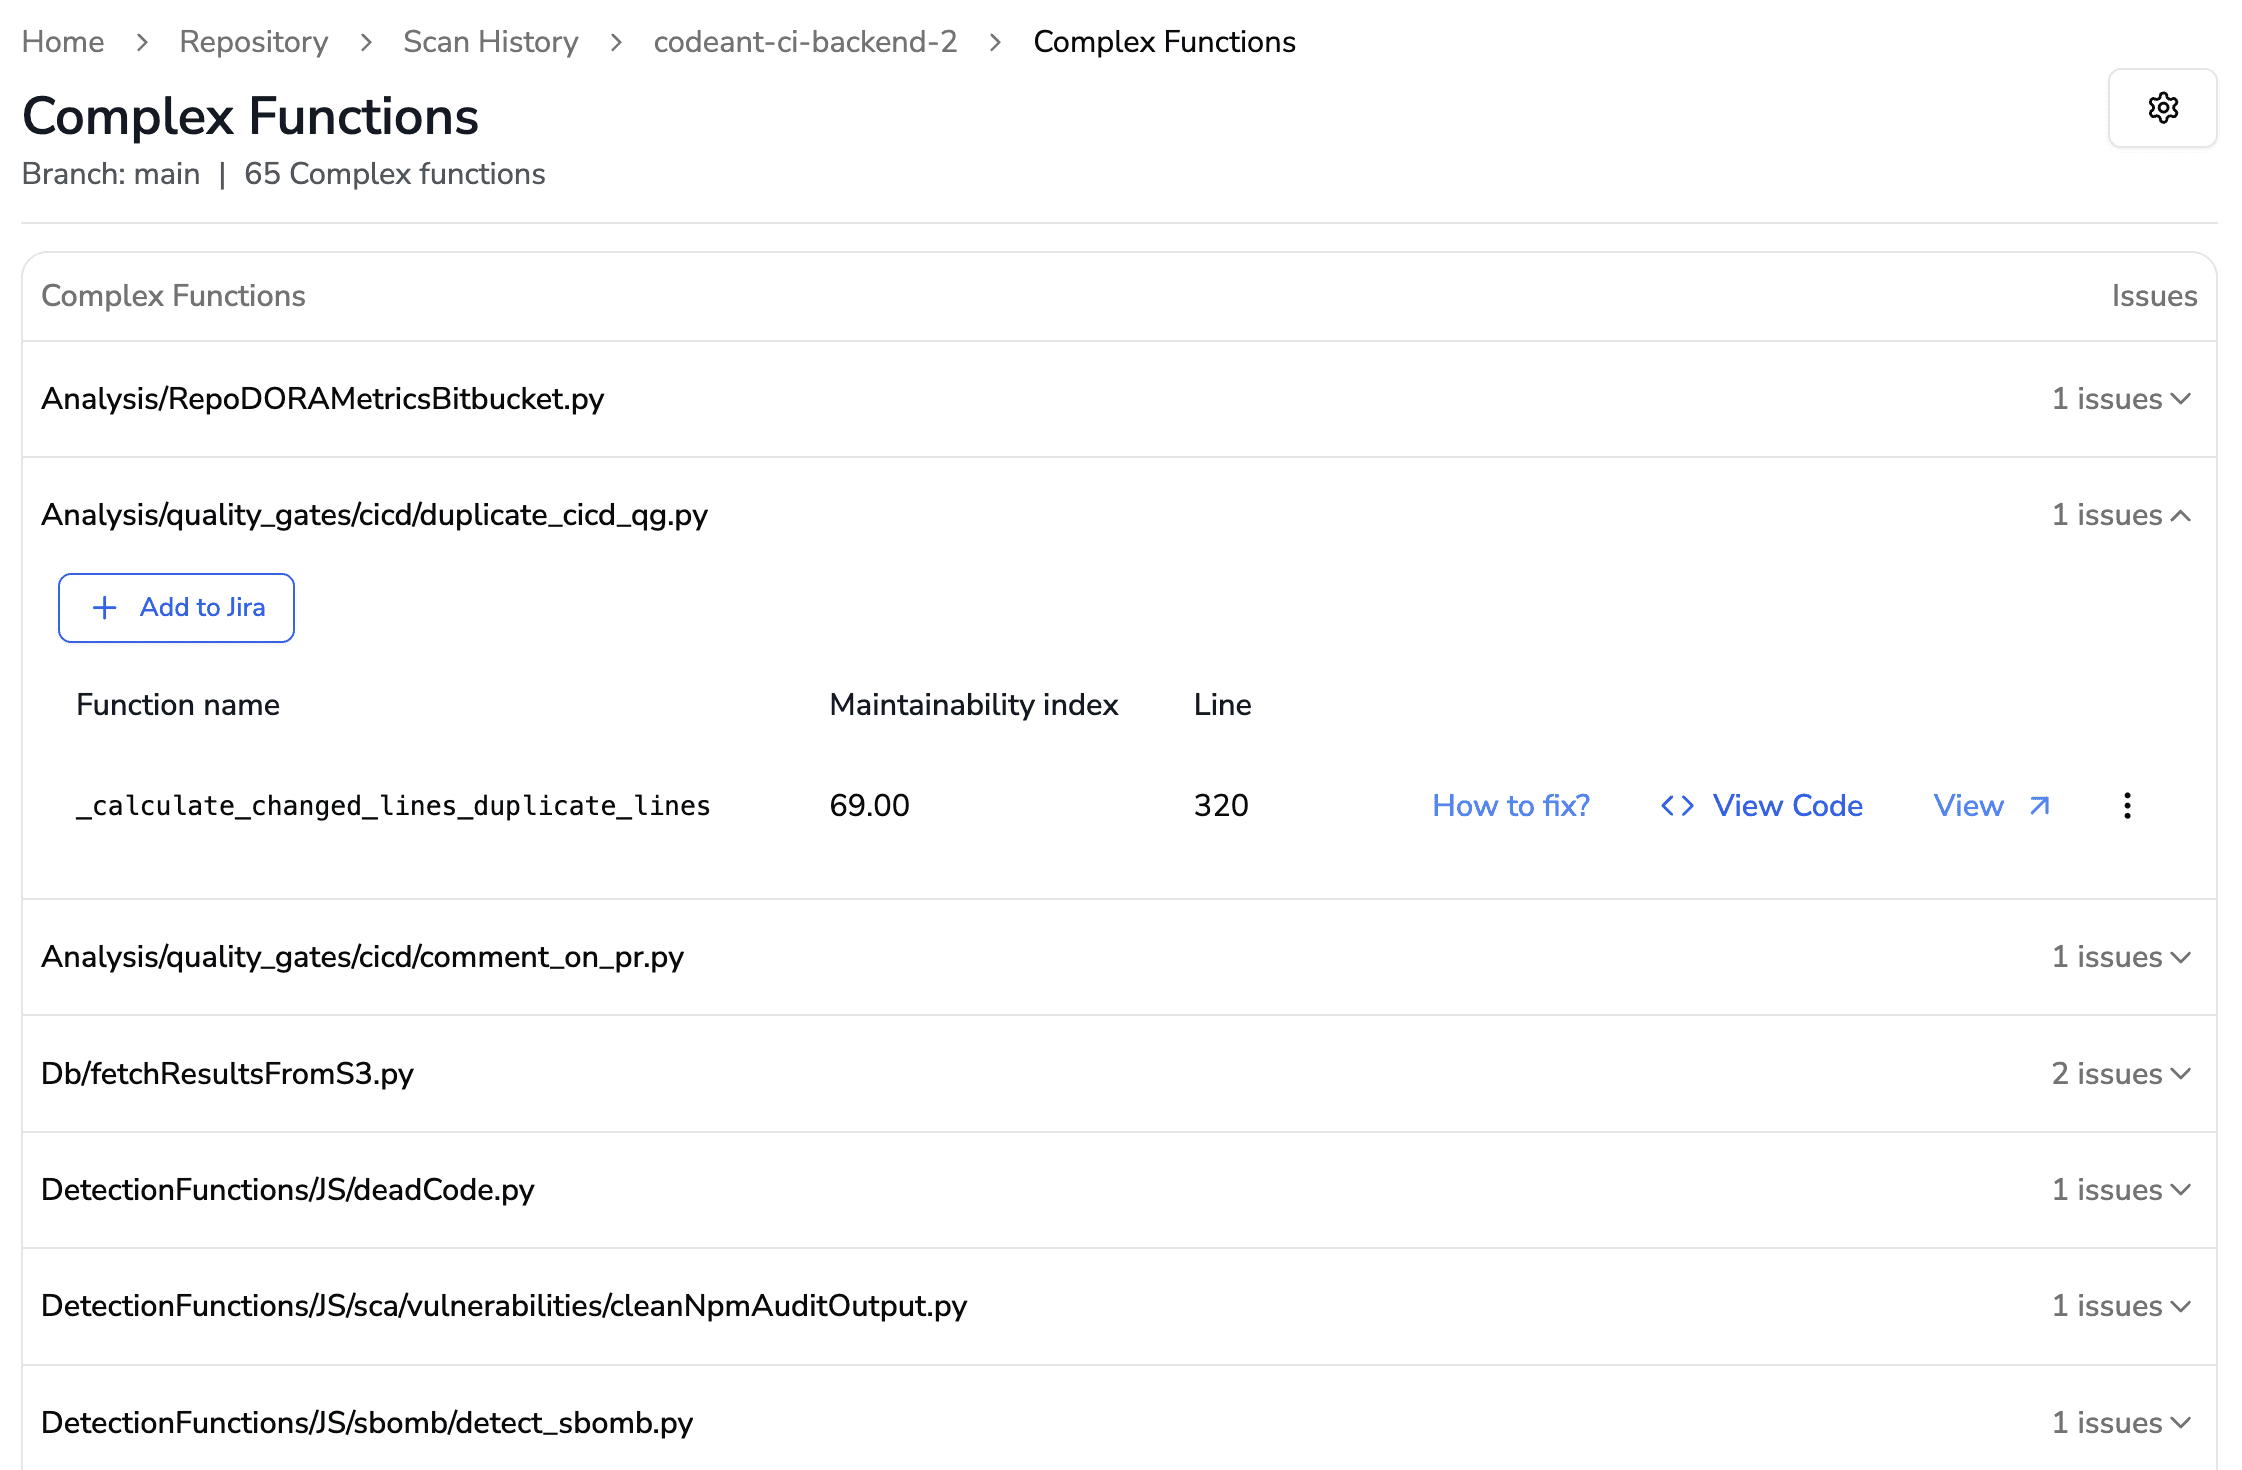
2. Continuous Code Quality & Risk Scoring
Every pull request in CodeAnt is automatically scanned for quality, security, and compliance issues. CodeAnt’s Code Quality module computes maintainability, cyclomatic complexity, duplication and test coverage metrics across your repos. It highlights risky diffs and “hot spots” of tech debt, reducing noise so engineers focus on real problems.
By integrating static analysis into the pipeline, CodeAnt enforces quality gates and even fails PRs if critical issues or low coverage are detected. The result is an ongoing visibility of code health: leaders get automated dashboards of coverage trends, security exposure, and code smell counts, making technical debt explicit.
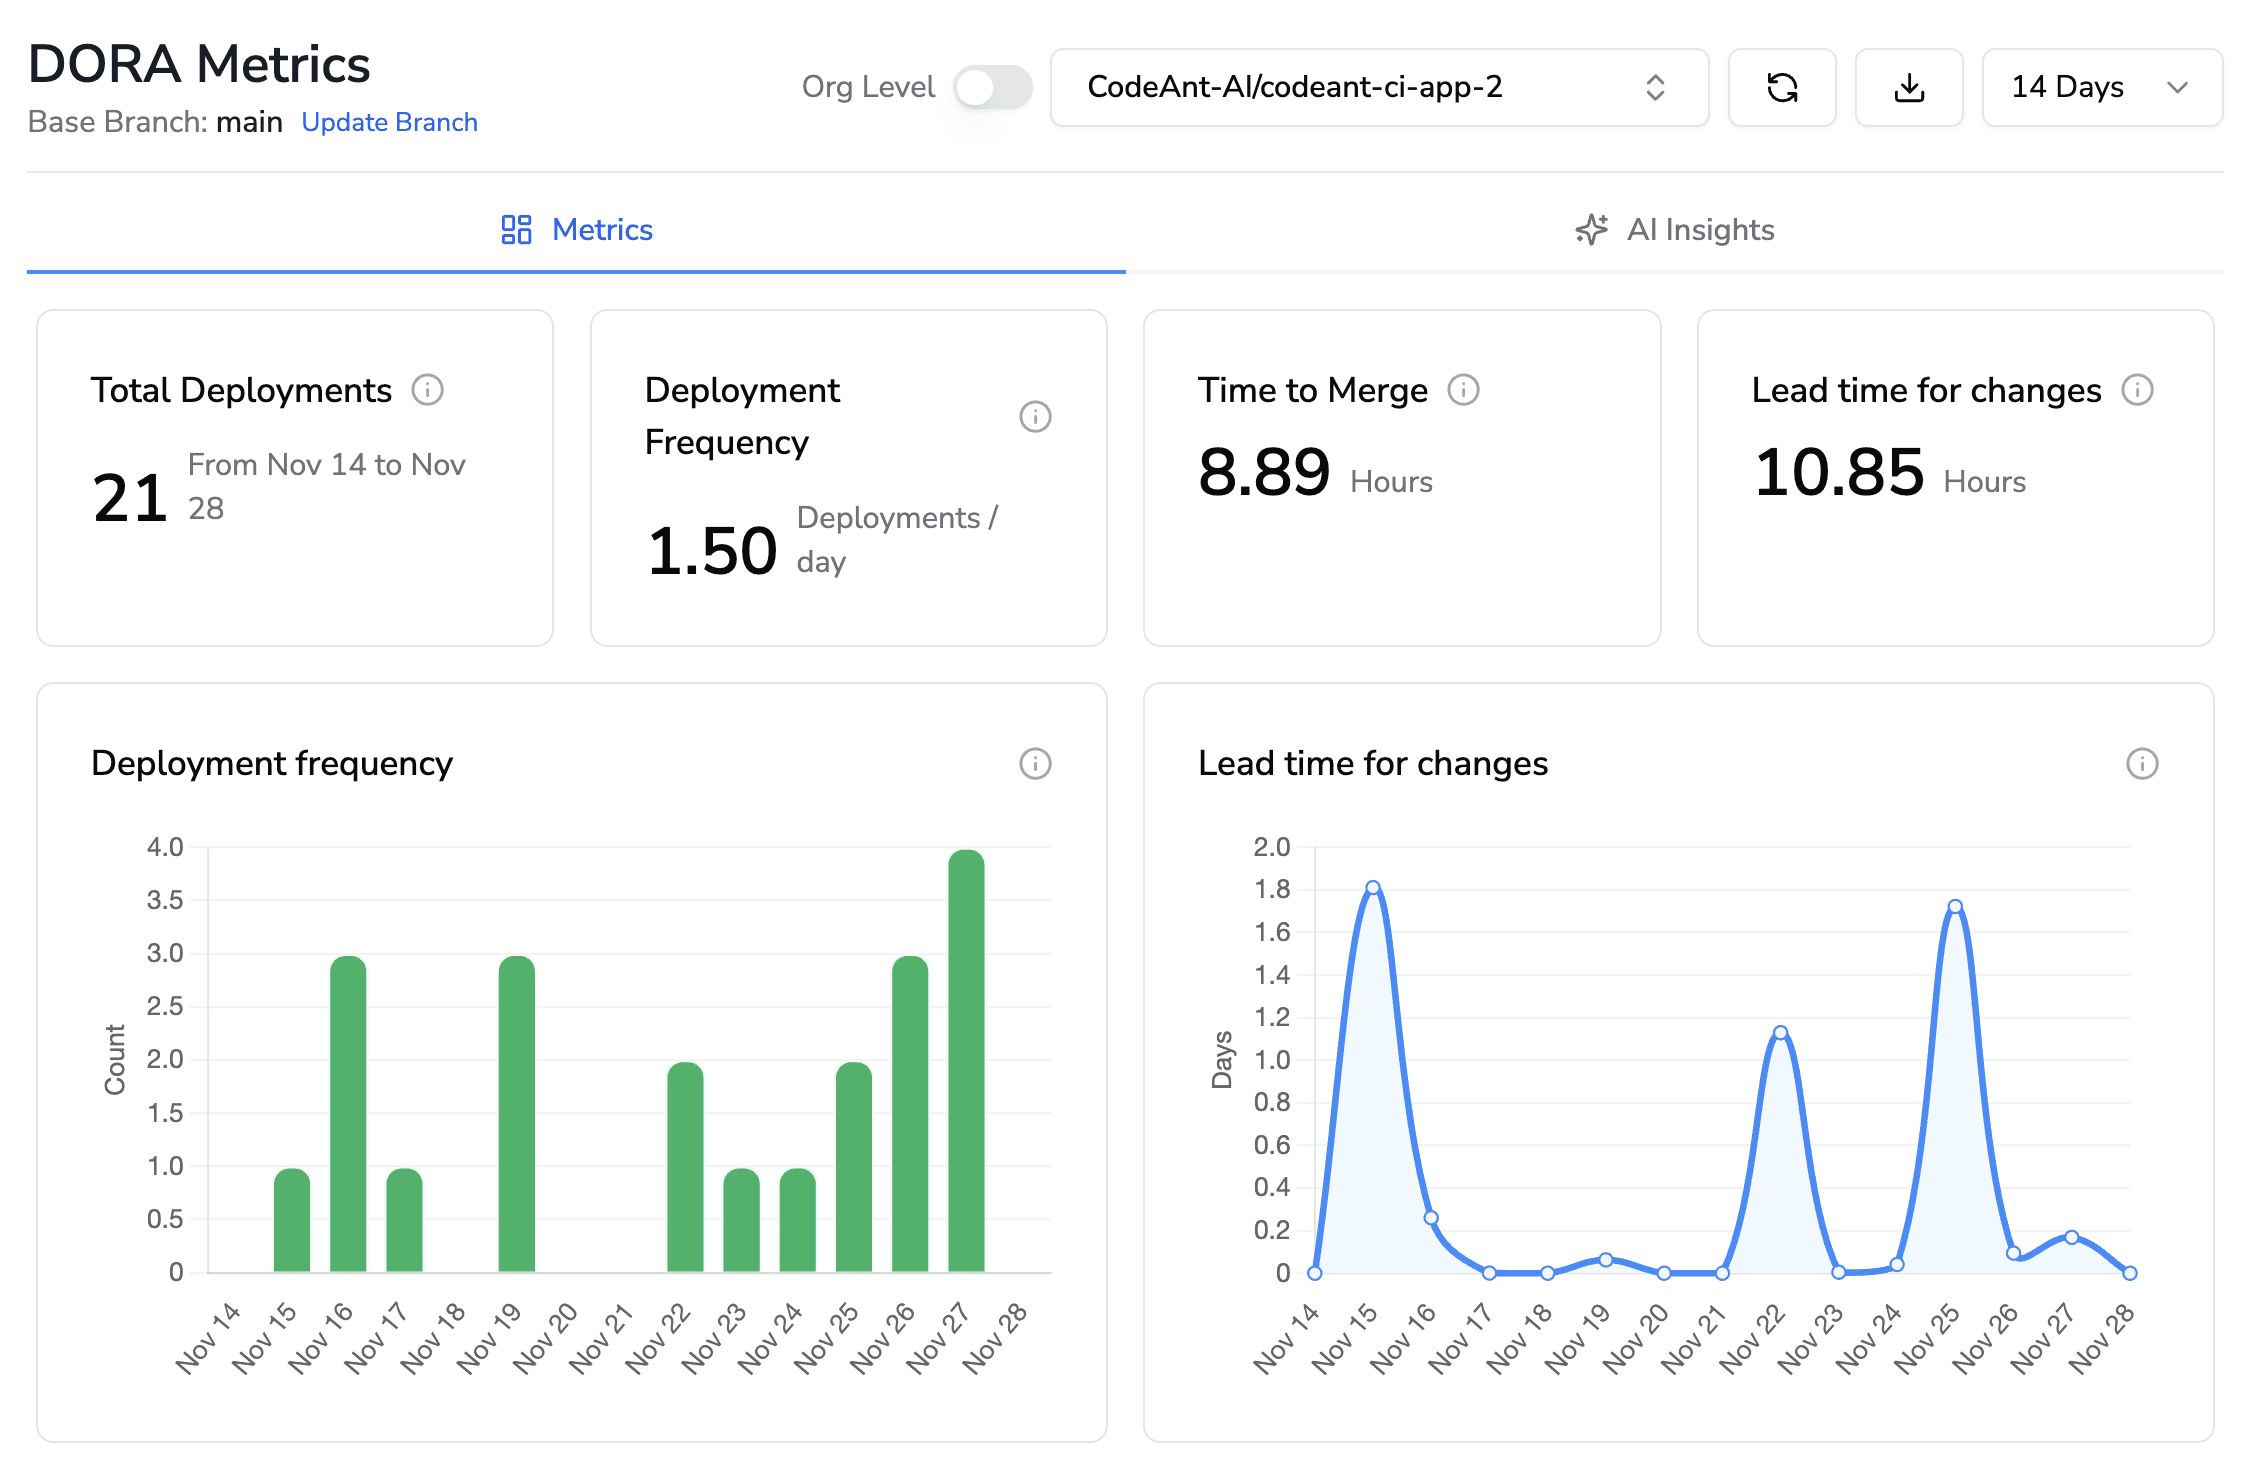
3. DORA plus Review Dashboards
CodeAnt doesn’t stop at raw DORA numbers. Its Engineering Productivity view merges DORA metrics with review and quality data. Teams see a unified dashboard that shows deployment frequency and lead time alongside PR velocity and code risk indicators. This contextualizes delivery metrics with quality signals.
In practice, leaders can hover over a lead-time spike and immediately see if it was caused by long reviews or failing checks. CodeAnt’s documentation (e.g. DORA Metrics module) even tracks review-related timings (first-to-merge, approval delays) as part of its DORA reporting. In short, CodeAnt’s dashboards prevent DORA from being a black box, making it easy to drill into root causes.
4. Developer 360 and Outcome Metrics
Beyond aggregate metrics, CodeAnt offers developer-centric analytics. Its Developer 360 suite provides individual productivity profiles (commits, PRs, code churn) and team performance benchmarks.
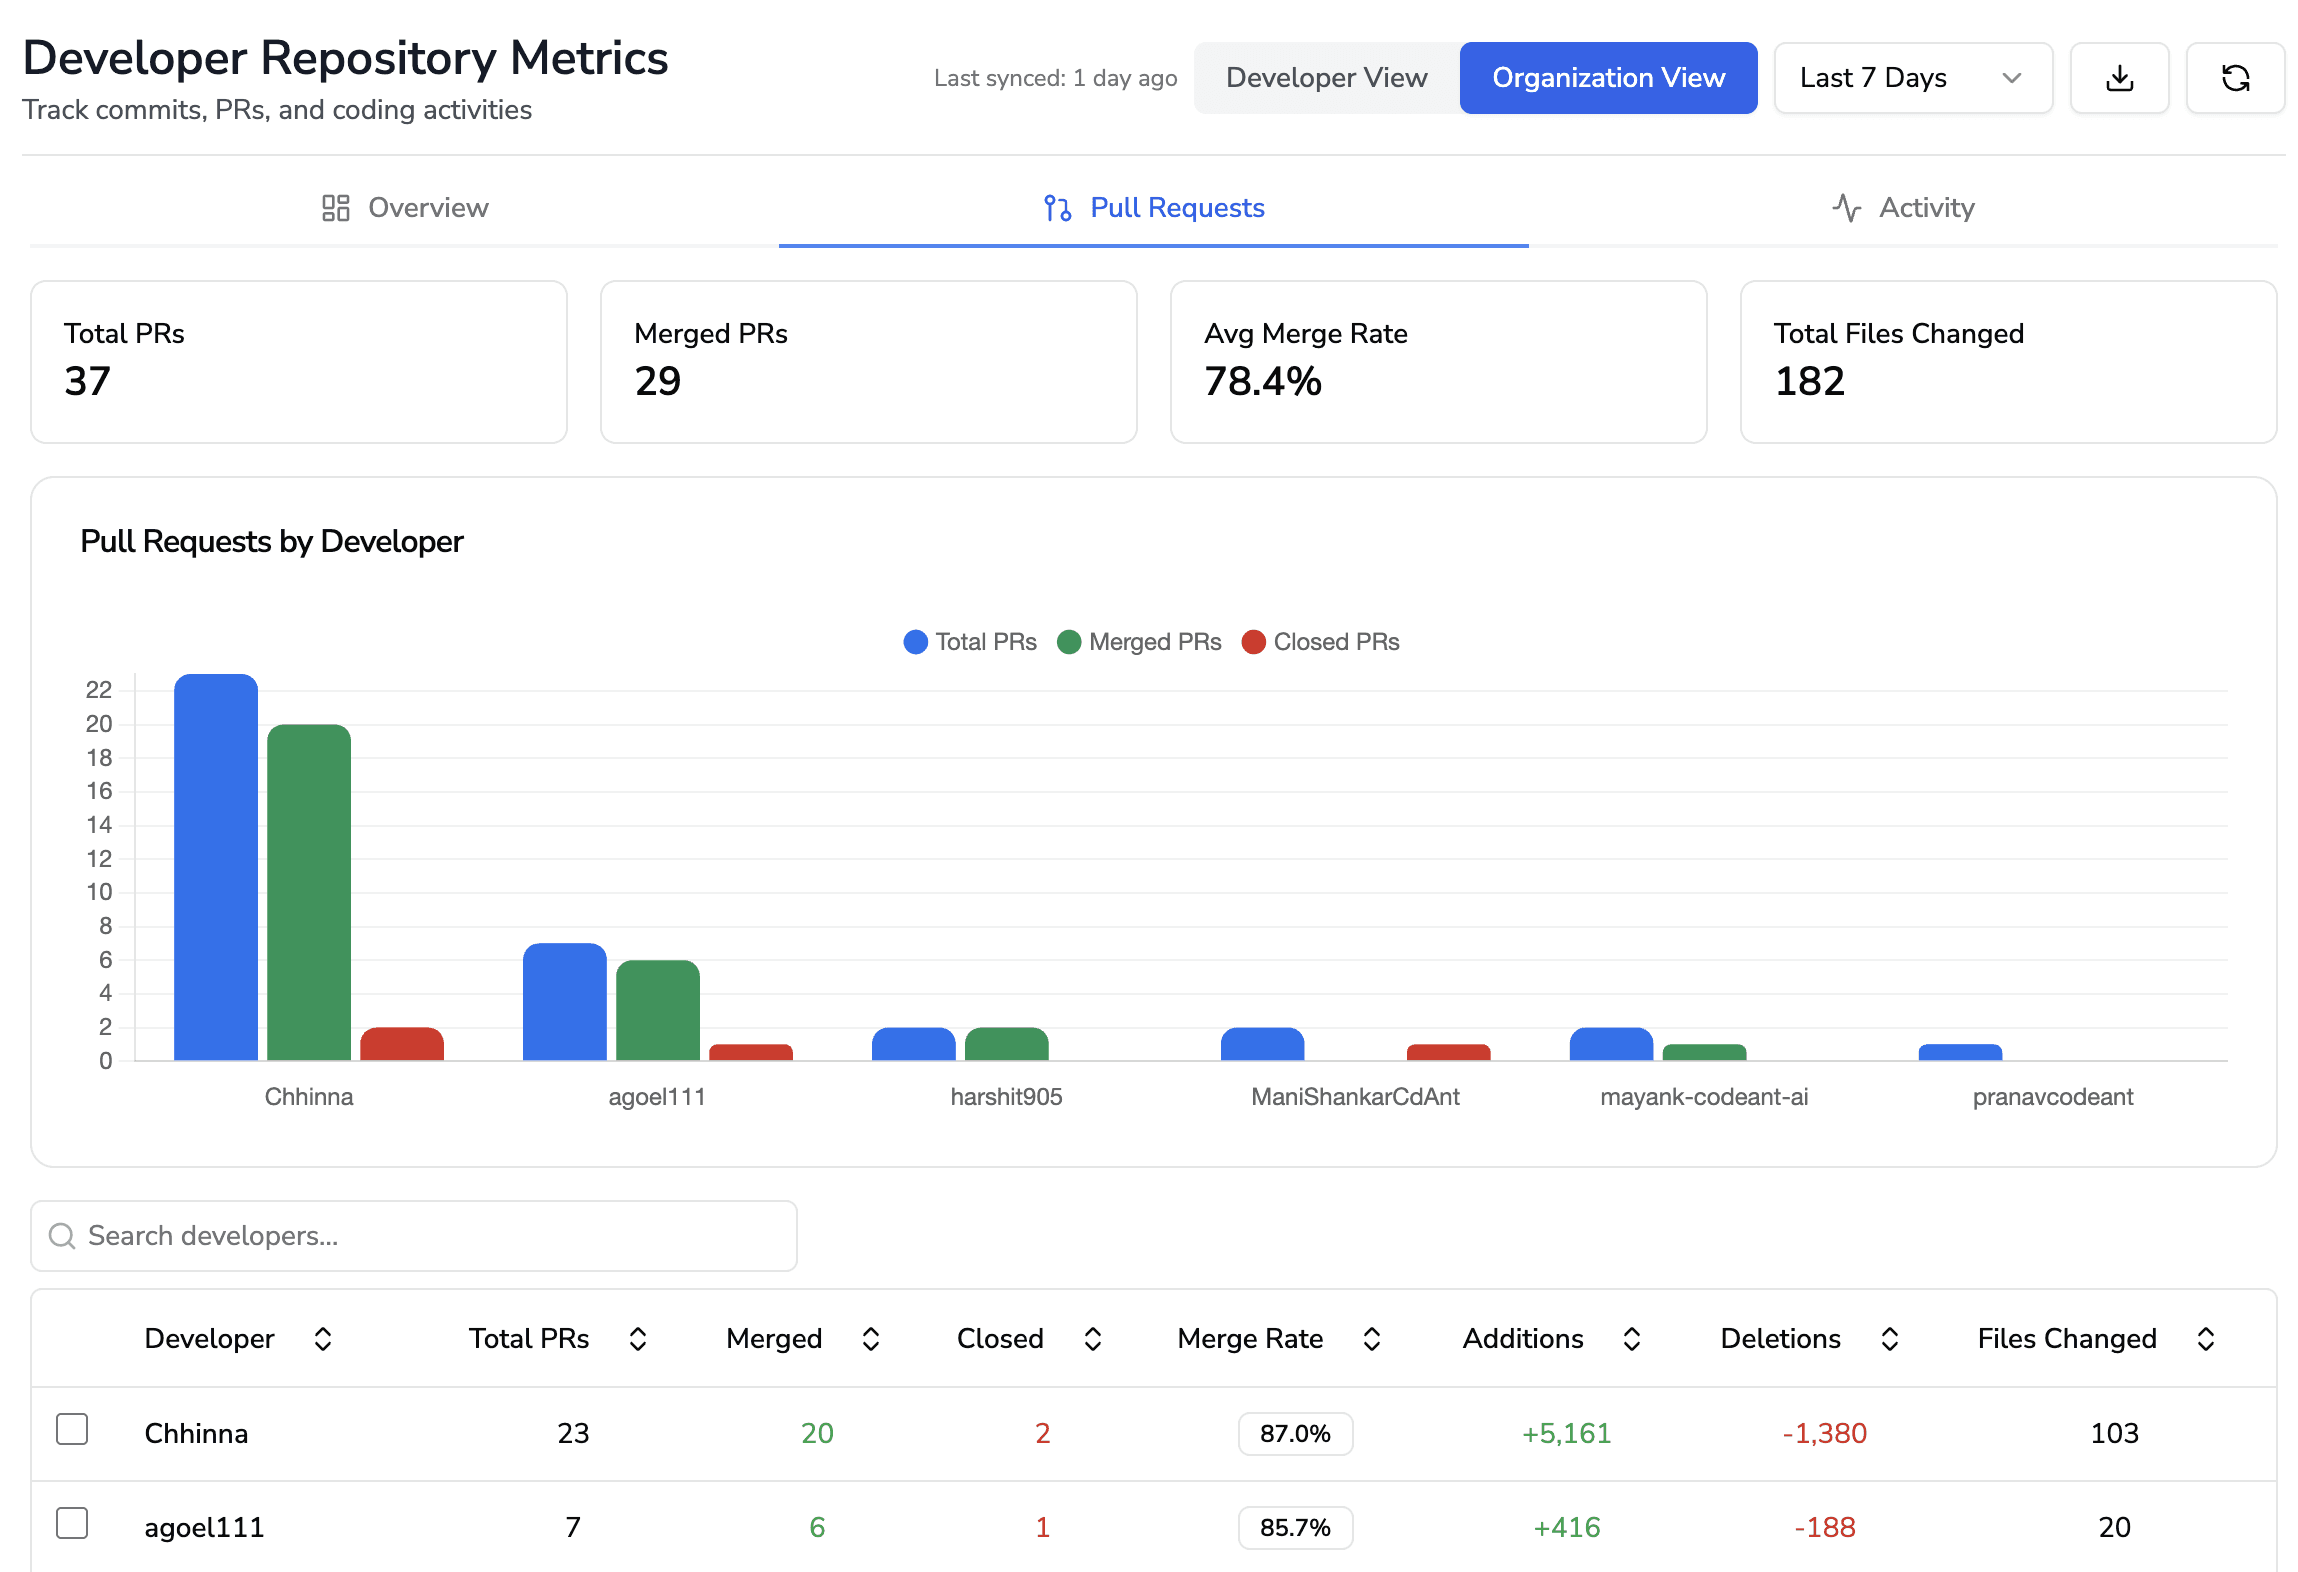
For example, it can flag if a particular team is frequently rebasing or churning code (a sign of instability or debt). It also tracks collaboration patterns (who reviews whose code), reflecting knowledge sharing. While respecting privacy, this helps spot if onboarding is lagging or if knowledge silos exist.
Additionally, CodeAnt allows integration of business and project metrics (e.g. linking Jira data), so you can correlate velocity with actual feature delivery. This aligns the engineering performance picture more closely with business goals.
5. Developer Experience Signals
CodeAnt is also building features around developer satisfaction. It can correlate metrics like “time spent in focus mode” or number of context switches (from IDE data) with performance, helping quantify the cognitive load on engineers. Custom dashboards let leadership see trends in developer time allocation and interruptions. By surfacing these signals early, CodeAnt helps teams act before issues become morale problems.
In summary, CodeAnt’s platform turns the missing pieces of DORA into concrete metrics and insights. It fills the code-quality, review-speed, and developer-experience gaps by automatically computing them from the code repository and developer tools. This 360° view helps leaders diagnose why performance changed (not just that it changed).
Conclusion: Choose Metrics Wisely and Learn Fast
DORA’s four metrics are powerful indicators of delivery health, but they shouldn’t be the only thing engineering leaders watch. When teams fixate solely on DORA, they risk ignoring the very factors that drive long-term success: code quality, developer engagement, and business value. The evidence is clear: high-performing teams complement DORA with other metrics – for example, measuring developer satisfaction, code coverage, or review turnaround time – to get a full picture.
In practice, this means pair your DORA dashboard with a broader metric set. Measure code review cycle time and test coverage alongside lead time and deploy frequency. Use developer surveys and collaboration analytics to catch early signs of burnout or misalignment. And always interpret data in context: compare like-for-like services, adjust for regulated domains, and remember that “good” values depend on your goals, not blind targets.
By acknowledging where DORA succeeds and where it fails, engineering leaders can steer teams toward true performance improvement, not metric chasing. Tools like CodeAnt.ai are designed for this modern approach: they augment DORA metrics with code-quality and developer-centric analytics, making every missed detail visible. To see these insights in action, consider trying CodeAnt.ai. Book your free 1:1 with our experts… and let your metrics tell the whole story so you can help your teams deliver better software, faster.
Additional sources to check:
https://docs.codeant.ai/control_center/dora_metrics/orgdorametrics/github
https://www.codeant.ai/code-quality/code-test-coverage
https://www.codeant.ai/blogs/code-review-signals
https://docs.codeant.ai/engineering_productivity/dev_metrics
FAQs
If my DORA metrics are green, why does my engineering team still feel slow?
Do DORA metrics hide technical debt, and can that create a false sense of engineering health?
Why doesn’t improving DORA metrics always improve developer satisfaction or reduce burnout?
Can DORA be gamed, and how do teams avoid optimizing for the wrong outcomes?
What should teams measure in addition to DORA to get a complete picture of engineering performance?


