

You're staring at a pull request with 47 files changed, and somewhere in there is a bug that's going to wake you up at 2 AM. The problem isn't your team's skill, it's that raw diffs and text-based feedback make it nearly impossible to see what actually matters.
Visual change insights flip this dynamic by surfacing code risks, quality trends, and security issues through dashboards and graphical representations instead of walls of text. This guide covers how to use visual tools to catch problems earlier, reduce review time, and build more reliable software across your entire development lifecycle.
What Are Visual Change Insights for Code Safety
Visual change insights use dashboards, diff visualizations, and graphical representations to surface code changes, risks, and quality trends at a glance. Instead of reading raw logs or scanning through text-based reports, you see what changed, where the risk lives, and how severe the problem is, all in one view.
Think of it like the difference between reading a spreadsheet of numbers and looking at a chart. Both contain the same data, but one tells a story instantly.
Common types of visual change insights include:
Diff visualizations: Side-by-side views highlighting exactly what changed and where risk areas exist
Quality trend dashboards: Graphs showing maintainability, complexity, and coverage over time
Severity-based issue maps: Color-coded displays that prioritize critical vulnerabilities over minor warnings
Sequence diagrams: Auto-generated flowcharts showing how a pull request affects runtime behavior across modules
For every PR, some platforms automatically generate sequence diagrams that capture the core runtime flow introduced or modified by the change. The goal is to give reviewers a one-shot, high-signal glance at what the PR actually does, which modules interact, in what order, and where the key decision points happen, without forcing them to mentally simulate the code across multiple files.
Why Code Reliability Requires Continuous Visibility
Point-in-time audits fail because code changes constantly. A security scan from last month tells you nothing about the vulnerability introduced yesterday. Hidden issues compound into technical debt, and by the time you notice, the cost of fixing them has multiplied.
Continuous visibility means automated scanning on every commit, with real-time dashboards that surface problems the moment they appear. Teams cannot fix what they cannot see, and they certainly cannot fix it fast if they discover issues weeks after the code was written.
Approach | When Issues Are Found | Typical Fix Cost |
Periodic manual audits | Weeks or months after introduction | High (context lost) |
Continuous automated scanning | At pull request time | Low (developer still has context) |
Platforms like CodeAnt AI provide this unified, always-on view of code health across your entire codebase.
How to Ensure Code Quality with Automated Reviews
Manual code reviews catch a lot, but humans get tired, distracted, and pressed for time. Automated reviews fill the gaps by catching issues consistently, every single time, without fatigue.
AI-Powered Line-by-Line Feedback
AI reviews each line of a pull request, flagging bugs, anti-patterns, and style violations. It acts as an always-available expert reviewer that never rushes through a Friday afternoon PR.
The best AI reviewers go beyond syntax. They understand your team's coding patterns, architectural decisions, and historical context. This means suggestions that actually make sense for your codebase, not generic warnings you'll ignore.
Automated Coding Standards Enforcement
Every team has standards: naming conventions, formatting rules, architectural patterns. Enforcing them manually creates friction and inconsistency. Automated tools apply rules uniformly across every pull request, without anyone playing "style police."
Catching Bugs and Code Smells Before Merge
Code smells are indicators of deeper problems, duplicated logic, overly complex functions, or tightly coupled modules. They might not break anything today, but they make tomorrow's bugs harder to find and fix. Catching code smells before merge is critical because once problematic code lands in your main branch, it becomes everyone's problem.
How Static Analysis Strengthens Code Reliability
Static analysis, also called Static Application Security Testing (SAST), examines code without running it. This allows it to find issues that testing alone often misses, like unreachable code paths or potential null pointer exceptions.
Detecting Complexity and Maintainability Issues
Cyclomatic complexity measures how many independent paths exist through your code. High complexity correlates directly with more bugs and longer debugging sessions. Visual dashboards surface complexity metrics in plain terms, showing which files desperately need refactoring.
Identifying Security Vulnerabilities Early
Static analysis finds common vulnerabilities, injection flaws, insecure configurations, hardcoded credentials, before code reaches production. The earlier you catch security issues, the cheaper they are to fix.
Tracking Quality Trends Over Time
A single snapshot tells you where you are. Trend visualization tells you where you're heading. Are complexity scores improving sprint over sprint? Is technical debt accumulating faster than you're paying it down? Historical charts answer questions like this at a glance.
How to Visualize Security Vulnerabilities Before Production
Security-specific visual insights accelerate remediation by showing vulnerabilities in context. Instead of a wall of text alerts, you see exactly which file, which line, and how severe the issue is.
Scanning for Secrets and Misconfigurations
Accidentally committed API keys, passwords, and tokens remain one of the most common security incidents. Automated scanning surfaces secrets with clear visual alerts—often before the PR even gets reviewed by a human.
Monitoring Dependency Risks in Real Time
Third-party libraries introduce risks you don't control. A vulnerability in a popular package can affect thousands of applications overnight. Visual dependency graphs show which packages are outdated or vulnerable, updated in real time as new CVEs are published.
Prioritizing Fixes with Severity-Based Dashboards
Not all vulnerabilities are equal. Color-coded severity ratings help teams triage effectively rather than drowning in alerts:
Severity | Description | Recommended Action |
Critical | Exploitable vulnerability in production path | Fix immediately before merge |
High | Significant risk requiring prompt attention | Fix within current sprint |
Medium | Moderate risk with limited exposure | Schedule for upcoming sprint |
Low | Minor issue or best-practice violation | Address during refactoring |
How CI/CD Pipelines Surface Real-Time Safety Insights
Integrating code quality tools into your CI/CD pipeline, the automated build, test, and deployment process, provides instant feedback on every commit. No waiting for a scheduled scan. No hoping someone remembers to run the linter.
Integrating Quality Gates into Your Pipeline
Quality gates are automated checkpoints that code passes before advancing. They enforce standards without slowing developers down, because the feedback arrives while the developer still has context on what they wrote.
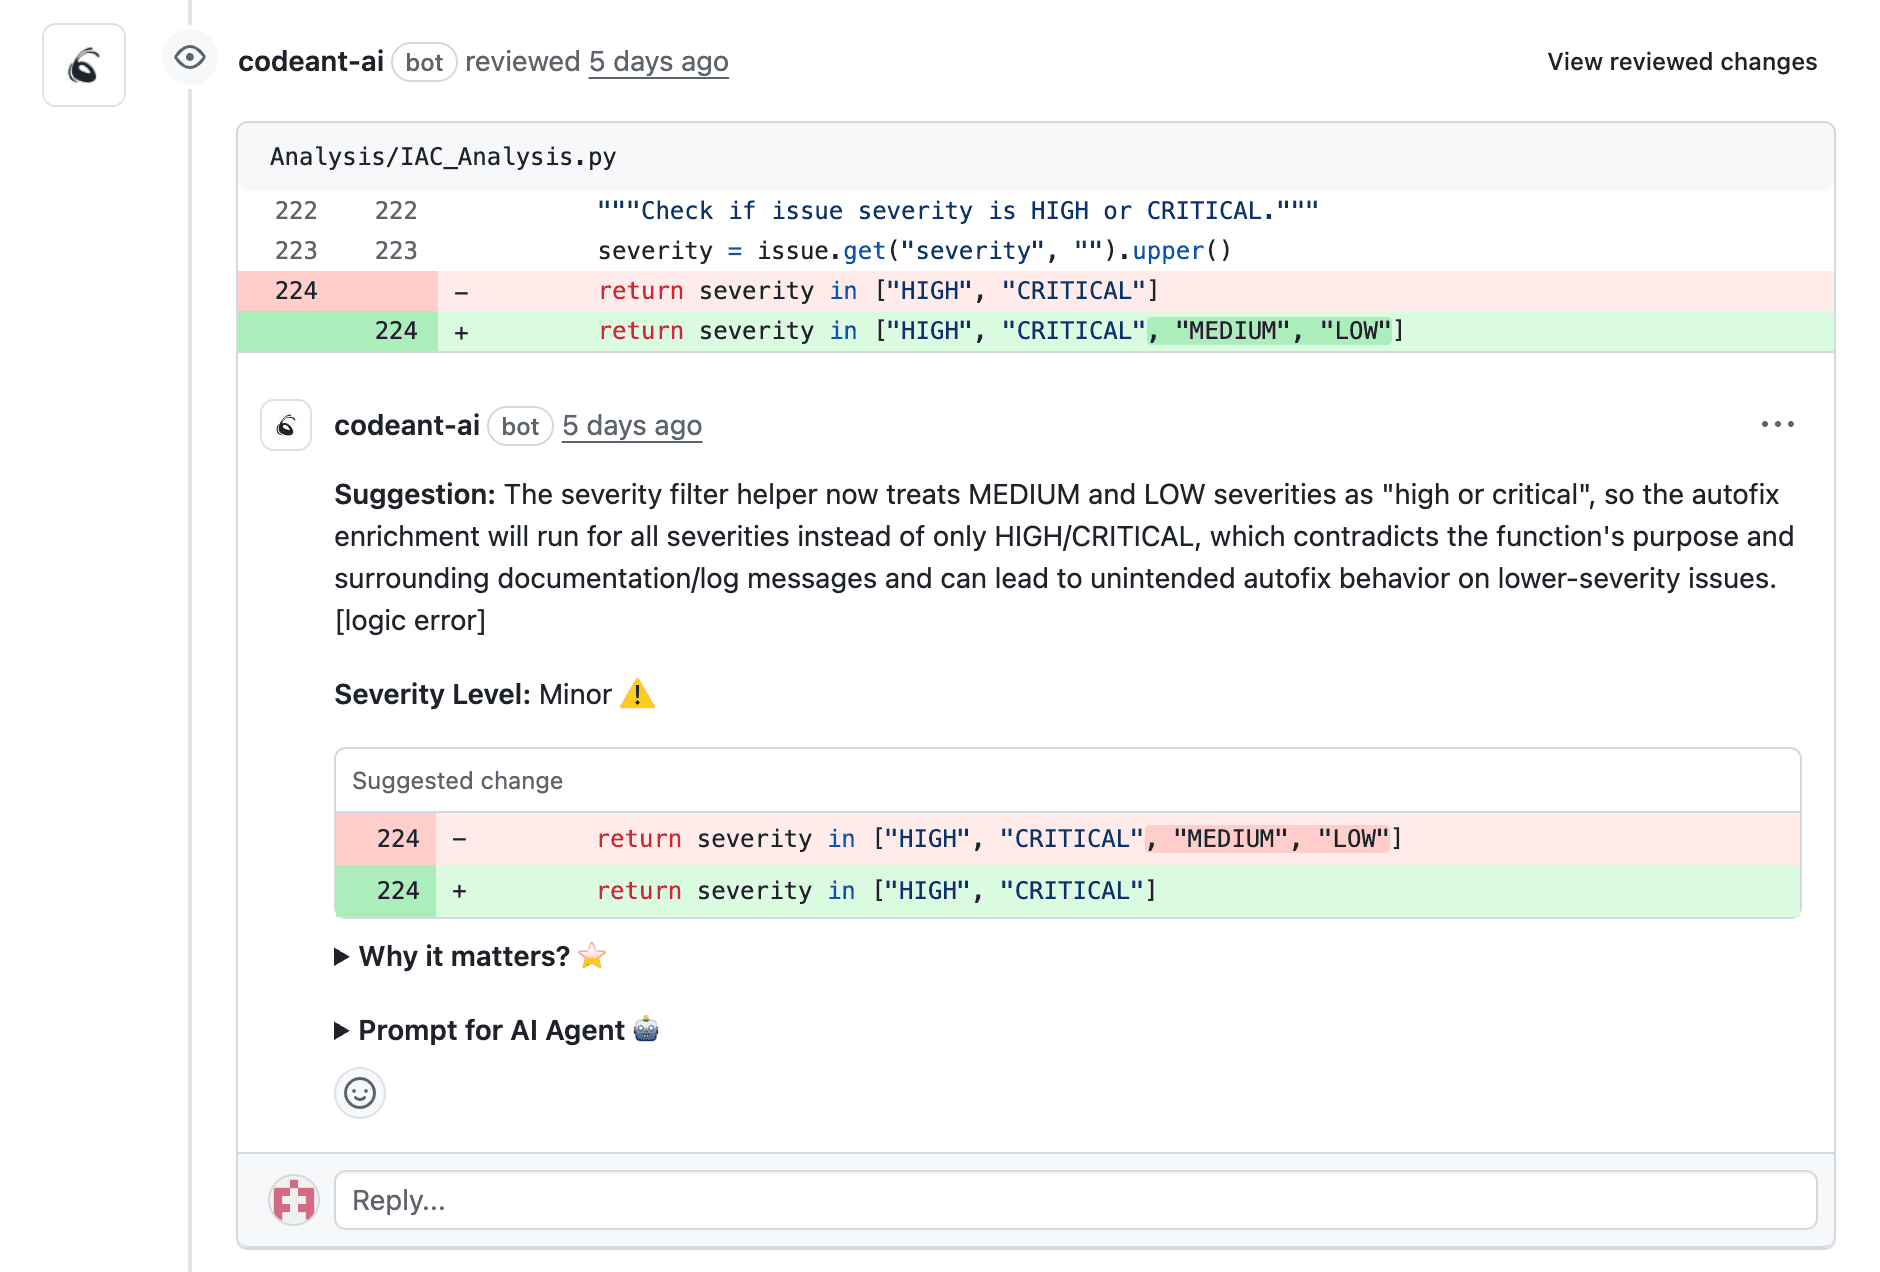
Surfacing Issues at Pull Request Time
The best place to see issues is inline within the pull request interface. Developers get immediate context without switching tools. Comments appear right next to the problematic code, with explanations and often suggested fixes.
Blocking Risky Merges Automatically
Configurable merge policies prevent code that fails security or quality thresholds from reaching your main branch. CodeAnt AI supports configurable merge policies that block risky code automatically while still allowing teams to set their own thresholds.
Key Metrics to Track for Code Health and Reliability
Metrics without visualization overwhelm teams. Dashboards make data actionable by surfacing trends and anomalies at a glance.
Code Coverage and Test Pass Rates
Code coverage measures the percentage of code exercised by tests. It's a useful signal, though not sufficient on its own—you can have 100% coverage with tests that don't actually verify correct behavior.

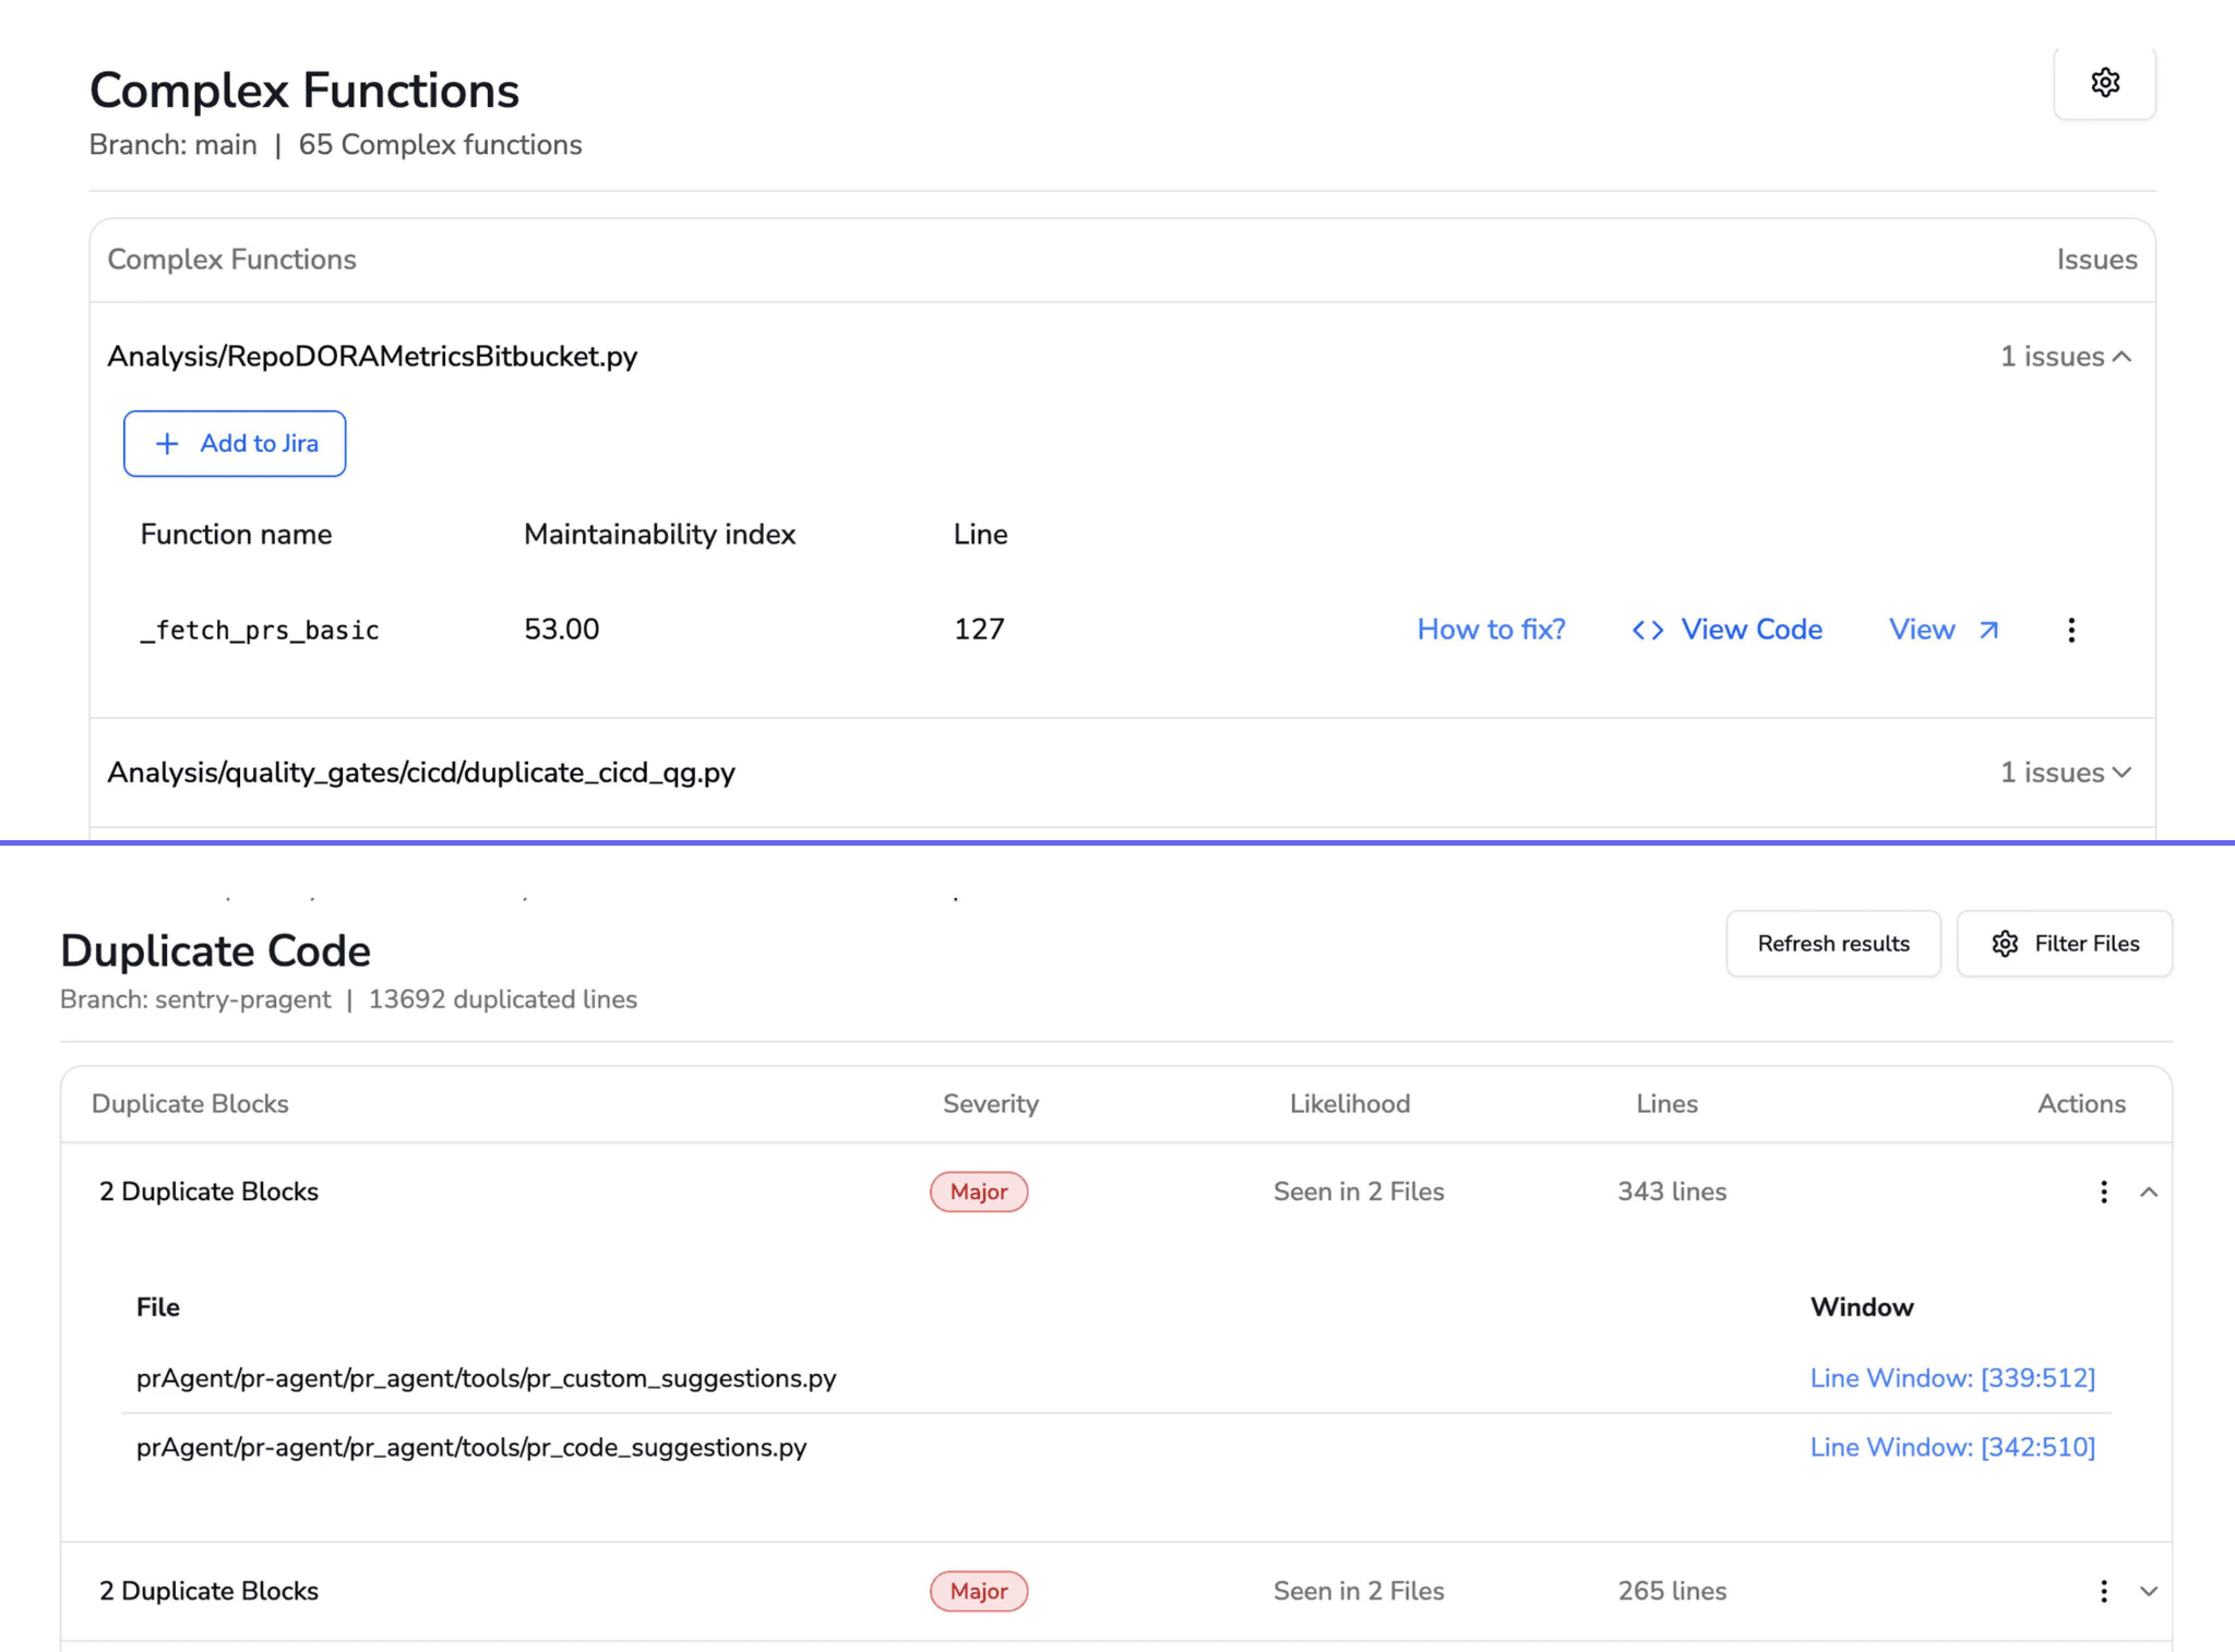
Complexity and Duplication Scores
High complexity and duplicated code correlate with more bugs and higher maintenance burden. Visual trend lines reveal whether complexity scores are improving or regressing over time.
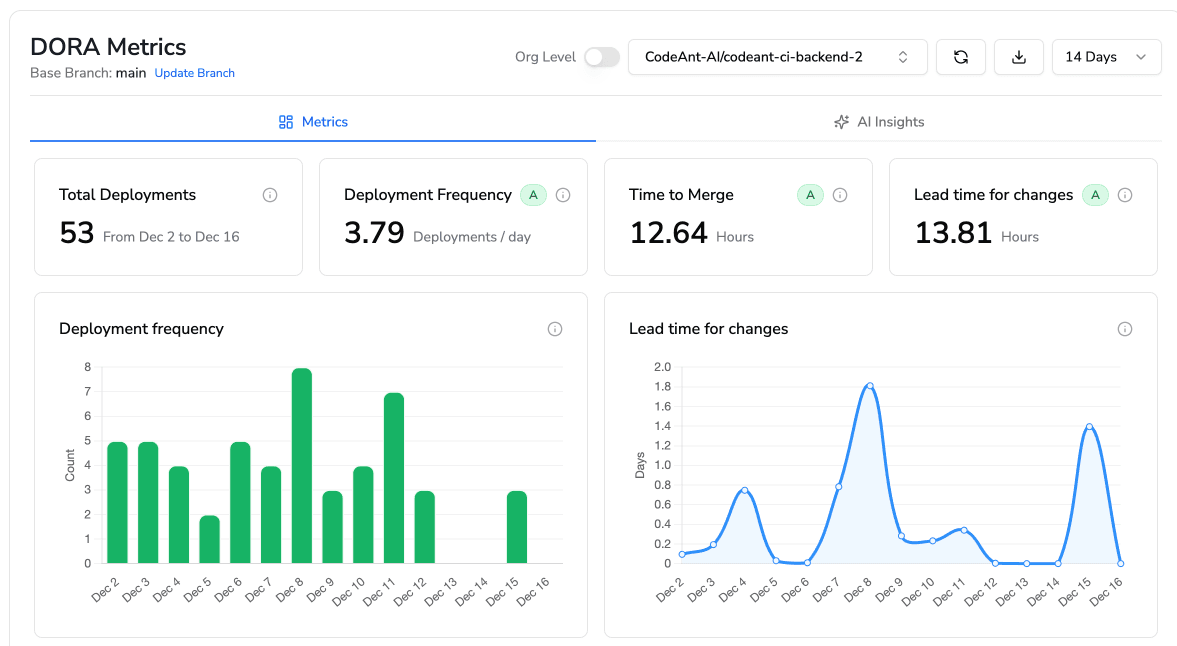
DORA Metrics for Release Reliability
DORA metrics—Deployment Frequency, Lead Time for Changes, Change Failure Rate, and Mean Time to Recovery—connect code quality directly to business outcomes. They answer the question: "Is our engineering investment actually making us faster and more reliable?"
How to Ensure the Quality of Your Code with Unified Dashboards
Fragmented tools create blind spots. When security lives in one dashboard, quality in another, and productivity metrics in a spreadsheet somewhere, nobody has the full picture.
Unified dashboards consolidate everything into a single view:
Security posture: Open vulnerabilities, secrets exposure, dependency risks
Code quality: Complexity trends, duplication, maintainability scores
Review efficiency: Time to review, comments per PR, merge frequency
Compliance status: Policy violations, governance checks, audit readiness
CodeAnt AI's single-pane-of-glass approach eliminates tool sprawl and gives engineering leaders the comprehensive overview they actually need.
How to Reduce Technical Debt with Visual Quality Insights
Technical debt is the implied cost of rework caused by choosing an easy solution now instead of a better approach that takes longer. Every team accumulates it. The question is whether you're managing it strategically or letting it compound silently.
Check out our interesting reads on:
9 tools to measure technical debt in 2026
How automated code quality reduce technical debt
Visual insights make debt visible and quantifiable:
Identify hotspots: Use visual maps to find files with the highest complexity and churn
Track debt over time: Monitor whether refactoring efforts are actually reducing the overall burden
Set debt budgets: Establish thresholds that trigger alerts when debt exceeds acceptable levels
When you can see the debt, you can prioritize paying it down before it becomes a crisis.
Build Safer Code Faster with a Unified Code Health Platform
Visual change insights transform code safety from reactive firefighting to proactive prevention. Instead of discovering vulnerabilities in production, you catch them at pull request time. Instead of guessing where technical debt lives, you see it on a dashboard.
Disconnected tools create dangerous gaps. A unified platform brings security, quality, and automation together, helping teams build safer code faster without sacrificing velocity.
Ready to see your code health in one unified view? Check out our all in one unified code health platform.

